ward-propagating portion of this fluorescence passes through a long-wave pass fdter = 550nm) to a silicon photodiode detector (Hamamatsu, UK). The launch and detection filter com- bination minimises detection of the LED signal without significant curtailment of the fluorescence signal. The output from the detec- tor is passed to the lock-in amplifier for synchronous detection with the LED pulsing signal.
.- [lOO%N 7 1 0 0 % N 7 1 0 0 % N ? 100%N 7
100% 0 2
0 100 200 300 400 500
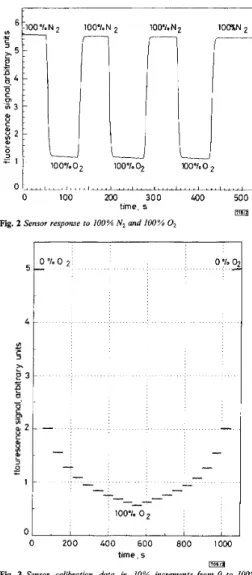
time. s Fig. 2 Sensor response to 100% N2 and 100% O2
0 % 0 2 I
I I I I , I
0 200 400 600 800 1000
time, s
Fig. 3 Sensor calibration data in 10% increments from 0 to 100% oxygen
All measurements were made at atmospheric pressure. The sen- sor response to alternate environments of 100% NI and 100% 02, respectively, is shown in Fig. 2. These data show the high level of repeatability of the measurement process and the high signal-to- noise ratio (-150 for 100% NJ achieved with system optimisation. The sensor response time is very short, less than 5s, without removing the contributions of the filling time of the gas chamber and the adjustment time of the mass-flow controllers. Calibration data for the sensor at 10% intervals over the range 0- 100% oxy- gen are shown in Fig. 3. These measurements illustrate the absence of hysteresis over the full concentration range. Furthermore, the inherent nonlinear dependence of the quenching process on oxy- gen concentration, predicted by eqn. 1, is obvious. The bimolecu-
ELECTRONICS LElTERS
26th May 1994
Vol.
30
lar quenching constant k, which characterises the nonlinear response, depends explicitly on the rate of diffusion of the oxygen molecules through the microporous structure. By adjusting the sol- gel process parameters, it is possible to control the coating micro- structure in order to optimise sensitivity in the concentration range of interest.
Conclusion: We have demonstrated the first intrinsic fibre optic oxygen sensor which uses LED excitation and photodiode detec- tion. The results presented show a high level of Sensor perform- ance and establish the viability of low-cost portable oxygen sensors based on the sol-gel process. The flexibility of this process enables the tailoring of coatings for specific applications, such as for dissolved oxygen. Finally, the expected commercial availability of blue-green laser diodes in the near future will enable the appli- cation of the principles demonstrated here to remote, multiplexed or (quasi-)distributed oxygen sensing.
8 IEE 1994
Electronics Letters Online No: 19940578
B.D. Mac Craith, G . O’Keeffe, C. McDonagh and A.K. McEvoy
(School of Physical Sciences, Dublin City University, Glasnevin, Dublin 9, Ireland)
7 April 1994
References
1 HAUSER, P.c., and TAN, s.s.: ‘All-solid-state instrument for fluorescence-based fibre optic sensors’, Amlyst, 1993, 118, pp. 991- 995
2 BRINKER. c J. and SCHERER, G.w.: ‘Sol-gel science (Academic Press, New York, 1990)
3 MAC CRAITH, B.D., RUDDY, v., POTIZR, c . , O’KELLY. B., and
MCGILP, J.F.: ‘Optical waveguide sensor using evanescent wave excitation of fluorescent dye in sol-gel glass’, Electron. Lett., 1991,
27, (14), pp. 1247-1248
4 DING, J.Y., SHAHRIARI, M.R., and SIGEL, G.H.: ‘Fibre optic pH sensors prepared by sol-gel immobilization technique’, Electron. Lett., 1991, 27, (17), pp. 1560-1561
fibre methane gas sensor using high-index overlay’, IEE Proc. J, 1993, 140, (Z), pp. 115-1 18
waveguide sensor, PCT Patent Application, PCTiGB 92/00428, 19928
MAC C R A m , B . 0 : ‘Enhanced evanescent wave sensors using sol-gel derived porous glass coatings’, Sensors and Actuators B, 1993, 11, (1-3), pp. 29-34
5 MUHAMMED, F.A., and STEWART, G.: ‘Sensitivity enhancement of D-
6 MCGILP, J.F.. MAC CRAITH, B.D., OKELLY, B., and RUDDY, V.: ‘A
7
Measuring emission cross-section profile of
erbium-doped fibre with low input power
C.-Y. Chen, S. Wen and S. Chi
Indexing terms: Fibre lasers, Laser theory. Optical variables measurement
A simple and elegant method is proposed to measure the emission cross-section profile of erbium-doped fibre by using a short piece of erbium-doped fibre with input pump or signal power less than 1mW. Relative error is within I % over the whole spectrum. The theoretical and experimental results are discussed.
Introduction: The erbium-doped fibre amplifier (EDFA) has been shown to he an effective and promising component for optical fibre communication systems [I]. Accurate emission cross-sections are essential in the modelling of EDFA performance [2]. Previous work used very short EDF length (<0.2dB small-signal absorp- tion) pumped with 70mW at 978nm from a Ti:sapphire laser to measure the fluorescence spectrum of the EDF [3]. Recently, we reported that a broadband fluorescence spectrum will be generated in the 1500nm band with low input pump or signal power due to the phonon interaction of Stark energy levels in EDF at room temperature [4]. In this Letter we show that the emission cross-sec- tion profile of EDF can be measured by using a short piece of
EDF with low input power at a wavelength in the proximity of the absorption band at long wavelength as well as at short wave- length.
Theory: A homogeneously broadened model is used, where we consider a number of optical beams within the homogeneous bandwidth of the amplifier to resolve the spontaneous emission spectrum [5]. The convective equations describing the spatial development of the pump power
P,
and the spontaneous emission powers P,' copropagating and counterpropagating to the pump in the EDF are= PJ,(u,,N2 - o , , N l ) - a,,P, (1) d r
f 2UekN2rkhVkAVk CX,,P:
where NI and N 2 are the population densities of the ground level and metastable level, q,, q,, a, and
r,
are the emission cross-sec- tion, absorption cross-section, intrinsic fibre loss and confinement factor atA,,
respectively. Eqns. 1 and 2 are solved under the steady-state conditions (i.e. dN,ldt = 0, i = 1, 2) to yield the output fluorescence powers. bandpass tunable splice splice , ) -& l e d 980nm attenuator LOpower, - coupler PC connector meter
'
8 isolatorm
Optloll
spectrum analyser
Fig. 1 Experimental setup for measurement of fluorescence spectrum
Experiment: An experimental setup for measuring the fluorescence spectra of EDF similar to that used in [4] is shown in Fig. 1. The input sources were 1532 or 1550nm from a narrow linewidth external cavity tunable semiconductor laser and 980nm from a strained multiquantum well laser diode. The optical isolators and an angled F'C-type connector were used to avoid reflections from the fibre ends or the grating of the optical spectrum analyser. The output power from the source was coupled by a 2 x 1 wavelength independent 3dB optical fibre coupler or a 9801 1550 nm dichroic coupler into the erbium-doped fibre. The EDF used in this experi- ment had a core diameter of 5 p n , an NA of 0.24, a cutoff wave- length of 1.12pm, and an unpumped attenuation of 8.6 and 4.4 dB/m at 1530 and 1 5 5 0 ~ 1 , respectively. The EDF was cut out a short length at a time from splicing point b then fused again, and the measurement procedures were repeated.
;
1.08
%
0.89
0.6f
0.4 0.2-
i
0.0 wavelength, nm wavelength, nm @m Fig. 2 Theoretical and experimental results of normalised backward fluorescence power spectra f o r various EDF lengths with -1OdBm input power at 1550nmResults and discussion: Fig. 2 shows the theoretical and experimen-
tal results of backward fluorescence spectra normalised to their fluorescence peaks with l/A3 wavelength dependence for various EDF lengths with an input power of -10dBm at 1550nm. The emission cross-section profile used in the theoretical calculation, also shown as a dashed curve, which overlaps with the Icm curve in the left of Fig. 2, was actually obtained from the measured
emission cross-section profde of the l c m curve showed in the right of Fig. 2. It can he seen that the profde of the fluorescence closely resembles the emission cross-section as the EDF length shortens. A similar result can be obtained for input wavelength at 1532 and 980nm. This can be explained by eqn. 2 in that, when the EDF length is short enough, the attenuation of the pump power is neg- ligible and can be assumed to be a constant along the EDF, and for a highly doped EDF the intrinsic fibre loss is negligible when compared with the other two terms. Thus the fluorescence power spectrum can be approximated as
P
,
'
= 2UekN2rkhVkAVkL (3) where L is the length of the EDF. Eqn. 3 indicates that the fluo- rescence power is linearly proportional to o,,, thus the profile of the emission cross-section spectrum can be measured by normalis- ing the fluorescence power spectrum with vAv or M / A 3 .0 8 0 4
s
0 0 0 0, 'ii -0 4e
-
10 mW -0 81
1450 1500 1550 1600 165C wavelength, nmm
Fig. 3 Spectra of relative error of emission cross-section profile with
I cm EDF length for 0.1 and IOm W input power level at various pump wavelengths
980nm . . . 1 5 3 2 m ___ 1550nm _ ~ _ _ _
The relative error of the emission cross-section profile can he defined as the ratio of the difference between the value obtained theoretically and the value used in the theoretical calculations. Fig. 3 shows the percentage of relative error against wavelength for Icm EDF length with 0.1 and lOmW input power. It can be seen that the value of the relative error is less than 1% over the whole spectrum and is smallest at the emission cross-section peak. Also notice that although the EDF is as short as 1 cm, the value of the relative error is higher for 980nm pumping than that for 1532 or 1550nm pumping. -2 10
I
E.;
lb
2
E
18
8
e
2-
r -8 10 1 cr3lo-'
10' input power,mWFe.
4 Fluorescence output power against input pump power at various pump wavelengths for different EDF lengths_____ 9 8 0 m . . . 1532~11 __ 15501x11
Fig. 4 shows the theoretical results of the backward fluorescence power against input pump power at 980, 1532 and 1550nm for
various EDF lengths. It can he seen that the fluorescence output power with IOOmW pumping is approximately one order of mag- nitude larger than that with O.lmW and is about four times larger than that with ImW. High pump power around 980nm is not easy to obtain with a semiconductor laser diode, whereas it is much easier to obtain -1mW power at 1532 or 1550nm. Thus, this method provides a much simpler way to characterise the emission cross-section profile of an EDF.
Conclusions: Measurement of the emission cross-section profile of erbium-doped fibre in the 1500nm band from the fluorescence spectrum with low pump power is theoretically and experimentally investigated. An accurate profile can he obtained with a short length of EDF and with input power less than ImW at a wave length of 980nm in the pump hand or 1532 or 1550nm in the sig- nal band.
8 IEE 1994
Electronics Letters Online no: 19940579
C.-Y. Chen (Telecommunication Laboratories, Ministry of Transportation and Communications, 12, Lane 551, Mintsu Rd. Sec. 3, Yang-Mei, Taoyan, Taiwan 326, Republic of China)
S . Wen (Department of Electrical Engineering, Chung-Hua Polytechnic
Institute, Hsinchu, Taiwan. Republic of China)
S. Chi (Institute of Electro-Optical Engineering and Center of
Telecommunications Research, National Chiao Tung University, Hsinchu. Taiwan, Republic of China)
I1 February I994
References
MEARS, R.I., REEKIE, I.M., and PAYNE, D.N : ‘Low-noise erbium-doped fibre amplifier operating at 1.54pn’, Electron. Lett., 1987, 23, pp.
102tL1028
MIrascALco, WJ.: ‘Erbium-doped glasses for fiber amplifiers at 1500 nm’, J. Lightwave Technol.. 1991, 9, pp. 23&250
RAYBON, G.: ‘Characterization of erbium-doped fibers and application to modeling 980-nm and 1480-nm pumped amplifiers’,
IEEE Photonics Technol. Lett., 1991, 3, pp. 363-365
CHEN, c.Y., and CHI. s.: ‘Attenuation and fluorescence characteristics of optical signals propagating in an erbium-doped fiber’, IEEE
Photonics Technol. Lett.. 1993, 5, pp. 1020-1022
GILES. C.R., and DESLIRVIRE, E.: ‘Modeling erbium-doped fiber amplifiers’, J. Lightwave Technol., 1991, LT-9, pp. 271-283 GILES, C.R., BURRUS, C.A., DIGIOVANNI, D.J., DUTTA, N.K., and
Very broad reflection bandwidth (44nm)
chirped fibre gratings and narrow bandpass
filters produced by the use of an amplitude
mask
M.C. Farries, K. Sugden, D.C.J. Reid, I. Bennion,
A. Molony and
M.J.
Goodwin
Indexing terms: Gratings in fibres, Holographic gratings
Chirped gratings with very broad reflection bandwidths up to 44nm and high reflectivity have heen produced holographically in boroncodoped and standard telecommunications fibres which have been hydrogen-soaked. A 2nm wide transmission band has been produced within the broad reflection hand by use of an amplitude mask during grating exposure.
Fibre gratings with broad reflection bandwidths have many appli- cations in fibre optic systems including fibre amplifier pump reflectors [I] and gain flattening devices [2], dispersion compensa- tion elements [3], and reflectors for sensor arrays [4]. A large reflection bandwidth may be achieved from a uniform period grat- ing with a very strong coupling coefficient [SI, or by the introduc- tion of extrinsic chirp. We have previously reported holographically produced, extrinsically chirped fibre gratings with >95% reflectivity over a 17nm spectral width [I], formed as sur- face-relief structures in polished fibres. The direct writing tech- nique, whereby gratings are produced holographically by UV-
exposure 16,
7,
considerably simplifies the fabrication process. We report here the fabrication of extrinsically chirped gratings which have FWHM spectral reflection bandwidths of 44nm; these gratings have the broadest bandwidths of any fibre gratings yet reported. We report also the use of an amplitude mask during exposure to produce a 2nm wide transmission band within the broad reflection spectrum of the chirped grating, with anticipated applications in wavelength division multiplexed fibre networks. It has heen shown that hydrogen soaking may be used to increase the photosensitivity of low-germania optical fibre [SI, and we have established that standard telecommunications fibre (CorningSMF
28) can be sensitised by hydrogen soaking in this way for grating writing.
Broad bandwidth fibre gratings can be made by writing short, ‘ultrastrong’, uniform period gratings in fibres exhibiting a very high photoinduced index change. This approach has been used to produce gratings with reflection bandwidths of up to 19nm, albeit with significant loss [5]. Methods for fabricating broad bandwidth directly written gratings based on extrinsically chirping the effec- tive grating period by tapering the fibre diameter [9], or by bend- ing the fibre during exposure [IO], have used the constant-period interference pattern derived from two plane wavefronts, and have so far yielded smaller bandwidths. However, chirped period g a t - ings with widely controllable characteristics may be formed using interfering wavefronts of dissimilar curvatures [I], and we report the use of this method.
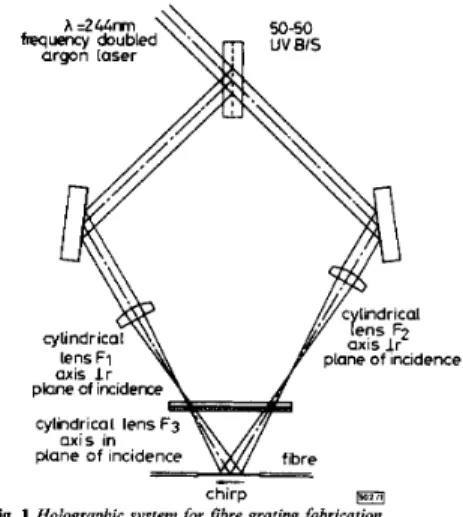
plane of incidence
plane of inciden chirp
Fig. 1 Holographic system for fibre grating fabrication
The holographic arrangement for fabrication of chirped fibre gratings is shown in Fig. 1. The U V source was an argon laser fre- quency doubled to 244nm, which had an output power of between 80 and IOOmW. Two cylindrical lenses (focal lengths 104 and IOOmm) were used to form the curved wavefronts and a cylindri- cal lens was used to focus the interfering beams onto the fibre. By adjusting the relative positions of the cylindrical lenses the band- width of the chirped gratings can be varied from zero chirp to over IOOnm.
=.
20wavelength.nrn
-
wavelength.nrnw Fi 2 Refiectivily and transmiwon of broadband chir e d f h r v gratings
f a k c a r e d in hydrogenated stundard communications &e doped optical fibre
The strength of the grating reflectivity is a function of the induced index change, the grating length, and the chirp band-