運用錨定理論於創新服務特色之心理偏好分析 - 政大學術集成
159
0
0
全文
(2) Anchor-based Psychological Preference Analysis for Attractive Features of New Services 運用錨定理論於創新服務特色之心理偏好分析. by. Wei-Chen Lu. A Dissertation Submitted in Total Fulfillment of. 政 治 大. the Requirement for the Degree of. Master of Science. 學. in. Management information Systems. Nat. sit. y. ‧. ‧ 國. 立. n. al. er. io. Supervisor: Soe-Tysr Yuan, Professor, MIS, NCCU. Ch. engchi. i n U. v. Department of Management Information Systems. NATIONAL CHENGCHI UNIVERSITY. July 2014. © Wei-Chen Lu 2014.
(3) 致謝 光陰似箭,在政大資管碩士班的兩年很快地就過去了,回想這兩年間我 學到了很多知識與人生道理,也接受了許多貴人們的幫忙。首先,要感謝我 的指導教授苑守慈老師,不管是在學術上、生活上或是未來的路上,她一直 像是一盞明燈指引著我,給我許多建議。在研究上,苑老師是一位良師,擁 有著深不見底卻又廣闊的知識,要求嚴謹但又有著開明的思想,督促我要在 兼顧高品質的同時也要尋找各種不同的可能性。在生活中,又像是一位前輩 與益友,用她經過人生歷練後的智慧,告訴我人生沒有絕對,要抱持著自己. 政 治 大. 的夢想勇敢往前進,並且不斷地吸收新知。再來,也要謝謝宋同正老師與林. 立. 宛瑩老師,在口試時給予我肯定以及許多寶貴的建議。. ‧ 國. 學. 謝謝一同奮鬥兩年的 BMIND 好夥伴席筠與韻平,從一同討論、一起開 會到分享心事跟一起出去玩,認識你們是很幸運的一件事,希望未來我們也. ‧. 能保持聯絡一同讓自己的人生大放光彩。感謝 SSRC LAB 所有學長姐、學弟. y. Nat. sit. 妹以及博士後研究員們,和你們一同在實驗室歡笑、聊天與認真的日子真的. n. al. er. io. 非常地開心。謝謝 101 級的好同學們,我不會忘記一同為報告與考試奮鬥的. i n U. v. 日子。也要謝謝兩年間常常陪我聊天給我打氣的怡芳,遇見妳和認識妳讓我. Ch. engchi. 的人生很不一樣,希望妳未來工作與人生一切順利。以往 KM LAB 的好朋友 與學長姐維文、承翰、勁超學長、雅菱學姊、祖韵等等,感謝一路上有你們 的歡笑作陪伴,希望我們感情不會散,作一輩子的好友。 最後,要感謝我的家人。謝謝爸爸與媽媽你們總是無怨無悔地為我付出, 讓我不愁吃穿,隨時回家就能體會到溫暖,這是我一輩子也還不起的。謝謝 老弟,每每和你一起聊天打屁總是能讓我放輕鬆做我自己。 要謝的人太多了,如果還有漏掉沒提到的人們,就讓我以謝天代替吧! 威辰 民國一○三年七月十九日 於台北.
(4) 摘要 在這個商業環境快速變遷以及服務產業竄起的時代,服務創新已然成為 所有企業關心的核心議題。然而,現今仍未有清楚地定義使一個服務邁向成 功的關鍵因素。在本研究中,我們發現了兩個使得大眾不接受新服務的關鍵 問題:第一個是潛在使用者低估了或是沒有察覺到自身對於新服務的需求; 第二個是潛在使用者認為服務的內容無法滿足其需求。所以,本研究試著找 到具有吸引力的服務特色讓潛在使用者被這些特色吸引而願意給予新服務機 會。我們運用錨定理論創建了一心理偏好分析的系統框架以提供一個有效的 方式來促進新服務創新。. 立. 政 治 大. ‧ 國. 學. 關鍵詞:新服務、服務創新、錨點、偏好、具吸引力的特色. ‧. n. er. io. sit. y. Nat. al. Ch. engchi. i n U. v.
(5) Abstract. Facing the fast-changing trend of the business environment and the rising service sectors, service innovation has become the core issue for all the enterprises. However, the key factors for making new services successful are still not so clear. We have observed two problems existing in new services that prevent them from being accepted by the public: potential users are underestimated or unconscious of the need of a new service and the features of the new service can’t fulfill the users’. 政 治 大. needs. Therefore, the anchor-based psychological preference analysis proposed in. 立. this study tries to discover the attractive features of new services for making. ‧ 國. 學. potential users to give them chances. Based on the anchoring effect of mental information – expectation and cognitive bias, we devise an IT artifact that can. ‧. provide an effective way to facilitate the promotion of new service innovation.. io. sit. y. Nat. n. al. er. Keywords: New services, Service innovation, Anchor, Preference, Attractive Features. Ch. engchi. I. i n U. v.
(6) Table of Contents CHAPTER 1 INTRODUCTION ............................................................................................................... 1 1.1 BACKGROUND AND MOTIVATION............................................................................................................ 1 1.2 RESEARCH PROBLEM............................................................................................................................ 2 1.3 RESEARCH METHOD ............................................................................................................................ 5 1.4 PURPOSE AND CONTRIBUTION ............................................................................................................... 9 1.5 CONTENT ORGANIZATION ................................................................................................................... 10 CHAPTER 2 LITERATURE REVIEW ...................................................................................................... 12 2.1 BEHAVIOR CHANGE ........................................................................................................................... 13. 政 治 大. 2.2 MOTIVATIONS FOR PROMOTION AND PREVENTION .................................................................................. 16 2.3 REFERENCE POINT ............................................................................................................................. 18. 立. 2.4 ANCHORING EFFECT .......................................................................................................................... 19. ‧ 國. 學. 2.4.1 Anchoring Effect ................................................................................................................... 19 2.4.2 Selective Accessibility Model ................................................................................................ 21 2.4.3 Provided Anchors & Self-generated anchors ........................................................................ 22. ‧. 2.4.4 Summarization ..................................................................................................................... 23. y. Nat. CHAPTER 3 BMIND PROJECT ............................................................................................................ 25. sit. 3.1 THE CONCEPTUAL FRAMEWORK OF BMIND .......................................................................................... 25. al. er. io. 3.1.1 Preference Analysis .............................................................................................................. 26. v. n. 3.1.2 Appropriate Expectation Positioning .................................................................................... 27. Ch. i n U. 3.1.3 Visualization-based Behavior Intention Reframing .............................................................. 28. engchi. 3.2 THE SYSTEM ARCHITECTURE OF BMIND ............................................................................................... 29 3.2.1 Mental State Model Building Module .................................................................................. 29 3.2.2 Appropriate Mental State Recommendation Module .......................................................... 30 3.2.3 Behavior Intention Reframing Module ................................................................................. 31 3.3 APPLICATION SCENARIO – I-PART ......................................................................................................... 34 CHAPTER 4 THE ANCHORING-BASED PREFERENCE ANALYSIS MECHANISM ...................................... 37 4.1 CONCEPTUAL FRAMEWORK ................................................................................................................. 37 4.2 DESIGN LOGIC AND RESEARCH APPROACH ............................................................................................... 42 4.3 ATTRIBUTE GENERATOR OF SERVICE INSIGHT MODULE AND NEW SERVICE DATABASE ........................................ 44 4.4 ANCHOR-BASED Q&A MODULE ........................................................................................................... 47 4.5 ADJUSTMENT INDEX-BASED ANALYSIS MODULE........................................................................................ 50 4.5.1 Adjustment Index ................................................................................................................. 51 4.5.2 The Standards for Evaluating Adjustment Index .................................................................. 55 II.
(7) CHAPTER 5 APPLICATION SCENARIO ................................................................................................ 57 5.1 AN APPLICATION SCENARIO ................................................................................................................ 57 CHAPTER 6 EVALUATION .................................................................................................................. 66 6.1 PROPOSITION ................................................................................................................................... 66 6.2 ASSUMPTIONS .................................................................................................................................. 67 6.3 EXPERIMENT 1 ................................................................................................................................. 68 6.3.1 Design and Objective of Experiment 1 ................................................................................. 68 6.3.2 Subjects of Experiment 1 ...................................................................................................... 74 6.3.3 Result of Experiment 1’s Data .............................................................................................. 78 6.3.4 Findings and Discussion of Experiment 1 ............................................................................. 90 6.4 EXPERIMENT 2 ................................................................................................................................. 92 6.4.1 Design and Objective of Experiment 2 ................................................................................. 92. 政 治 大. 6.4.2 Subjects of Experiment 2 ...................................................................................................... 97. 立. 6.4.3 Result of Experiment 2 ....................................................................................................... 100 6.4.4 Findings and Discussion of Experiment 2 ........................................................................... 124. ‧ 國. 學. 6.5 INTERVIEW OF SERVICE PROVIDERS ..................................................................................................... 131 6.6 FINDING AND DISCUSSION OF BMIND RESEARCH PROJECT ..................................................................... 135. ‧. CHAPTER 7 CONCLUSION ............................................................................................................... 138 7.1 CONTRIBUTIONS ............................................................................................................................. 138. y. Nat. sit. 7.2 MANAGERIAL IMPLICATIONS.............................................................................................................. 139. io. er. 7.3 LIMITATIONS AND FUTURE WORKS ..................................................................................................... 141. al. REFERENCES ...................................................................................................................................... A. n. v i n C hFOR REDUCED DRINKING APPENDIX A. 12-ITEM VERSION OF URICA PROJECT ................................... F engchi U. III.
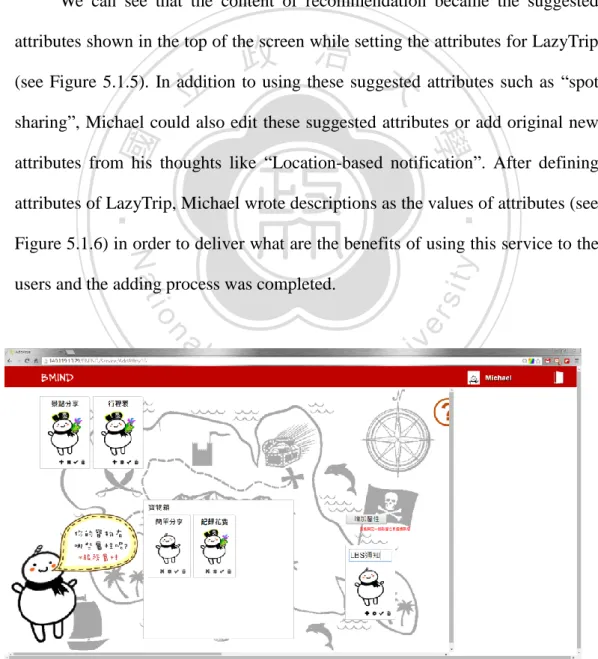
(8) List of Figures FIGURE 1.1 HEVNER’S DESIGN SCIENCE RESEARCH FRAMEWORK (HEVNER, 2004) ........................... 10 FIGURE 2.1 THE FIVE STAGES OF THE TRANS-THEORETICAL MODEL ................................................. 14 FIGURE 2.2 PROMOTION CONCERNS, PREVENTION CONCERNS WITH MOTIVATIONS TO POSITIVE END-STATES AND NEGATIVE END-STATES (MOLDEN, 2008) ............................................................... 16 FIGURE 2.4.2 THE SELECTIVE ACCESSIBILITY MECHANISM (MUSSWEILER, 2007) .............................. 22 FIGURE 3.1 BMIND CONCEPTUAL FRAMEWORK ............................................................................... 26 FIGURE 3.2 DESIGN LOGIC FLOW IN BMIND SERVICE ........................................................................ 33. 政 治 大. FIGURE 4.1 CONCEPTUAL FRAMEWORK DIAGRAM .......................................................................... 38. 立. FIGURE 4.2 SYSTEM ARCHITECTURE DIAGRAM................................................................................. 42 FIGURE 4.3 DATA FLOW DIAGRAM OF GENERATING ATTRIBUTES FROM SERVICE INSIGHT ............... 45. ‧ 國. 學. FIGURE 4.4.1 DATA FLOW DIAGRAM OF ANCHOR-BASED Q&A MODULE ......................................... 48 FIGURE 4.4.2 THE EXAMPLE OF RESPONSE TABLE............................................................................. 49. ‧. FIGURE 4.5.1 THE ILLUSTRATION OF THE VARIABLES OF A RESPONSE TABLE .................................... 52. Nat. sit. y. FIGURE 4.5.2 THE ILLUSTRATION OF THE VARIABLES OF A SERVICE .................................................. 53. er. io. FIGURE 4.5.3 PSEUDO CODE OF COMPUTING ADJUSTMENT INDEX-BASED VARIABLES .................... 54. al. v i n C hCLUSTERING ................................................................... FIGURE 4.5.5 PSEUDO CODE OF K-MEANS 56 engchi U n. FIGURE 4.5.4 CLASSIFICATION STANDARDS OF ADJUSTMENT INDEXES ............................................ 56. FIGURE 5.1.1 THE SERVICE JOURNEY OF SERVICE PROVIDERS AND USER ......................................... 58 FIGURE 5.1.2 REGISTRATION PAGE ON BMIND PLATFORM ............................................................... 59 FIGURE 5.1.3 DOMAIN SETTING PAGE ON BMIND PLATFORM .......................................................... 59 FIGURE 5.1.4 NAMING THE NEW SERVICE ........................................................................................ 60 FIGURE 5.1.4 INPUTTING THE INSIGHT OF THE NEW SERVICE .......................................................... 60 FIGURE 5.1.5 DEFINING THE ATTRIBUTES WITH THE SUGGESTION FROM THE ATTRIBUTE GENERATOR OF SERVICE INSIGHT MODULE.......................................................................................................... 61 FIGURE 5.1.6 INPUTTING THE INSIGHT OF THE NEW SERVICE .......................................................... 62 FIGURE 5.1.7 CATEGORIES OF THE NEW SERVICE ON BMIND PLATFORM ......................................... 62. IV.
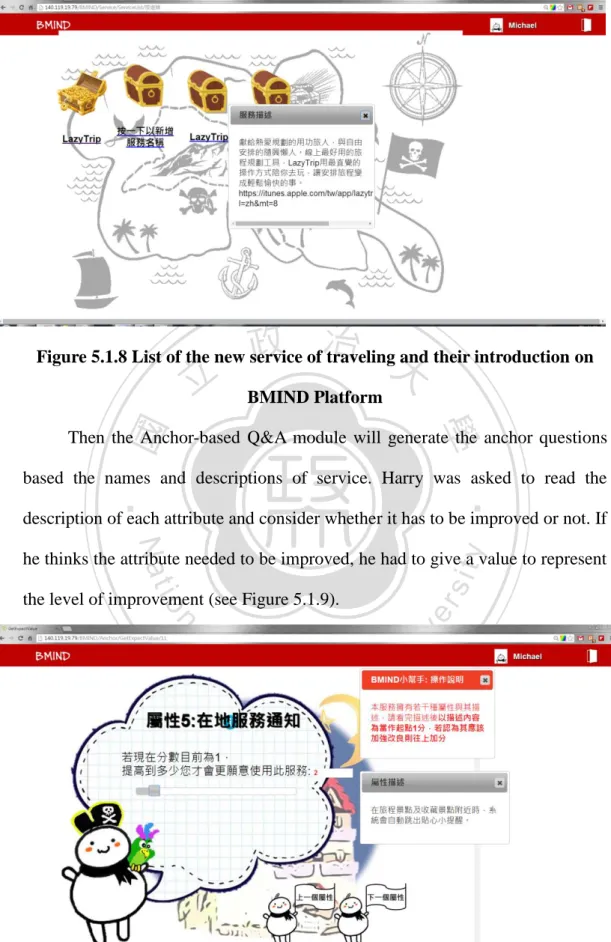
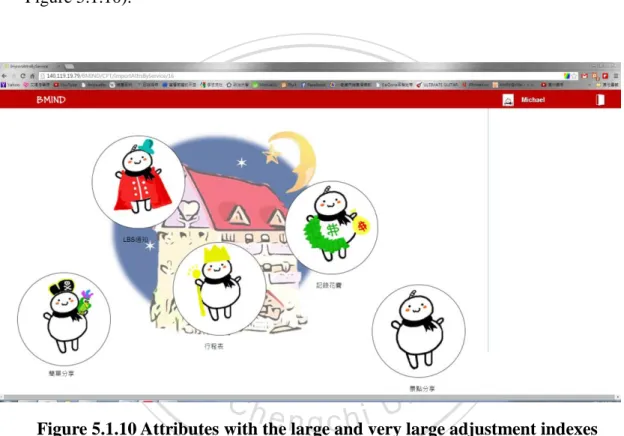
(9) FIGURE 5.1.8 LIST OF THE NEW SERVICE OF TRAVELING AND THEIR INTRODUCTION ON BMIND PLATFORM ....................................................................................................................................... 63 FIGURE 5.1.9 ANCHOR QUESTIONS OF LAZYTRIP.............................................................................. 63 FIGURE 5.1.10 ATTRIBUTES WITH THE LARGE AND VERY LARGE ADJUSTMENT INDEXES .................. 64 FIGURE 5.1.11 THE REPORT FOR LAZYTRIP ....................................................................................... 65 FIGURE 6.3.1 SCATTER PLOT OF ADJUSTMENT INDEX ....................................................................... 80 FIGURE 6.3.2 SCATTER PLOT OF ATTRIBUTE CATEGORY'S ADJUSTMENT INDEX ................................ 81 FIGURE 6.3.3 ATTRIBUTE’S MEAN OF ADJUSTMENT INDEX .............................................................. 81 FIGURE 6.3.4 ATTRIBUTE CATEGORY’S MEAN OF ADJUSTMENT INDEX ............................................. 82 FIGURE 6.3.5 HYPOTHESIS OF THE TESTING FOR ATTRIBUTE CATEGORY 3 ........................................ 83. 政 治 大. FIGURE 6.3.6 HYPOTHESIS OF THE TESTING FOR THE PREFERENCE ................................................... 88. 立. FIGURE 6.4.1 THE PROCEDURE OF EXPERIMENT 2 ............................................................................ 92. ‧ 國. 學. FIGURE 6.4.2 PIE CHART OF THE PERCENTAGE................................................................................ 104 FIGURE 6.4.3 HYPOTHESIS OF THE TESTING FOR AWARENESS OF THE POTENTIAL BENEFITS .......... 104. ‧. FIGURE 6.4.4 HYPOTHESIS OF THE TESTING FOR AWARENESS OF THE POTENTIAL BENEFITS .......... 108 FIGURE 6.4.5 HYPOTHESIS FOR DIFFERENCE BETWEEN THE INCREMENT OF USERS AND SERVICE. y. Nat. sit. PROVIDERS .................................................................................................................................... 109. er. io. FIGURE 6.4.6 HYPOTHESIS FOR DIFFERENCE BETWEEN THE MOTIVATION OF USERS AND SERVICE. al. PROVIDERS .................................................................................................................................... 114. n. v i n C hUSERS AND SERVICE PROVIDERS FIGURE 6.4.8 DIFFERENCE BETWEEN THE .................................... 118 engchi U FIGURE 6.4.9 DIFFERENCE BETWEEN BUSINESS-RELATED AND ENGINEERING-RELATED ................. 119 FIGURE 6.4.10 DIFFERENCE BETWEEN FEMALE AND MALE ............................................................. 120 FIGURE 6.4.11 DIFFERENCE BETWEEN BEFORE ANCHORING AND AFTER ANCHORING ................... 123 FIGURE 6.4.12 DIFFERENCE BETWEEN DIFFERENT BEHAVIOR CHANGE STAGES .............................. 124 FIGURE 6.4.13 PERCENTAGE OF OPINIONS ABOUT AWARENESS OF POTENTIAL BENEFITS FROM THE VIEW OF GENDER ........................................................................................................................... 129 FIGURE 6.6.1 SUBSCALE RESULTS OF FOUR PHASES URICA OF BMIND PROJECT ............................. 137 FIGURE 7.2.1 STRATEGY DIRECTION OF SERVICE ATTRIBUTES ......................................................... 141. V.
(10) List of Tables TABLE 4.1 THE DEFINITIONS OF CONCEPTS ....................................................................................... 39 TABLE 4.3.1 THE TERMINOLOGIES IN ATTRIBUTE GENERATOR OF SERVICE INSIGHT MODULE .......... 45 TABLE 4.3.2 NEWS SITE WE USE IN THE STUDY ................................................................................. 46 TABLE 4.3.3 THE COMPOSITION OF A NEW SERVICE ......................................................................... 47 TABLE 4.4 THE TERMINOLOGIES IN ATTRIBUTE GENERATOR OF SERVICE INSIGHT MODULE ............. 48 TABLE 6.3.1 THE ATTRIBUTES OF E-SHOPPING SERVICE .................................................................... 70 TABLE 6.3.2 THE ATTRIBUTES OF ONLINE MUSIC SERVICE ................................................................ 71. 政 治 大. TABLE 6.3.3 THE QUESTION LIST OF E-SHOPPING SERVICE ............................................................... 72. 立. TABLE 6.3.4 THE QUESTION LIST OF ONLINE MUSIC SERVICE ............................................................ 73. ‧ 國. 學. TABLE 6.3.5 THE SUBJECTS’ PERSONAL DATA .................................................................................... 74 TABLE 6.3.6 LIST OF THE TEST TARGETS ............................................................................................ 82. ‧. TABLE 6.3.7 THE RESULT OF LEVENE'S TEST FOR HOMOGENEITY OF VARIANCES .............................. 83 TABLE 6.3.8 THE RESULT OF WELCH ANOVA FOR ATTRIBUTE CATEGORY 3 ........................................ 84. y. Nat. FOR ATTRIBUTE CATEGORY 3 WITHOUT “EASE OF USE. er. io. TABLE 6.3.10 THE RESULT OF WELCH ANOVA. sit. TABLE 6.3.9 THE RESULT OF POST-HOC TEST, GAMES-HOWELL FOR ATTRIBUTE CATEGORY 3 ........... 85. al. v i n COFhSERVICE ATTRIBUTESU...................................................... 88 TABLE 6.3.11 CODING OF PREFERENCE engchi n. OF WEB UI (E-SHOPPING)” ............................................................................................................... 87. TABLE 6.3.12 THE RESULT OF LEVENE'S TEST FOR HOMOGENEITY OF VARIANCES ............................ 88 TABLE 6.3.13 THE RESULT OF WELCH ANOVA FOR PREFERENCE LEVELS ............................................ 89 TABLE 6.3.14 THE SPEARMAN'S RANK CORRELATION COEFFICIENT FOR PREFERENCE LEVELS AND ADJUSTMENT INDEX ........................................................................................................................ 90 TABLE 6.4.1 THE DETAILS OF LAZYTRIP’S SETTING ............................................................................ 93 TABLE 6.4.2 9-ITEM VERSION OF URICA FOR WILLINGNESS TO TRY THE SERVICE ............................. 95 TABLE 6.4.3 THE SUBJECTS’ PERSONAL DATA .................................................................................... 98 TABLE 6.4.4 THE DATA OF THE OPINIONS FROM SUBJECTS ............................................................. 102 TABLE 6.4.6 ONE-SAMPLE T TEST FOR AWARENESS OF THE POTENTIAL BENEFITS .......................... 105 TABLE 6.4.7 READINESS TO CHANGE SCORE ................................................................................... 106 VI.
(11) TABLE 6.4.8 ONE-SAMPLE T TEST FOR INCREMENT OF WILLINGNESS TO TRY THE SERVICE............. 108 TABLE 6.4.9 DESCRIPTIVE STATISTICS FOR USERS AND SERVICE PROVIDERS ................................... 108 TABLE 6.4.10 INDEPENDENT-SAMPLES T TEST FOR DIFFERENCE BETWEEN THE INCREMENT OF USERS AND SERVICE PROVIDERS ............................................................................................................... 109 TABLE 6.4.11 DATA OF THRESHOLD OF SERVICE’S VALUE FOR THE SERVICE ATTRIBUTES ................ 111 TABLE 6.4.12 DESCRIPTIVE STATISTICS FOR PREVENTION AND PROMOTION CONCERNED ............. 113 TABLE 6.4.13 SPEARMAN'S RANK CORRELATION COEFFICIENT FOR MOTIVATION TOWARD POSITIVE END-STATE AND INCREMENT OF READINESS TO CHANGE SCORE ................................................... 113 TABLE 6.4.14 DESCRIPTIVE STATISTICS FOR MOTIVATION OF USERS AND SERVICE PROVIDERS....... 114 TABLE 6.4.15 INDEPENDENT-SAMPLES T TEST FOR DIFFERENCE BETWEEN THE MOTIVATION OF. 政 治 大. USERS AND SERVICE PROVIDERS .................................................................................................... 115 TABLE 6.4.16 DATA OF ADJUSTMENT INDEX FOR THE SERVICE ATTRIBUTES ................................... 116. 立. TABLE 6.4.17 SPEARMAN'S RANK CORRELATION COEFFICIENT FOR MOTIVATION TOWARD POSITIVE. ‧ 國. 學. END-STATE AND ADJUSTMENT INDEX ............................................................................................ 117 TABLE 6.4.18 BEHAVIOR CHANGE STAGE OF SUBJECTS ................................................................... 122. ‧. TABLE 6.5.1 THE PERSONAL DATA OF THE SERVICE PROVIDERS ...................................................... 132. n. al. er. io. sit. y. Nat. TABLE 6.5.2 THE CONTENT OF THE INTERVIEWS OF SERVICE PROVIDERS ....................................... 133. Ch. engchi. VII. i n U. v.
(12) CHAPTER 1 INTRODUCTION. 1.1 Background and Motivation. Service industries comprise roughly 75 percent of the gross domestic product of developed nations (Larson, 2008). More and more businesses nowadays more focus on service-dominant strategies than goods-dominant strategies. Even the goods businesses more likely view themselves as service-oriented businesses with the goods being an important part of their services. Businesses increasingly. 政 治 大 dimensions of economic 立activity in every industry (Rubalcaba et al., 2012).. provide a mix of services and goods as products, and services are relevant. ‧ 國. 學. Therefore, we can say that there are new services being created every moment. However, only a few new services are accepted by the users and becoming a part. ‧. of the users’ life, the failures of them are eliminated through competition and the. sit. y. Nat. development of these services likely entail some waste of resources such as time. n. al. er. io. or money (Rubalcaba et al., 2012). As a result, service innovation managers need. i n U. v. to sell the innovation projects internally in their organization (Rubalcaba et al.,. Ch. engchi. 2012). To help these managers, we try to provide a solution that can measure the effect of a service and determine whether innovations are likely to succeed or not. This effort also should acknowledge measures such as customer involvement (Rubalcaba et al., 2012). However, new services can be classified into six categories: major innovation, start-up business, new services for the market presently served, service line extensions, service improvements and style changes (Menor et al., 2002). The definition of major innovation is that the new services for markets are undefined and it is usually driven by information and computer-based 1.
(13) technologies. Start-up business means that new services in a market that is already served by existing services. New services for the market presently served is that new service offerings to existing customers of an organization. These three kinds of new services are called radical innovations, which are defined as “highly new” innovations. Service line extension means augmentations of the existing service line like adding new menu items. Service improvements are changes in features of services that currently are being offered. Style changes are modest forms of visible changes that have an impact on customer perceptions,. 政 治 大 fundamentally, only its appearance. These three kinds of new services are called 立 emotions, and attitudes, with style changes that do not change the service. incremental innovations, which are defined as “not so new” innovations. In this. ‧ 國. 學. study, we focus on the major innovation, start-up business and new services for. ‧. the market presently served because they have high potentials of success but the. sit. y. Nat. probability for them to become a successful service in the real world is unknown.. io. er. We want to predict the probability and analyze the reason to create a chance that can help these new services adjusting themselves to the best condition and. al. n. v i n becoming widely accepted C by the customers. In the h e n g c h i U later chapters and sections, when we mention new service, it means the radical innovations. 1.2 Research Problem. From the above discussion, we can say the core problem is what causes the customers decide to or not to take a new service. We argue there are two reasons that may make a new service be failed.. 2.
(14) (a) The features of the new service can’t fulfill the users’ needs One possible reason is that the new service doesn’t fit the users’ needs. Normally a new service is built from improving the defects of the current service to reach a better quality. The major innovation and start-up business service innovation include some brand-new features or functions. From the point of view of Kano theory (Kano et al., 1984), which is a theory of product development that classifies customer preferences into five categories: attractive, one-dimensional, must-be, indifferent and reverse, these brand-new features or functions should. 政 治 大 satisfaction. Also, these service innovations should remain the must-be quality to 立 have attractive qualities that are surprised or delightful to increase the customer. avoid the decrease of customer satisfaction. However, the businesses sometimes. ‧ 國. 學. focus on the wrong features of the current service and view them as the main. ‧. defects. After making a lot of efforts to advance the performance of these. sit. y. Nat. features, they propose a new service. Nevertheless, regardless of the higher. io. problem is not solved.. er. quality of these features, the total benefit is not increased because the real. al. n. v i n C hreleased WindowsU8 and claimed it will bring a For example, Microsoft engchi. new and huge change of using tablets and personal computers. They brought up. the concept called “All-in-ones” and it means using the same operating system in tablets and personal computers so pc users can use pc in an easy way like using tablets. However, old personal computers don’t have touchscreen, the new functions and convenience provided by Windows 8 suddenly become redundant and inconvenient. If users want to enjoy these new features, they need to pay extra money and effort, but they doubt that it is worthy and most of the users decide to use old operating systems. This example demonstrates that Microsoft did provide some brand-new features such as combining the user interface of 3.
(15) tablet and personal computer. However, these features are not seemingly attractive, and they might be one-dimensional attributes because most of the users still have to purchase touchscreens. The change of user interface might also sacrifice some must-be attributes such like a clear button to turn off the computer. To target which kind of people would think the features of the new service can’t fulfill their needs, we need to know the ways people think. People are motivated to fulfill a variety of basic needs for their living within both physical. 政 治 大 al., 2008) have frequently differentiated those concerned with advancement from 立 and social environments. In view of such needs, previous researches (Molden et. those concerned with security. Some people focus on prevention concerns related. ‧ 國. 學. to the presence and absence of losses and the others focus on promotion. ‧. concerns related to the presence and absence of gains (Crowe et al., 1997;. sit. y. Nat. Brockner et al., 2001, 2004; Molden et al., 2008). What the people focus on. io. er. prevention concerns pursue for good-end state is to strive toward the absence of negative outcomes, or we can call it non-gains, such as avoiding salary reduction. al. n. v i n or avoiding being blamed. C So when considering U h e n g c h i the alternatives, their decision. making strategies are narrowing in on what seems most certain and secure and. their thresholds for accepting potentially beneficial options are higher (Molden et al., 2008). For example, when there is a chance to earn salary increase with paying fees and time to get the chance, the prevention-focused people may set a higher amount of salary increase as his threshold the take the chance than the promotion-focused people do. As a result, people with prevention concerns may more likely maintain the status quo and reject to change for accepting new things like using new products or services than the others. In our research, we argue that the prevention-focused 4.
(16) people may usually think the value of the service doesn’t fulfill their needs because of the chronic high threshold of accepting new things. (b) Unconscious of the need of a new service Several previous researches (Crowe et al., 1997) showed that, compared to those with chronic or induced prevention concerns, those with chronic or induced promotion concerns are able to solve more insight problems, generate a higher quantity and quality of innovative uses for common, daily objects. The promotion focus inclination is to avoid errors of omission, whereas the. 政 治 大 commission (Crowe et al., 1997; Levine et al., 2000). For example, there are two 立. prevention focus inclination is to insure correct rejections and avoid errors of. students in an upper-level college course and they both are highly motivated to. ‧ 國. 學. earn an “A”. One of them focuses on promotion concerns and views this as an. ‧. opportunity to improve his class rank. The other one focuses on prevention. sit. y. Nat. concerns and views this as a necessity for protecting his good standing in the. io. er. pre-medical program.. As a result, people with promotion concerns usually set a low threshold to. al. n. v i n accept new things; in other C words, it is easy to make h e n g c h i U them accept a new service.. So, we argue that if they don’t take a new service, they may be unconscious of the need of it. Once the awareness of the service is raised, they may change their decision to accept the new service.. 1.3 Research Method. The transtheoretical model (TTM) of Behavior Change is one of the most popular theories used to describe how people modify their own behaviors. The TTM is a model of intentional change that focuses on the decision-making 5.
(17) abilities of the individual rather than the social and biological influences on behavior as other approaches tried (Velicer et al., 1998). The problems of taking new services are similar to the problems in the first stage, of behavior change which is called precontemplation stage, proposed in the transtheoretical model. There are five stages in the TTM model. The first stage is precontemplation stage. Individuals at this stage do not have intention to change their behavior. They may be unconscious or uninformed of the need to change or they may have failed to change many times and give up changing. People who. 政 治 大 or modifying a problem. decide not to accept a new service are in this stage. People at this stage are opposed to acknowledging. 立. behavior. They often. overestimate the cons of changing, underestimate the pros, and are unaware of. ‧ 國. 學. making such mistakes (Prochaska et al, 1983), just like part of the people who do. ‧. not taking new services often set a high threshold to change. If we can raise their. sit. y. Nat. awareness of the need of changing and make them reevaluate the impersonal. io. er. environment factors, their willingness to changing may be increased and they may move to next stage, contemplation. This movement is a significant part and. n. al. i n also the starting point for theCentire process of changing. hengchi U. v. In this study, we argue using reference point and anchoring effect can help. us more understand the thoughts when considering behavior change, or more specifically, using a new service. The reference point is the criterion we use in judgment and it’s similar to the threshold we set in our mind. Human judgment is often influenced by salient norms and standards (Mussweiler et al., 1999; Mussweiler, 2002). Anchoring effect, the assimilation of a numeric estimate, is one of the previously considered standard (Mussweiler, 2002). It reliably influences judgments in a variety of domains, like general knowledge, probability estimates, legal judgment, pricing decisions, and negotiation. 6.
(18) The selective accessibility model proposes that anchoring effects are affected by a selective increase in the accessibility of anchor-consistent knowledge about the target (Mussweiler, 2002). This model mentioned that when receiving an external stimulus such as a comparative question, the information about the target will be activated and easily extracted. It also assumes people will unconsciously make a hypothesis that these activated information are related to the actual target value and then measure the probability of this hypothesis with the consideration of the applicability and. 政 治 大 negotiation process of buying a new house, the sales person may provide a first 立. representativeness of the information (Strack, et al., 1997). For example, in the. price and we don’t know whether this price is reasonable or not without the. ‧ 國. 學. relative domain knowledge. But we still have to give a counter offer, so we may. ‧. retrieve the price of the similar house that friends bought or appeared in the. sit. y. Nat. television ads and use it as the starting points of the adjustment. So, when. io. er. answering a comparative anchoring question, judges are engaged in an active hypothesis-testing process in which they consider the possibility that the actual. al. n. v i n target value may be similar C to the anchor (Mussweiler, h e n g c h i U 2002). Moreover, we can. say the result of anchor effect is based on anchor-consistent knowledge which is highly related to the past experience, received information and preferences. As a result, we assume that the result of anchor effect can partly represent the attitude of the target, which is the anchor point. Previous research has found that in a negotiation process, while an anchor. point affects the counter offers negotiators make, a reference point determines how an offer is perceived (Kristensen et al., 1997). The concept of reference point was first introduced in prospect theory (Kahneman et al., 1979; Tversky et al., 1991; Tversky et al., 1992). It’s a criterion that we use to judge whether an 7.
(19) event makes us feel gain or loss. The most common reference point is the present situation or the expected result. For example, when participating in a competition, an individual may expect himself to be at least getting the third prize. If he finally gets the third prize, he may think that is exactly what he should get and feel nothing. If he get the second prize or win the championship, he may think that he has done a better work than usual and feel gains. If he gets the fourth prize or lower in the end, he may think that he has not expressed the best performance and feel loss. Shortly saying, a result which is better than. 政 治 大 point makes us fell loss. Moreover, we can say reference point represents the 立 reference point makes us feel gains; and a result which is worse than reference. attitude when considering a situation. In a negotiation process, if provided. ‧ 國. 學. information, which is an anchor point, is perceived as gain by the reference point,. ‧. the adjustment from the anchor point to the final estimation is smaller; if. sit. y. Nat. provided information, which is an anchor point, is perceived as loss by the. io. er. reference point, the adjustment from the anchor point to the final estimation is bigger (Kristensen et al., 1997).. al. n. v i n C hpoint is the reservation We assume the reference value of the service of the engchi U. user, which is also the user’s minimum expected service quality. Since the. interaction between anchor point and reference point exists, if we divide a service into many attributes that can be judged by reference point and anchor point, we can use the result of anchoring effect and reference point to analyze how they make decisions depending on these attributes.. We can further know. which attributes are attractive, one-dimensional, must-be, reverse or indifferent and provide suggestions that which attributes are supposed to be remained, adjusted or removed. 8.
(20) 1.4 Purpose and Contribution. Following the mentioned possible reasons, the research purpose we proposed is to find out how to use the process and the result of anchoring effect to increase the awareness of the present service, represent people’s attitude of their ideal new service and the present service and discover the gaps between them. Through these gaps, we could categorize the reasons why users not taking new services into the two possible categories which are mentioned before, users are unconscious of the need of a new service and the features of the new service. 政 治 大. can’t fulfill the users’ needs. Therefore, the service-oriented businesses could. 立. know what the problems of their service are and choose an effective way to fix. ‧ 國. 學. these gaps.. For example, businesses may establish a marketing strategy which is. ‧. focusing on the people with unconsciousness of the need of a new service and. y. Nat. io. sit. increasing the awareness of the need. And they may pay attention to decrease the. n. al. er. threshold of using a new service by making the changing process less painful or. i n U. v. reducing the cost. They may also focus on the appropriate features which users. Ch. care about and promote them.. engchi. The expected contribution of our research is that we propose an original way to use negotiation processes to increase the awareness of the service to make them more understand the potential benefits and further become more willing to try the new service. Also, the result of the processes can help us to infer the reason why an individual didn’t give the chance to a new service is “the features of the new service can’t fulfill the users’ needs” or “unconscious of the need of a new service”. Business can use these data to precisely develop a new service that can promote the quality of life instead of trying and getting errors 9.
(21) repeatedly. They can save more resources and time to create another great service.. 1.5 Content Organization. The content of the research is divided into four main sections and followed by the design science research framework (Hevner et al., 2004)(See figure 1.1)., which aims to define the environment of research problem, to apply the foundations and methodologies in knowledge base, to build the IT artifacts to. 政 治 大. solve the relevant problem and relate them in relevance and rigor.. 立. ‧. ‧ 國. 學. n. er. io. sit. y. Nat. al. Ch. engchi. i n U. v. Figure 1.1 Hevner’s Design Science Research Framework (Hevner, 2004). In Chapter 1, we elaborate the current environment to provide an overall view of our research background, motivations and define the research problem and purposes.. 10.
(22) In Chapter 2, which is the literature review section, we deeply discuss and try to find the theoretical support (e.g. focus theory, prospect theory, anchoring effect and selective accessibility model) that can help us define the specific objectives that are extended from Chapter 1 and build the knowledge base. This research is a part of the Behavior Modification from Insightful Design project. Thus, in Chapter 3, we will introduce the project and the position of this research in the project. In Chapter 4, we build a conceptual framework from the review and. 政 治 大 possible solution that can be realized. A reference point and anchoring effect 立. finding in the Chapter 2 and try to use information technology to develop a. based system will be introduced in details.. ‧ 國. 學. In Chapter 5, we build an application scenario with screenshots of the. ‧. information system to present amply service flow and provide the advantages of. sit. y. Nat. the methodology.. io. er. In Chapter 6, propositions are built to witness to research questions in chapter 1. We design two experiments to collect the data for the evaluation of the. n. al. propositions.. Ch. engchi. i n U. v. In Chapter 7, the conclusion, research contribution, research limitation and future works are mentioned. The excess discovery turns into knowledge base in design science research.. 11.
(23) CHAPTER 2 LITERATURE REVIEW. In this chapter, we discuss the foundations and methodologies as the background knowledge of our research. The review of the behavior change, motivation for promotion and prevention, reference point, anchoring effect and the dual processing systems are elaborated in order to found the theoretical basis as the required rigor to sustain the research. (1) Behavior change: Changing from not using a service to using it is one kind of the behavior change. We think that understanding the process of behavior. 政 治 大. change can help us identify the reasons of why the user does not want to. 立. change and discover the opportunities to increase the willingness to use the. ‧ 國. 學. service.. (2) Motivation for promotion and prevention: Motivations for promotion and. ‧. prevention have influences on the decision making process such as deciding. y. Nat. io. sit. to use a new service. Understanding them may help us to identify the. n. al. er. factors that affect the behavior change process more specifically.. i n U. v. (3) Reference point: Reference point plays an important role in the decision. Ch. engchi. making process since it is the criterion that we use to judge whether an event makes us feel gain or loss which leads the decision we make. If we can find ways to position a user’s reference point of the new service, we can know whether the new service is a loss to the user and we can adjust the service to make it become a gain. (4) Anchoring effect: Anchoring effect is a common cognitive bias that affects the answer of a question with provided information as anchors. To use a new service or not is kind of a question and the contents of the service are the provided information from the service provider. We try to relate them 12.
(24) and discover the opportunities to understand the user’s thinking by use these biases.. 2.1 Behavior Change. Behavior change is composed of many disciplines, including mainstream psychology, and the associated sub-disciplines of health, leisure, amusement, and physical activity (Gintis, 2007). The Trans-theoretical Model is a theoretical model of behavior change which has been the basis for developing effective. 政 治 大. interventions to promote health behavior change (Velicer, et al., 1998). There are. 立. five stages conceptually defined in this model (Mcconnaughy, et al., 1983, see. ‧ 國. 學. Figure 2.1):. (1) Pre-Contemplation: In this stage, the person needs to do behavior change but. ‧. does not think s/he has a problem behavior or realizes s/he does not want to. y. Nat. io. sit. change; may feel pressured by others to be there; may grant having a. n. al. er. problem, but has no desire to change. S/he is either not aware of or is ignoring the problem behavior.. Ch. engchi. i n U. v. (2) Contemplation: The person is starting to be conscious that a problem exists or that s/he is bothered by something about him/herself. S/he is struggling to understand the problem (i.e., cause, solution) and seeking more information; but has not decided to change. (3) Preparation(Decision making): The person has decided s/he is ready to change; has committed him/herself that s/he can do it; is willing to pay the price (i.e., money, time, effort, discomfort); but has not begun to change the problem behavior.. 13.
(25) (4) Action: The person has actively begun to change the behavior; is struggling during the process of change; has not been very successful on his/her own and needs help. S/he has not reached the desired change. (5) Maintenance: The person has succeeded in changing the behavior but is either slipping or coming in to prevent a relapse. S/he might have found it difficult to maintain the changes (i.e., new behaviors, new attitudes) on his/her own, and is therefore seeking help. S/he has already reached the desired change and is better off than s/he was in the beginning.. 立. 政 治 大. ‧. ‧ 國. 學. n. er. io. sit. y. Nat. al. Ch. engchi. i n U. v. Figure 2.1 The Five Stages of the Trans-theoretical Model. These five stages of change were formulated as a fundamental part of a transtheoretical therapy model which has been developed as an integrative model of change for the fragmented field of psychotherapy (Prochaska, et al., 1983). The stage of behavior change is a standard process model for people. It helps people to detect what the problem they have and design how to change their 14.
(26) behavior. The maintenance stage is not just final stage in the process. It gives feedback to encourage other people to change their improper behavior. Behavior change is a continuous process that inspires people to have well-being behaviors. Although it is widely accepted and used in changing the problem behavior into health behavior, we think it has analogies between changing behavior and using a new service. The reasons why people don’t take the new service may be similar to the people with a problem behavior in the pre-contemplation stage. They may not think or know that using the new service may increase the quality. 政 治 大 lacking the desire to do the change. 立. of life; they may admit that using the new service may bring them benefits, but. The stages of change describe the aspect of when shifts in attitudes,. ‧ 國. 學. intentions, and behaviors happen. The processes of change enable us to. ‧. understand how shifts in behavior occur (Patten et al., 2000; Prochaska et al.,. sit. y. Nat. 1992; Rodgers et al., 2001). One of the process that makes the individual move. io. er. from pre-contemplation to contemplation is the awareness raising, a process in which the individual needs to increase his or her awareness about the causes, the. al. n. v i n negative consequences, andCthe cures of the problem h e n g c h i U behavior (Patten et al., 2000; Prochaska et al., 1992; Prochaska & Velicer, 1997; Velicer et al., 1998). Many new services that have potential to become radical innovations are failed because they are not noticed or understood by the users. In this study, we think that there are attractive features that can make the users to actively notice the. new service. We want to find these attractive features to raise the awareness of the need of using new services so they can move to next stage, contemplation.. 15.
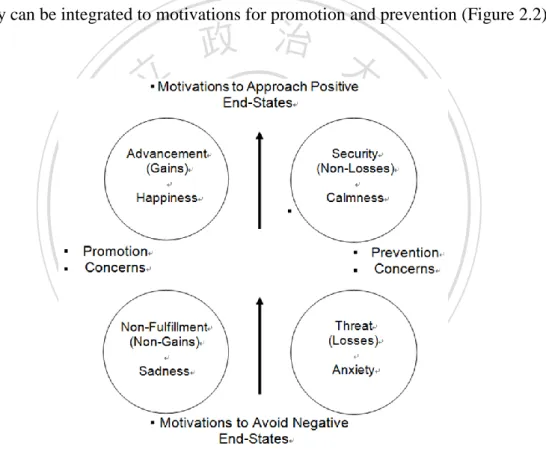
(27) 2.2 Motivations for Promotion and Prevention. The study of Psychology has been intimately associated with the study of motivation and many previous researches have shown the importance of understanding people’s motives, needs, desires, and goals for explaining their thoughts and actions (Triplett, 1898; Freud, 1905; Murray, 1938; Lewin, 1935; Bruner et al., 1947; Molden et al., 2008). These needs or goals are usually concerned with growth and advancement versus safety and security. Further, they can be integrated to motivations for promotion and prevention (Figure 2.2).. 立. 政 治 大. ‧. ‧ 國. 學. n. er. io. sit. y. Nat. al. Ch. engchi. i n U. v. Figure 2.2 Promotion concerns, prevention concerns with motivations to positive end-states and negative end-states (Molden, 2008). People who are concerned about promotion focus on gains and strive forward the presence of positive outcomes (Molden et al., 2008); concern with advancement, growth, and accomplishment (Crowe et al., 1997; Brockner et al., 2001, 2004). According to regulatory focus theory (Crowe et al., 1997), when 16.
(28) people are promotion-focused, the growth and advancement needs drive them to attempt to lead themselves to alignment with their ideal selves and feel presence of positive outcomes, thereby emphasizing the potential gains to be obtained. People who are concerned about promotion focus on losses and strive forward the absence of negative outcomes (Molden et al., 2008); concerned with security, safety, and responsibility (Crowe et al., 1997; Brockner et al., 2001, 2004). When prevention-focused, people’s security and safety needs make them to try to lead themselves to alignment with their ought selves and feel absence of. 政 治 大 People with promotion focus should generate many hypotheses because 立. negative outcomes, thereby emphasizing the potential losses to be avoided.. they are concerned with ensuring hits and less concerned with errors of. ‧ 國. 學. commission (Liberman et al., 2000). Their strategies of considering the. ‧. alternatives are open to many possibilities, increasing the probabilities of. sit. y. Nat. identifying correct hypotheses and avoiding the omission of any information that. io. er. might be important. They set lower thresholds for accepting potentially relevant information (Molden et al., 2008).. al. n. v i n C hfocus should generate People with prevention fewer hypotheses because engchi U. they are concerned with ensuring correct rejections and ensuring against errors of commission (Liberman et al., 2000). Their strategies of considering the alternatives are narrowing in on what seems most certain and increasing the probabilities of rejecting incorrect hypotheses and avoiding commitment to alternatives that are mistaken. They set higher thresholds for accepting potentially relevant information (Molden et al., 2008). Promotion. and. prevention. concerns. are. connected. to. unique. representations and experiences, and situations that evoke such representations or experiences can activate these concerns (Molden et al., 2008). It indicates that 17.
(29) people are not always promotion concerned or prevention concerned and we can activate the particular concerns to make people temporarily promotion concerned or prevention concerned through the relative information or environments. The discussion in this section shows that motivations for promotion and prevention affect the human behavior in many ways. The promotion concerns and the prevention concerns lead the people behavior, decision making and goal pursuing in a totally different way. Especially when facing a decision with uncertain results, promotion-concerned people are more willing to give a chance. 政 治 大 more attention to avoid losses by focusing on any possible threats. Taking a new 立 to pursue the better outcomes while prevention-concerned people are paying. service is one kind of this situation, people with promotion concerns may be. ‧ 國. 學. more willing to try than those with prevention concerns. To eliminate the gap. ‧. between motivations for promotion and prevention and raise the opportunities. sit. y. Nat. for new services, we should find a way and try to control the users’ motivations. io. n. al. er. and make them being temporarily promotion-concerned in our research.. 2.3 Reference Point. Ch. engchi. i n U. v. Reference point was proposed in prospect theory (Kahneman et al., 1979; Tversky et al., 1991; Tversky et al., 1992). People normally regard outcomes as gains and losses, rather than as the expected utility of wealth such as income or expenditure (Kahneman et al., 1979). People treat outcomes with emotion more than with price. Gains and losses are recognized relative to the reference point, the neutral point that we feel nothing. People set a reference point when they are going to make a decision and it helps them judge the outcomes of alternatives and leads to the final decision. The reference point usually corresponds to the 18.
(30) current situation or the expected result. “The location of the reference point and the consequent coding of outcomes as gains or losses can be affected by the expectations of the decision maker (Kahneman et al., 1979).” It can also be affected by the past experiences or the similar situations. Moreover, we can say reference point represents the attitude when considering a situation. When an individual is going to consider using a new service, s/he sets a reference point to judge that s/he will feel gains or losses if s/he uses the new service. It is the threshold of taking a new service or not. So the reference point. 政 治 大 because it is the criteria that makes the user think it is indifferent to him/her 立. of the service can be used to represent the attitudes or thoughts of service. whether using the service or not. This can be the guide that how the service. ‧ 國. 學. providers should improve their services.. ‧. For our research, we argue that reference point can be used to distinguish. sit. y. Nat. motivation for promotion and prevention since reference point is the threshold of. io. prevention-concerned people have a higher threshold.. n. al. 2.4 Anchoring Effect. Ch. engchi. er. accepting things and promotion-concerned people have a lower threshold and. i n U. v. 2.4.1 Anchoring Effect. Anchoring effect is a cognitive bias that describes that people are usually affected by during decision making process (Kahneman et al., 1974). Mussweiler (2002) said anchoring effect is the assimilation of a numeric estimate to a previously considered standard. Anchoring effect occurs when individuals use an initial piece of information to make subsequent judgments. Once the first piece 19.
(31) of information provided is set as an anchor, judgments will be made by adjusting away from the anchor. And there is a bias toward interpreting other information around the anchor. For example, when we are going to buy a used car, the initial price offered to us becomes the standard for the rest of the negotiations, so that prices lower than the initial price seem more reasonable even if they are still higher than what the car is really worth. Anchoring effect occurs in our daily life. Kahneman and Taversky (1974) claimed that anchoring effect occurs. 政 治 大 initial anchor a great influence over future judgments. Chapman and Johnson 立 because of the adjustments from the anchor are usually insufficient, giving the. (2002) explained that the insufficient adjustments are caused by the lacking of. ‧ 國. 學. cognitive effort.. ‧. Kahneman and Taversky (1974) implied that anchoring effects depend on. sit. y. Nat. the degree of uncertainty about the judgment. Supporting this notion, some. io. er. related researches suggest that the size of the anchoring effect increases with uncertainty (Jacowitz et al., 1995). Jacowitz and Kahneman used some. al. n. v i n demonstrateCthat the more uncertain h e n g c h i U judges. experiments to. were about the. judgment, the more were numeric estimates assimilated to the provided anchor values. For example, when a subject who lives in Asia is asked about the length of Mississippi River with a random number of 1700, s/he may use 1700 as an anchor and give the estimation close to the 1700. But a subject who lives in Minnesota may give a more accurate estimation than the former subject because s/he lives nearby Mississippi River and knows more about the river. However, the research of Strack (1992) has mentioned that although the cognitive bias caused by the anchoring effect exists most of the time, sometimes people can still conquer the bias and make a more accurate estimation. 20.
(32) Sometimes, people may not use the first provided information as an anchor or they may correct the information. Anchoring effect happens in many of domains, like general knowledge, probability estimates, legal judgment, pricing decisions, and negotiation. We believe that it can be applied to understand the reasons behind people’s decision making process.. 2.4.2 Selective Accessibility Model. 政 治 大. However, Mussweiler (2002) gave a different explanation for anchoring effects. 立. and demonstrated that judgmental anchoring effects are semantic in nature. He. ‧ 國. 學. said anchoring effect occurs because the semantic knowledge about the target is activated during the comparison with the anchor. In order to generate the final. ‧. estimate, people judge primarily rely on easily accessible knowledge so that their. y. Nat. io. sit. estimate is influenced by the anchor-consistent knowledge that was generated. n. al. er. before. For example, when we are going to buy a house but we are not sure the. i n U. v. offered price is reasonable, the knowledge we have such as the price of the other. Ch. engchi. houses in the neighborhood or the houses that have the similar specifications will be activated as the basis of the comparison. This leads to an assimilation of the final estimation to the anchor value. The selective accessibility model has two parts (see Figure 2.2): hypothesis-consistent testing (the selectivity hypothesis) and semantic priming (the. accessibility. hypothesis). (Mussweiler. et. al.,. 1999).. The. hypothesis-consistent testing is about after receiving an anchor value and a target object, the individual will test the hypothesis by examining the possibility that the target object’s value along the judgmental dimension is equal to the anchor 21.
(33) value, which Mussweiler called “standard” (Mussweiler et al., 1999; Mussweiler , 2002; Mussweiler , 2007). For the second part, semantic priming, if the consequence of test is equal, then it will increase the accessibility of standard-consistent knowledge and lead to an assimilation of the final estimation to the anchor value. If the consequence of test is unequal, then it will increases the accessibility of standard-inconsistent knowledge and lead to a contrast of the final estimation to the anchor value.. 立. 政 治 大. ‧. ‧ 國. 學. n. er. io. sit. y. Nat. al. i n U. v. Figure 2.4.2 The Selective Accessibility Mechanism (Mussweiler, 2007). Ch. engchi. The selective accessibility model points out that during the anchoring process, the anchor-related knowledge will be extracted and used to give the estimated value. We argue that can be used to urge people to judge the value of a specific target.. 2.4.3 Provided Anchors & Self-generated anchors. Previous researches (Epley et al., 2001, 2004, 2005, 2006) mentioned that anchors can be categorized into external provided anchors or self-generated 22.
(34) anchors. When facing a decision making situation, people do not always have external information as provided anchors. But anchors still be generated by their past experience or similar situations they had, these anchors called the self-generated anchors. The self-generated anchors may activate more anchor-consistent knowledge when anchoring effect occurs than the provided anchors because people usually have strong belief in what they know. In the house buying example mentioned in the section 2.4.2, the offered price is the provided anchor and the knowledge we have such as the price of the other. 政 治 大 the self-generated anchor. We usually use the knowledge we have as the basis to 立. houses in the neighborhood or the houses that have the similar specifications is. start the negotiation because we prefer to rely on our information and the. ‧ 國. 學. experience we know, which are the self-generated anchors. And we argue that. ‧. these self-generated anchors represent the attitude and thoughts toward a specific. sit. n. al. er. io. 2.4.4 Summarization. y. Nat. target and these might affect the value of reference point.. Ch. engchi. i n U. v. In this section, we have known that anchoring effect often occurs in our daily life. Any information came into our mind first when we are going to make decision can be an anchor. The more uncertain the problem, the bigger size of anchoring effect. Anchoring effect activates the anchor-consistent knowledge. It seems that anchoring effect has a great power that keep the estimate close to the anchor during the decision making process. The effective ways to eliminate this kind of bias has not been proposed right now. According to the subsection 2.4.1, the size of the anchoring effect increases with uncertainty. Conversely, we can infer that. 23.
(35) the size of the anchoring effect decreases with certainty. So, there is a chance that we may think conversely to use the bias to retrieve some information. The subsection 2.4.1 mentioned that there are still some situations that anchor does not have an obvious influence on the final estimate. We may explain the situations that anchor effect has only a small influence on the final estimate are caused by that the individual is certain about the target of estimation s/he made or the individual has his/her particular thoughts of the problem. If so, maybe we can use the size of anchoring effect to estimate whether an individual. 政 治 大 features for the users. For example, if an internet service company provides a 立 is interesting in or insisting in something and it can help us to find the attractive. solution with downloading speed 50Mb/s and uploading speed 50 Mb/s. We can. ‧ 國. 學. consider the network speed as the provided anchors. A customer might said if the. ‧. solution has a downloading speed 1000 Mb/s and uploading speed 100 Mb/s,. sit. y. Nat. s/he would consider using it. We can see that the adjustment of downloading. io. er. speed is bigger than the uploading speed, which means the size of anchoring effect of downloading speed is relatively smaller and s/he is more interested in. n. al. downloading speed.. Ch. engchi. 24. i n U. v.
(36) CHAPTER 3 BMIND PROJECT. The purpose of this chapter is to describe an overview of our whole research project – “BMIND”. More specifically, this research is one of its underlying components. BMIND means Behavior Modification for Insightful Design. The objective of the BMIND research project aims at helping people achieve behavior intention change that can help result in transformative service innovation (i.e., the industrial or societal changes, moving beyond design being simply creating new values or improving existing values for narrowly targeted. 政 治 大. customers). Behavior intention change is about engaging customers to think. 立. about modifying their existing behaviors into ones that would enable and sustain. ‧ 國. 學. the new value capture on the part of customers. This project will develop a generic intentional behavior change framework featuring a set of methods and. ‧. models to facilitate intentional behavior change towards transformative service. io. sit. y. Nat. innovation.. n. al. er. The first section describes the conceptual framework of BMIND research. i n U. v. project. Next, an introduction of the system architecture is provided. In the third. Ch. engchi. section, we use an example to illustrate how the system works.. 3.1 The Conceptual Framework of BMIND. The conceptual framework of BMIND research project consists of three procedures based on the five stages of behavior change from the Trans-theoretical Model as shown in Figure 3.1. Each procedure has its own mission based on the methodologies of specific domains in order to help the people in the five stages to move on. 25.
(37) Procedures of BMIND. Preference Analysis. Appropriate Expectation Positioning. Visualization-based Behavior Intension Reframing. Methodologies of Academic Domains. Psychology. Communication. Behavior Economics. Stages of Behavior Change. Pre-contemplation. 政 治 大. Contemplation. 立. Preparation. Action. Maintenance. Figure 3.1 BMIND Conceptual Framework. ‧ 國. 學 ‧. 3.1.1 Preference Analysis. y. Nat. io. sit. According to the Trans-theoretical Model, people who are not considering a. n. al. er. change are in the pre-contemplation stage. Moving out the pre-contemplation. i n U. v. stage is the entry point of the whole behavior change process. From the point of. Ch. engchi. view of using a new service, the people in the pre-contemplation stage may yield to their current state and have no intention to use a new service. They are under-informed about the benefits they will have if they use the new service. So, in order to build a generic intentional behavior change framework to help people change their behavior, understanding the reason why these people still stay in the pre-contemplation stage is significant. The objective of this procedure aims to collect the data that can describe the current status of the people in the first stage. First of all, we need to understand their current mental states and build mental state models to illustrate 26.
(38) the hypothetical state or process that correlates to feeling and thinking, consisting of a group of mental representations and propositional attitudes; so we can find the factors that affect the decision making process of using a new service. To achieve this goal, we decide to develop a preference analysis module of the new services based on the psychological methodologies and try to use the result to build a mental state model for each user. The mental state model, which represents the preference for a specific target like a service attribute, is considered as the original reference point to represent the current status quo in. 政 治 大 thoughts in the precontemplation stage and help the users raise their awareness 立. BMIND project. After building the models, we can analyze them to know their. of the need to change and move to the next stage of change.. ‧ 國. 學 ‧. 3.1.2 Appropriate Expectation Positioning. y. Nat. io. sit. In order to move into the contemplation stage, raising their awareness of. n. al. er. changing and make them aware of the need is important. After people getting. i n U. v. into the contemplation stage, they start to evaluate the utility of changing by. Ch. engchi. seeking more information. They would not move out this stage unless they can guarantee the pros of the behavior change are bigger than the cons. Therefore, the most important mission in stage of contemplation is the evaluation of changing. From the point of view of using a new service, the people in the contemplation stage keep estimating the utility of the new service unless they make sure the benefits are more than the costs of using new service. So, it is vital to improve the efficiency of evaluation and help people to position the appropriate expectation of the new services.. 27.
(39) The objective of this procedure aims to help people solve the problem of inappropriate expectation of the new services. We provide a computing model based on the domain of behavior economics for user to estimate the utility of the new service form the point of view of the appropriate expectation. These appropriate expectations are considered as the new reference points in BMIND project to help the people reframe their thoughts of the new service. It shows the utility from their current expectation and helps the users re-evaluate the pros and cons of new service more efficiently and accurately. If the result demonstrates. 政 治 大 recommendation that can make them evaluate the utility of new service in an 立. that their current expectation of the new services is inappropriate and we have a. appropriate way, then they can move from pre-contemplation stage to the. 3.1.3 Visualization-based Behavior Intention Reframing. Nat. io. sit. y. ‧. ‧ 國. 學. contemplation stage, and then the preparation stage.. n. al. er. When people move into the preparation stage, they would collect information. i n U. v. including the social suggestions, personal mental reflection (original reference. Ch. engchi. points from preference analysis procedure), and their current state which concerns about the pros and cons of a new service (new reference points from appropriate expectation positioning procedure). From the beginning to the action stage, it is a spiral process can revise their changing plan until they are fulfilled. Thus, people would change their cognition that may affect their performance of observable behavior. People would receive an expected position from Appropriate Expectation Positioning where they can hold and feel more satisfied. The expectation value pushes people to the action stage; they hope that they can stay on the best position. In it is an abstract concept on implementing a cognition 28.
(40) change; however, we apply the model of frame effect (Scheufele, 1999) to deduce how to reframe the cognition step by step and enhance the concrete. This procedure focuses on acting that people reframe their cognition behavior in practice. In order to transform the cognition behavior, we need to interact with people to gather up the required data and provide our analysis data to them. The fundamental methodologies of this procedure are from the communication field. Communicating is ubiquitous in daily life and influences people to develop their cognition and attitude that are formed the personal. 政 治 大 involved in different stage of behavior change to reinforce the possibility of 立. behavior. There are some communication theories to sustain our study and get. cognition behavior change.. ‧ 國. 學 ‧. 3.2 The System Architecture of BMIND. y. Nat. io. sit. This research presents a systematic mechanism to develop a service system to. n. al. er. people and support the intentional behavior change. There are several processes. i n U. v. in system architecture as shown in Figure 3.2. There are three modules that. Ch. engchi. handle the processes: Mental State Model Building module, Appropriate Mental State Recommendation module, and Behavior Intention Reframing Module.. 3.2.1 Mental State Model Building Module. The purpose of this module is to build mental state models that can represent the feeling, thinking or other emotional and cognitive stuff for every user.. 29.
(41) . New Service Description and Attributes: Service providers have to input the services and the attributes as the fundamental data we use to interact with the users.. . Collecting User Preference Level of the Attribute: To build the mental state model, we decide to use the preference of the attributes of the services as the fundamental material. We use the preference, the surface features of the cognition and emotion, to represent the mental state of the user. This process aims to interact with the user to collect the data, the user’s. 政 治 大 Building a Mental State Model of current expectation: This process uses the 立 preference level of the attributes of the services.. . user’s preference level of the attributes of the services to rebuild a complete. ‧ 國. 學. mental state model for every user. This model shows the current overall. io. sit. y. Nat. services.. ‧. thoughts of the service of users, including the current expectations of the. n. al. er. 3.2.2 Appropriate Mental State Recommendation Module. Ch. engchi. i n U. v. The purpose of this module is to find out the more appropriate expectations of new services for users. We compute the utility of new service for user who has new expectation and guarantee the new expectation is the more appropriate one. In order to understand the psychological states (psychological value, probability weight) of user to compute utility, system would interact with user several rounds to gain user’s perception. . Generating Value Function: The purpose of this process is getting the user’s psychological value about the major features of new service.. 30.
(42) . Generating Decision Weight Function: The purpose of this process is to understand the probability weight (attitude of probability) of the user during evaluating the new service.. . Building an Appropriate Mental State (suggested expectation): This process applies the above user’s psychological states (psychological value, probability weight) to build the more appropriate expectations and to compute the expected utility of changing to use the new service.. 治 政 3.2.3 Behavior Intention Reframing Module 大 立 ‧ 國. 學. This module would analyze the data received from the previous modules and then enter into the calculated section so that people can obtain a processed data. ‧. via correspondence analysis technique (Greenacre, 1984). There are two. y. Nat. io. sit. processes in this module. First is graph making module, it offers a graphic data. n. al. er. to easily understand; second, it would interact with the graph when people. i n U. v. operate on the graph and get recommendations to reframe. When people. Ch. engchi. complete the reframing procedure, they would move into the maintenance stage which means they successfully change the cognition. We give more information about two modules respectively as follows. . Making Correspondence Analysis Graph: The purpose of this module is to create a visualized graph that people can increase impression, attraction and interaction. At the beginning, it builds a contingency table filled in the data received from the previous procedure (Greenacre, 1984). Correspondence map implies more information represented by dots and uses the distances. 31.
數據

+7

相關文件
• To introduce the use of the LPF as a tool for planning the school English Language curriculum; and
Understanding and inferring information, ideas, feelings and opinions in a range of texts with some degree of complexity, using and integrating a small range of reading
Writing texts to convey information, ideas, personal experiences and opinions on familiar topics with elaboration. Writing texts to convey information, ideas, personal
Now, nearly all of the current flows through wire S since it has a much lower resistance than the light bulb. The light bulb does not glow because the current flowing through it
Writing texts to convey simple information, ideas, personal experiences and opinions on familiar topics with some elaboration. Writing texts to convey information, ideas,
volume suppressed mass: (TeV) 2 /M P ∼ 10 −4 eV → mm range can be experimentally tested for any number of extra dimensions - Light U(1) gauge bosons: no derivative couplings. =>
We explicitly saw the dimensional reason for the occurrence of the magnetic catalysis on the basis of the scaling argument. However, the precise form of gap depends
• Formation of massive primordial stars as origin of objects in the early universe. • Supernova explosions might be visible to the most
This kind of algorithm has also been a powerful tool for solving many other optimization problems, including symmetric cone complementarity problems [15, 16, 20–22], symmetric
