國 立 交 通 大 學
電機與控制工程學系
碩 士 論 文
利用可變編碼比對人形辨識系統
實現於
DSP 平台
Human Recognition System
Using Deformable Codebook Matching and
Realization on DSP Platform
研 究 生:李亞書
指導教授:林進燈 教授
中華民國 九十六 年 七 月
利用可變編碼比對人形辨識系統實現於
DSP 平台
Human Recognition System Using Deformable Codebook
Matching and Realization on DSP Platform
研 究 生:李亞書 Student:YA-SHU LEE
指導教授:林進燈 教授
Advisor:Dr. Chin-Teng Lin
國立交通大學
電機與控制工程學系
碩士論文
A Thesis
Submitted to Department of Electrical and Control Engineering
College of Engineering and Computer Science
National Chiao Tung University
in Partial Fulfillment of the Requirements
for the Degree of Master
in
Electrical and Control Engineering
June 2007
Hsinchu, Taiwan, Republic of China
利用可變編碼比對人形辨識系統
實現於
DSP 平台
學生:李亞書
指導教授:林進燈 教授
國立交通大學電機與控制工程研究所
Chinese Abstract中文摘要
本論文提出了一組快速而且計算量低的即時人形辨識偵測系統,其用途為在 影像監視系統中提供人與非人物體之判別,並且可用在提供紅外線夜視攝影的攝 影機上。本系統包含前景取得(Foreground),人形辨識(Human Detection),軌跡判 別(Trajectory Tracking)等。由於本系統以建立在非支援浮點運算之 DSP 平台上為 前提來進行研究,即時處理(Real-Time)的要求極為嚴苛,計算量以及精準度成為 了本論文的第一要求。系統的第一部分在於取出特定場景中的移動前景,在這裡 我們使用背景相減法(Background Subtraction)來做為取出移動物體的基礎。為了 可以適合各種情況及不同的取像設備,我們使用了一個簡單快速的背景相減二值 化闕值(Threshold)設定。第二部分提出了一些簡單的軌跡與狀態判別模式,在之 後的人形辨識部分上提供一些必要資訊,以及降低誤判(False-Alarm),誤判情況 偵測等等的處理。而系統的第三部分,人形辨識的判斷法,基於在運算量的要求 下,我們在許多的判斷方法之中選擇的以外形樣版為基礎的Codebook 判斷方法 來實現分辨人形與其他物體的不同。而為了解決室內常有的場景內人物下半身被 遮蔽現象,我們提出了Deformable Codebook Matching 的方法,可以提供半身以 下不同比例的人形辨識機制,以完成雖有部分遮蔽仍有其辨識效果的系統。更進 一步的延伸其用法到並排重疊的多人辨識機制。Human Recognition System
Using Deformable Codebook Matching and
Realization on DSP Platform
Student: Ya-Shu Lee
Advisor: Prof. Chin-Teng Lin
Department of Electrical and Control Engineering
National Chiao Tung University
English Abstract
Abstract
In this thesis, a fast real-time human detection system with low computing power is proposed. The purpose of this system is to provide the human detection and tracking for video surveillance which can be used in the environment with infrared rays lighting. This system consists foreground segmentation, human tracking, and human detection. The system will be implemented on the real-time DSP system which is not supporting the floating-point computation. The requirement of low computing power and accuracy becomes the major condition that we are very concerned. The first part of our human detection system is to segment the moving object from the scenes. We use the background subtraction here to segment the moving blob. We provide a simple and fast function to calculate the binarization threshold for the varying environments and videos taken by different cameras. In second part of our system, we use simple trajectory tracking and condition judgment to provide some data for human detection algorithm and to decrease the false-alarm rate. The final part is human detection. Because of the requirement of low computing power, we choose the shape-based method by codebook to classify human being from the other objects. The people walking indoor are sometimes covered by furniture such as desks or chairs. To solve this kind of problem, we provide deformable codebook matching, a human detection algorithm for first half body with different height/width ratio. With deformable codebook matching, when someone’s bottom half body is covered, the system can still work. Further, we use deformable codebook matching to implement the human detection for multiple people walking side by side.
Chinese Acknowledgements
致 謝
首先,在這兩年之中最為感謝的當然是我們的指導教授 林進燈教授, 這段時間以來給予我的幫助與指導,讓我學習到許多寶貴的知識與經驗, 在學業及研究方法上也受益良多。而傅立成,郭耀煌等口試委員們在口試 時的建議與指教,使得本論文得以更加完備,在此深感致謝。 其次,要不是超視覺實驗室的學長鶴章、剛維及得正,博班學長子貴、 建霆、肇廷、Linda 等眾位學長姐的從旁協助,本論文的許多環節將無法 緊緊相扣,許多實驗也無法順利進行,實在是非常感激。而同學育弘、立 倬、及訓緯的相互砥礪,以及IC LAB 的靜瑩,智文及德瑋的友情相挺, 更是讓我在研究所這條路上不會孤單不會寂寞。當然也不會忘記諸位學長 姐、學弟妹們在研究過程中所給我的鼓勵與協助,交接人采蓉及晟輝的負 責與認真。最後更是要感謝鶴章學長及剛維學長,在理論及程式技巧上給 予我相當多的幫助與建議,讓我獲益良多。 最後感謝我的父母親對我的教育與栽培,並給予我精神及物質上的一 切支援,使我能安心地致力於學業。 謹以本論文獻給我的家人及所有關心我的師長與朋友們。Contents
Chinese Abstract ...ii
English Abstract ... iii
Contents ...v
List of Tables...vii
List of Figures... viii
Chapter 1 Introduction...1 1.1 Motivation...2 1.2 Related Work...3 1.3 Thesis Organization ...6 1.4 System Architecture...7 1.4.1 Software Architecture ...7 1.4.2 Hardware Introduction...9
Chapter 2 Moving Object Extraction ... 11
2.1 Background Construction and Dynamic Background Update...11
2.2 Adaptive Foreground Extraction...14
2.2.1 Optimal Threshold Finding Function...14
2.2.2 Noise Elimination Filter...17
2.2.3 Connect Components Labeling...20
2.3 Moving Object Tracking...21
Chapter 3 Human and Non-Human Detection ...24
3.1 Codebook Classification ...25
3.2 Training Algorithm ...28
3.2.1 Pre-classify (K-Means) ...29
3.2.2 Training Algorithm ...30
3.3 Deformable Codebook Matching...32
3.3.1 Full Body Matching ...34
3.3.2 First Half Body Matching ...35
3.3.3 Multiple Occlusive Human Detection ...38
Chapter 4 Experimental Result ...42
4.1 Simulation Result of Optimize Threshold Finding Algorithm ...42
4.2 Simulation Noise Elimination Filter ...46
4.3.1 Human and Non-Human Detection ...49
4.3.2 First Half-Body ...53
4.3.3 Object Tracking Table...55
4.3.4 Multiple Occlusive Human Detection ...56
4.4 Testing Environment...57
4.5 Accuracy of DCBM algorithm...58
4.6 Discussion...62
Chapter 5 Conclusion ...64
List of Tables
Table 1 : The items of object tracking table...22
Table 2 : H/W ratio selecting table...34
Table 3 : Half body matching table...37
Table 4 : The accuracy of our system. ...58
Table 5: The statistic of the accuracy (Video with only full body human)...61
Table 6: The statistic of the accuracy (Video with lots half body human)...61
List of Figures
Figure 1-1 : System architecture...7
Figure 1-2 : Human detection system. ...8
Figure 1-3 : Blackfin A-V EZ-Extender...9
Figure 1-4 : System overview. ...10
Figure 2-1 : Example of ITU-656 data format...12
Figure 2-2 : Arrangement of ITU-656 Format...12
Figure 2-3 : The flow chart of background model...14
Figure 2-4 : The flow chart of moving object extraction...15
Figure 2-5 : 4-connected and 8-connected sets...18
Figure 2-6 : Dilation diagram. ...19
Figure 2-7 : Erosion diagram. ...19
Figure 2-8 : Example of connected components labeling...20
Figure 2-9 : Object tracking table update process. ...22
Figure 3-1 : The flow chart of human detection. ...24
Figure 3-2 : The procedure of the comparison with the codebook. ...26
Figure 3-3 : Feature word extraction: shape information. ...27
Figure 3-4 : Feature word extraction: histogram of projection information...28
Figure 3-5 : Indoor video. ...32
Figure 3-6 : Outdoor video. ...32
Figure 3-7 : The flow chart of deformable codebook matching. ...33
Figure 3-8 : Threshold finding result. ...35
Figure 3-9 : Comparison with full and half body...36
Figure 3-10 : Two persons walk side by side...38
Figure 3-11 : Flow chart of multiple-occlusive human detection...39
Figure 3-12 : Projection histogram of Figure 3-10 ...39
Figure 3-13 : Projection histogram checking and separating...40
Figure 3-14 : Histogram analysis of a tree waved shadow. ...41
Figure 3-15 : Result of multiple-occlusive human detection...41
Figure 3-16 : Histogram analysis of three occlusive human...41
Figure 4-1 : The plot of threshold adjustment. ...43
Figure 4-2 : Example of utilization of the threshold adjustment function...44
Figure 4-3 : Scene of Figure4-4...44
Figure 4-4 : Example of utilizing three kinds of threshold...45
Figure 4-5 : Examples of noise elimination filter. ...46
Figure 4-6 : Other examples of noise elimination filter...47
Figure 4-8 : Snap shot of the output of our system on PC...49
Figure 4-9 : Results of normal indoor environment...49
Figure 4-10 : Result of normal outdoor environment. ...50
Figure 4-11 : Results of non-human object shown in the outdoor environment...51
Figure 4-12 : Results of non-human object shown in the indoor environment. ...51
Figure 4-13 : Results of complex human detection. ...52
Figure 4-14 : Results of multiple human detection...52
Figure 4-15 : Moving objects with human and non-human objects. ...52
Figure 4-16 : Results of complex human detection. ...53
Figure 4-17 : Results with only half-body (indoor)...53
Figure 4-18 : Results with only half-body (outdoor) ...54
Figure 4-19 : Result of object tracking table. ...55
Figure 4-20 : Results of multiple-occlusive man detection. ...56
Figure 4-21 : List of testing environment. ...57
Figure 4-22 : Example of system fail #1...63
Figure 4-23 : Example of system fail. #2...63
1
Chapter 1
Introduction
In recent years, visual surveillance systems play an important role in security. We can easily find visual surveillance systems everywhere, not only in the street and open store but also in many houses and companies. There are two common types of video surveillance system: one is to record video from video surveillance system without human monitoring. It is already prevalent in commercial establishment with camera output being recorded periodically or stored in video archives. The other is sending video to the monitors with continuously human monitoring.
The disadvantage of the given surveillance system is that it will take lots of storage equipments, and even waste money and resource, if we only record the video from surveillance TV camera as data. For example because of the limitation of storage space in the video surveillance system, the data can not be reserved for a long time. If there was something happened and we can’t get the related video information in time, it will be difficult to recover the interesting extract from mass video data. In the building or some close environment, the video sequences from many remote areas can be presented to watchmen at a time. However, looking at many TV monitors for a long time is hard work for watchmen. Research shows that normal adults can only focus on the monitor less than fifty minutes. Further more, it is expansive to find available human resources to sit and watch the video. Therefore the automatic detection of moving objects and the classification of the detected objects are required in video surveillance system. In particular, distinguishing human from other objects is an indispensable function for security systems.
The advanced video surveillance system needs to analyze the behaviors of people in order to prevent the occurrence of the potential dangerous case. The analysis of behaviors of people requires the human detection and tracking system. In recent years, the developments of human detection and tracking system have been going forwards for several years, and many real time systems have been developed. However, there are still some challenging technologies need more researches: most of systems need heavy computing load because of foreground extraction and classify algorithm. If a video surveillance system can provide occlusion people detection or shadow handle algorithm, it always comes to the problem of heavy computing load. There have been some real-time video surveillance systems, but most of them are developed on personal computer platform with fast modern CPU. It cost too much when every input video needs a personal computer to analysis, if we have much of area need to be monitored by many cameras.
1.1 Motivation
In recent years, visual surveillance systems play an important role in security. A problematic issue is to distinguish people from other moving objects such as animals or traffic. Although many researches have been studied on this problem, it is still a leading issue in visual surveillance systems.
Human detection is one major issue of object detection. Its main idea is to find whether there are human in the video (or image) or not. A successful human detection can tell us how many people are there in the one single image. This kind of human detection system scans whole image to find out if there is any human feature. There are several systems which can do this kind of job and provide a good search result. The question is this kind of human detection system takes very long time to calculate
and search. It is not suitable for real time human detection.
Real-time human detection systems are always separated into two parts: finding the moving object in the video sequence and then analyzing the moving object. When a moving object get into the range of interesting, we need to locate its position and size, and even, its speed and direction. We call this process foreground extraction or foreground segmentation. It is difficult to extract the moving object from background perfectly. Foreground extraction can be affected by light, shadow, camera shake, noise and background object…etc. The second part is to classify what the moving object is. At this part, human detection systems exact all kinds of features and use mathematic equations or advance algorithm such as neuron networks to achieve the goal. But to distinguish human from other object is still a challenge when two or more people walking too close or when people are covered by some background object.
The several reasons mentioned above motivate us to develop a fast real-time human detection system with low computing load on the DSP platform. It can distinguish human from other object in a low cost and easy to set up. In human detection we use shape-based model to modeling the human. This human model can be used to detect moving human that has variation of size after normalizing, and provide a deformable matching algorithm to handle the situation when half body of human appear or few people walk too close.
1.2 Related Work
In recent years, many human detection approaches have been developed. There are two parts of human detection system: segmentation of moving object from background and human detection by distinguishing the human with other moving objects. Several methods for moving object segmentation are optical flow method [1],
[2], and [3], stereo based vision, and temporal difference method. Optical flow is used to detect independently moving objects but it has complex computation and sensitive to change of intensity. Optical flow used in [2], [3] was used to detect vehicle. Zhao et al [4] exploited stereo based segmentation algorithm to extract object from background and to recognize the object by neural network based recognition. Although stereo vision based technique have been proved to be more robust it requires at least two cameras and can be used only for short and middle distance detection. Carlos Orrite-Urunuela [8] used multiple cameras to analyze the 3D skeletal structure in gait sequences. They used 3D skeletal structure to make sure the shape of moving human can be completely extracted. And then they followed a point distribution model (PDM) approach using a Principal Component Analysis (PCA) to establish the shape of human. The fitting was carried out by selecting the closest allowable shape from the training set by means of a nearest neighbor classifier. They developed a human gait analysis to take into account temporal dynamic to track the human body. But this system need to use 3D skeletal structure, it needs multiple cameras to generate. And they can only successful extract whole shape in the simple and clean environment. The size of human must be large enough for their algorithm, which is a disadvantage for video surveillance system. Smith et al [5] used background subtraction method to segment isolate human. The serious problem of this approach is the changeable background or the illumination that is almost different in each frame. Zhuo-Lin Jiang [9] also used background subtraction method to segment isolate human. To avoid shadow they use the homogenous of shadow and background to eliminate the shadow. A time study algorithm was able to exclude the background object such as window curtains and indoor plants. Area thresholds can avoid sudden change of light or illumines interfere the moving object extraction. However they only eliminate shadow, animal and background object and then take rest of moving objects
as human. It is faster but less accurate. Y.L.Tian and A.Hampapur combine these two techniques together [10]. They firstly use the background subtraction to locate the motion area, and then perform the optical flow computation only on the motion area to filter out false foreground pixels. The background subtraction is popularly used in foreground segmentation. The motion information is extracted by thresholding the difference between the current image and background image. The background can be modeled as Gaussian distribution N(μ;σ 2 ), this basic Gaussian model can adapt to gradual light change by recursively updating the model using an adaptive filter. However, this basic model will fail to handle multiple backgrounds, such as water wave and tree shaking. To solve the problem of multiple backgrounds, the models such as the mixture of Gaussian, Nonparametric Kernel [11], and codebook [12] are provided recently. Although these algorithms are effective for modeling multiple backgrounds, they require more memories and more computation.
To distinguish human with other object (human recognition), several method have been implemented such as shape-based, motion-based, and multi-cue based methods. The shape-based approach uses shape feature to recognize human. Motion based approach use Fast Fourier Transform and its periodicity against time [6]. Some system integrates multiple features to recognize human such as shape pattern, motion pattern, skin color, etc. Curio et al [7] used the initial detection process that is based on geometry feature of human. Then, motion patterns of limb movements are analyzed to determine initial object hypotheses. There is another way for human recognition, such as neural network based approach. The neural network is powerful tool for pattern recognition. In [13], the BP network was used to recognize the pedestrian. The model based human recognition system analyzes the shape of object and classify the people from other objects. In order to recognize the people, we utilize the codebook method to model the shape of human, and propose the distortion
sensitive competitive learning algorithm to design the codebook. Sang Min Yoon, [14] used robust skin color, background subtraction and human upper body appearance information. They extracted the human candidate regions using color transform and background subtraction and update. To classify human and other objects that have similar skin color region or motion, an efficient incorporation of geometric pixel value structure and model based image matching using Hausdorff distance are implemented. Daoliang Tan, [15] they dealt with the problem of night gait recognition via thermal infrared imagery. First of all, human detection was accomplished, based on the Gaussian mixture modeling of the background. Then, human silhouettes were extracted on the basis of preceding detection results. Moreover, a new gait representation called HTI was proposed to characterize gait signatures for recognition.
1.3 Thesis Organization
The remainder of this thesis is organized as follows. Chapter 1-4 describes system overview including software and hardware architecture. Chapter 2 describes the foreground extraction, adaptive thresholding and moving object tracking. Chapter 3 shows detection system including human detection and deformable matching system. Chapter 4 shows the experimental results. Chapter 5 makes the conclusions of this thesis and the future works.
1.4 System Architecture
1.4.1 Software Architecture
Figure 1-1 : System architecture.
Figure 1-1 shows the overview of our human detection system. The static camera captures the current frame and feeds into our system. Our human detection system can take TV video sequence from camera and show the result to the TV monitor. After some de-noise filter, the system construct the background model for moving object extraction. Moving object extraction process extracts the foreground objects by subtracting with background model, and establishes a object tracking table for object
tracking and providing the information for classification. After using some filters and normalization, the deformable codebook matching algorithm can distinguish human from other objects.
Classification Moving Object Extraction Background
Model BackgroundUpdate Temporary Difference Adaptive Update Factor Background Model Subtraction Optimal Threshold
Setting Mean Filter
Erosion Dilation Connect Component Object Tracking Table Normalization Multiple Human Separating Deformable Codebook Matching Result Buffer Output Image Current
Frame SampleDown
Size Filter Ratio Filter
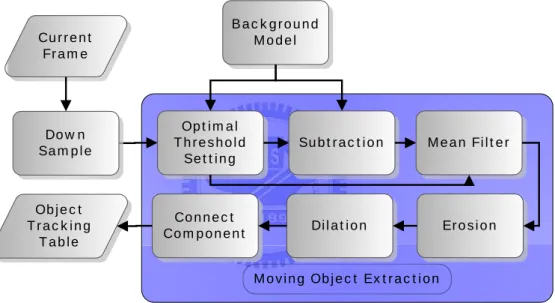
Figure 1-2 : Human detection system.
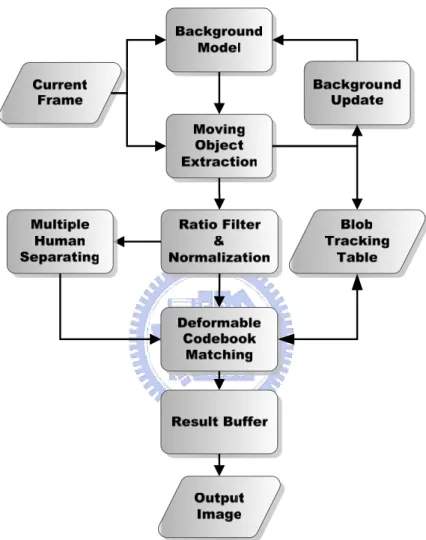
Figure 1-2 is the detailed flow chart of our human detection system. The system is divided into three blocks: background model block, moving object extraction and object tracking block, and classification block. After down sample, current frame is used to establish the background model and update the background frame and we call
this block background model block. Moving object extraction use optimized threshold setting to support background subtraction method. Erosion and dilation operation can decrease the noise influence and get a more complete shape. The connect component process provide us a full region of moving object, and the object tracking table are set up when regions of moving object confirmed. The classification block provides us full body human detection, first half body human detection and multi-human detection with deformable codebook matching algorithm. And the data from ratio filter and multi-human separating part is necessary for deformable codebook matching algorithm.
1.4.2 Hardware Introduction
Figure 1-3 : Blackfin A-V EZ-Extender.
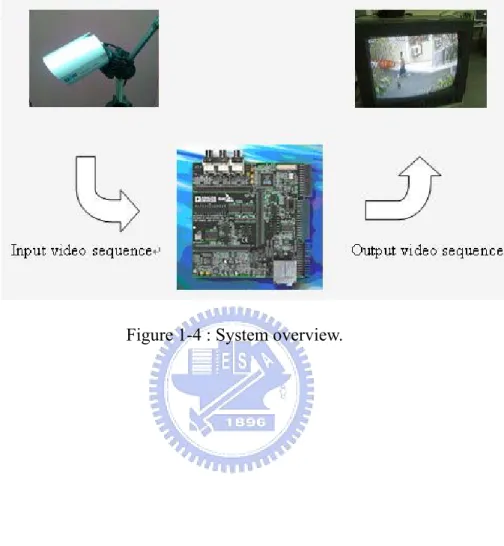
Our human detection system is built on the DSP platform of Analog Device ADSP-BF561 EZ-KIT Lite. The Blackfin A-V EZ-Extender daughter board is used to allows us to evaluate a diverse set of peripherals on the ADSP-BF561 processor. The EZ-Extender contains video connectors allowing connection to camera sensor. We can
develop our algorithm on the Analog Device VisualDSP ++ and execute the code on the development kit and processor. And Figure 1-4 shows the overview of our system.
2
Chapter 2
Moving Object Extraction
2.1 Background Construction and Dynamic
Background Update
Before we construct our background, there are something about the video stream format we should know.
The video sequence format comes from DSP development kit is ITU-656. ITU-656 data stream is a sequence of 8-bit or 10-bit bytes, transmitted at a rate of 27 Mbyte/s. Horizontal scan lines of video pixel data are delimited in the stream by 4-byte long SAV (Start of Active Video) and EAV (End of Active Video) code sequences. SAV codes also contain status bits indicating line position in a video field or frame. Line position in a full frame can be determined by tracking SAV status bits, allowing receivers to 'synchronize' with an incoming stream. Individual pixels in a line are coded in YCbCr format. After a SAV code (4 bytes) is sent, the first 8 bits of Y (luminance) data are sent then 8 bits of Cb (chroma U), followed by 8 bits of Y for the next pixel and then 8 bits of Cr (chroma V), the 4:2:2 digital video encoding parameters.
Figure 2-1 : Example of ITU-656 data format.
An ITU656 video frame is divided into two fields, field 0 and field 1. Figure 2-1 shows that what one frame actually looks like, and Figure 2-2 shows the arrangement of ITU-656 in each frame. The black part is head data, the others are the video sequence. The ITU-656 video format size is 858*525 and the actually pixel number is 720*486, which is too large for real-time processing and take too many space in the memory. Therefore, the first step is to down sample the current frame. We down sample the current frame from 720*486 to 180*122, about quarter size of each side. The efficient way is to use only one field and down sample the width two times than the height.
After down sample the current frame, we can build the background. The system will delay for few seconds while system starting, because of booting the DSP and waiting for the stable video sequence from camera. The system will delay for few seconds. The first frame is taken after whole system comes to stable. In order to construct the background for moving object extraction, the first current frame will be taken for the original background model. Here we only use the Y (luminance) channel for our system. If we only focus on the shape and the movement of foreground objects, using the gray level image but colorful image can decrease the computing power and make the issue easier.
If the background constructed at first dose not adapted as time proceeding, the system will be failed. The light change, moving background objects or camera movement will cause the false result of system, which must to be prevented. The simple way to avoid the above problem is to update the background once in a while. We use Eq. 2-1 to update the background after a period of time T . u
(2-1)
Where n B
P represents each pixel of current background and n−1 B
P is pervious one. IM represents each pixel of active part between previous frame and current
frame.
α
(0 , 1) will be the update factor of background updating. Every time we update the background, the current frame would be saved to memory. Next time when we need to update background we do the temporal difference between the saved frame and current frame. We set IM to 1 when the gray value of temporal difference higherthan a threshold, and set IMto 0 if this pixel doesn’t change a lot.
⎪⎩
⎪
⎨
⎧
=
=
−
+
=
− −1
,
0
,
)
1
(
1 1 M n B M C n B n BI
P
I
P
P
P
α
α
Background
Model BackgroundUpdate Temporary Difference Adaptive Update Factor Background Model Current Frame Down Sample
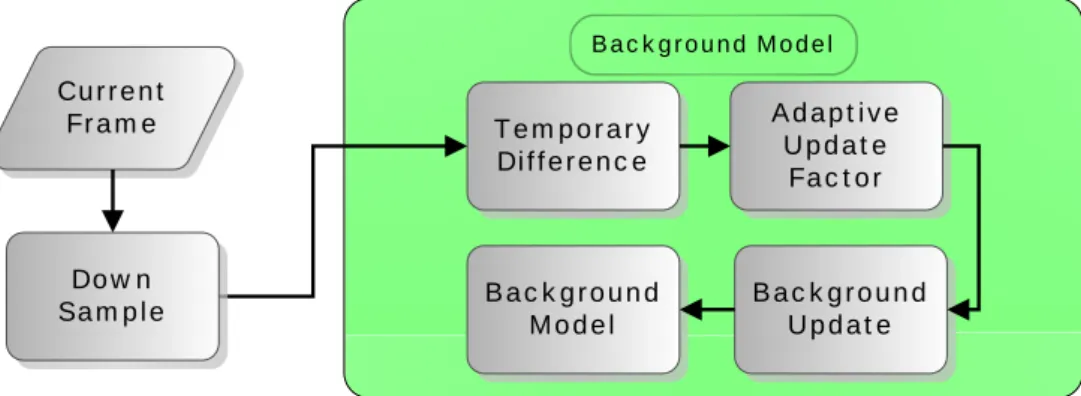
Figure 2-3 : The flow chart of background model.
Figure 2-3 is the flow chart of background model. The adaptive update factor
α
is the key to control background update rate. There are two cases which may causeα
increase or decrease. First, the number of pixels with IM =1 is less than a number for a while and the result of background subtraction shows there are many moving point, which is caused by camera movement or heavy change of light. Theα
should increase to speed up the update rate for getting background stable. Secondly, if standard deviation of current frame is much large then standard deviation of background,α
should increase too. This situation may be caused by local light change or shake of branches.2.2 Adaptive Foreground Extraction
2.2.1 Optimal Threshold Finding Function
The background subtraction system is used to provide foreground object through taking threshold of difference image between the current image and reference image.
If the reference image is the previous frame, this method is called temporal difference. The temporal difference is very adaptive to dynamic environment, but generally does a poor job of extracting all relevant feature pixels. The improved methods such as mixture of Gaussian and Nonparametric Kernel can behave better performance, but they need extra expensive computation and more memories. For real time system, especially integrated with real time DSP system, we don’t think their cost is worthy, because the CPU usage and memories usage are very significant for system stability.
Moving Object Extraction Subtraction
Optimal Threshold
Setting Mean Filter
Erosion Dilation Connect Component Object Tracking Table Current Frame Down Sample Background Model
Figure 2-4 : The flow chart of moving object extraction.
If we want to use background subtraction for extracting moving objects. The selection of threshold (TH ) is the key for successful moving object extraction. If
THis too low, some background are labeled into foreground. If TH is too high,
some foreground are detected as background.
0
The traditional way is to select a based threshold and according to the variation of difference value between background and foreground to do some modification of threshold. But this is based on the assumption that illumination gradually changes. However when light suddenly changes, such as suddenly turning off the light and camera activating the infrared ray lighting, this assumption will be violated. Instead of the traditional way, we have to automatically select TH according to the level of light change. Equation 2-2 is the concept of our adaptive threshold selecting function. We select a based threshold TH and mix with a variable shifted 0 β based on
standard deviation. The definition of TH is fallowed. 0
(2-3)
Firstly, we search the average value avgB of background model. After that,
Equation 2-3 is used to compute TH for each pixel. 0 th is the based reference
threshold. P is the gray value of each pixel in the background model. B
γ
is thelowest value of TH , and is defined by the standard deviation, 0 STDB.
B
STD
a
×
=
γ
(2-4)(
C B)
(
C B)
b avg
avg
c STD
STD
β
=
−
+
−
(2-5)Each one of
a b c
, ,
is a constant value between 0 and 1. avgC,avg are the Baverage of all pixel of current frame and background frame. STDC,STD are the B
standard deviation of whole current frame and background frame respectively.
⎪
⎪
⎩
⎪⎪
⎨
⎧
≥
<
≤
+
−
×
−
<
=
B B B B B B B B B Bavg
P
th
avg
P
avg
avg
th
avg
P
avg
P
TH
,
2
/
,
2
/
)
(
)
2
/
(
2
/
,
0γ
γ
γ
In other words, our threshold is based on background gray value. The dark part in the background frame has lower threshold, on the other side, the bright part of background has higher threshold. And the change of threshold is according to the average and standard deviation of current frame and background model. To prevent the heavy computing consumption, this threshold selecting method is activated when background update process.
2.2.2 Noise Elimination Filter
Now we have a good threshold adaptation method to extract the moving foreground object, but the noise is always a problem for the system even we have adaptive threshold. Traditionally, there will be some noise elimination filters before background subtraction. However, the traditional noise elimination filters will be violated when light suddenly changes. Instead of the traditional way, we have to find some easy way to improve the effect of this kind of noise elimination filters. The key of our noise elimination process is to put off the time of using filters till finish of background subtraction. And instead of all kinds of complex filter such as median filter or Gaussian filter, we use only mean filter to get better result.
Here is the description of our method. After background subtraction, we have initial process frame. The value of each pixel in the initial process frame is set to zero if the difference of each pixel between background frame and current frame is smaller than TH . The others will be set to the value of the result of background subtraction. And now we use five by five mean filter to decrease the inference of noise.
Mean filter is a kind of smoothing linear filter. The output of a mean filter, a smoothing, linear spatial filter is simply the average of the pixels contained in the neighborhood of the filter mask. The mask is shown as fallow:
1
25
×
After remove most of noise, we are able to use the dilation and erosion operations to make the shape of moving objects more complete. Dilation, in general, causes objects to dilate or grow in size; erosion causes objects to shrink. The amount and the way that they grow or shrink depend upon the choice of the structuring element. Dilating or eroding without specifying the structural element makes no more sense than trying to low-pass filter an image without specifying the filter. The two most common structuring elements (given a Cartesian grid) are the 4-connected and 8-connected sets. They are illustrated in Figure 2-5.
. Figure 2-5 :4-connected and 8-connected sets.
1 1 1 1 1 1 1 1 1 1 1 1 1 1 1 1 1 1 1 1 1 1 1 1 1
(a) (b) Figure 2-6 :Dilation diagram.
(a) (b) Figure 2-7 :Erosion diagram.
We can see the result of dilation operation in Figure 2-6. The left side (Figure 2-6(a)) is the original object (gray part). The result is the pixels mixed by the gray and black points as shown in Figure 2-6(b). After dilation process, we can see the gray points are surrounded by black points. It becomes bigger. In the other hand, the result after erosion process is shown in Figure 2-7. Figure 2-7(b) is the final result of erosion operation. The gray part in Figure 2-7(b) is the result after process and the black part is eroded by operation.
2.2.3 Connect Components Labeling
The dilation and erosion operation make the moving object clearly. What we need to do now is to segment the exact location and size of these objects. The connected components labeling method is what we need to do for extract the whole object from discrete points. Figure 2-8 (a) shows that without connected components labeling and all interesting points belong to 1 and others are 0. That means all points are not connected. Although we can easily distinguish these four objects, but when they don’t have any connection the computer can’t tell the difference. So the connected components labeling is necessary and Figure 2-8 (b) shows that connected components labeling separate four un-overlap region and paint it in different color where each color represents a single separated region.
(a) Before connected components. (b) After connected components. Figure 2-8 : Example of connected components labeling.
The connected components algorithm is frequently used to achieve this work. Connectivity is a key parameter of this algorithm. There are 4, 8, 6, 10, 18, and 26 for connectivity. 4 and 8 are for 2D application and the others are for 3D application. We used the 8-connectivity for our implementation. The connected component algorithm
worked by scanning an image, pixel-by-pixel (from top to bottom and left to right) in order to identify connected pixel regions. The operator of connected components algorithm scanned the image by moving along a row until it came to a point (P) whose value was larger than the preset threshold of extraction. When this was true, according to the connectivity it examined P’s neighbors which had already been encountered in the scan. Based on this information, the labeling of P occurred as follows. If all the neighbors were zero, the algorithm assigned a new label to P. If only one neighbor had been labeled, the algorithm assigned its label to P and if more of the neighbors had been labeled, it assigned one of the labels to P and made a note of the equivalences. After completing the scan, the equivalent label pairs were sorted into equivalence classes and a unique label was assigned to each class. As a final step, a second scan was made through the image, during which each label was replaced by the label assigned to its equivalence classes. Once all groups had been determined, each pixel was labeled with a gray level or a color (color labeling) according to the component it was assigned to.
2.3 Moving Object Tracking
The connected components labeling process extracts all separate object and give them indexes. Then we can use these data to build a table for these objects. We call this table Object Tracking Table. This object tracking table contains several items, include life time, coordinates, classify record…etc. Table 1 shows all items in the object tracking table. Several items are useful for further classification which we will discuss in chapter 3, such as H/R ratio or histogram.
Table 1 : The items of object tracking table.
Item description
Index Labeling number Coordinates Top-right and bottom-left coordinates Life Times Life period
FindorNot Search result for comparing previous object tracking table FindorNot Counter Search result buffer
NeworNot New object or not Classify Record Classify Record H/W Ratio Height, width ratio. Size Size
Histogram Data Histogram for pixel number project to width axis
To build object tracking table there are several steps we need to do. Firstly, we need to know the object existed in current frame will or not exist in next frame. Secondly we need to analysis the character of object to assist our classification process. The flow chart of how to know the object shown in this frame is still here when next frame comes in is as shown bellow.
Figure 2-9 : Object tracking table update process.
We check every new object to see if the object is belonging to one of object tracking table. The first step is checking the overlapping status. There are three
condition of overlapping status: one contains the other or big overlapping area, small overlapping area and more the one overlapping object, and not overlap. When the area of one object contains the other or there is seemed to be a big overlapping area, we take these two objects are the same one and update the object tracking table. If they only have small overlapping area or the compared result shows that the new object has more the one overlapping object, we will use the center of object to tell the difference. We set a threshold for difference between two centers of object. If the difference is upper than threshold, the comparison is fail. If the difference is lower than threshold, we take these two objects the same. When more than one object is success compared, the final check method is present. We use histogram comparison to be the final gate of object tracking table updating process. When new object connect to more than two object lists in the object tracking table and they are close enough for center threshold, we use the histogram of each object to calculate the SAD (Sum of Absolute Difference). Because our system is a real-time system, when FPS is 30, using SAD to identify the similarity is practicable.
3
Chapter 3
Human and Non-Human Detection
In this chapter, we will explain how the human and non-human detection process works. Because of the requirement of low computing power, we choose the shape-based human model to classify human being by codebook matching, which decrease the performance of human detection from the other objects. The people walking indoor are sometimes covered by furniture such as desks or chairs. To solve this kind of problem, we provide Deformable Codebook Matching, a human detection algorithm for first half body with different height/width ratio. With Deformable Codebook Matching, when someone’s bottom half body is covered, the system can still work. Further, we use Deformable Codebook Matching to implement the human detection for multiple people walking side by side. Figure 3-1 is the flow chart of human and non-human detection process.
3.1 Codebook Classification
The ultimate goal of our developed system is to be able to identify people and track individuals to find out what they are doing. But the most of we can do now is to do the classification of human and non-human. The algorithm we used is presented below. For human recognition, we use the codebook to classify the human from other objects. At first, we normalize the size of human being in any attitude to 20 pixels at the horizontal by 40 pixels at the vertical, and then extract the shape and the histogram of object as the feature code to construct the codebook. Second, we match this feature vector against the code vectors in the codebook. The purpose of matching process is to find a code vector in codebook with the minimum distortion to the feature vector of object. If the minimum distortion is less than a threshold, we consider this object as human.
In order to describe how we use the codebook to classify the human from other objects, there are some variables should be defined at first. If we can extract a series of features as feature word X from every normalized image, and each of X include data of M dimensions, indicated by 0 i M−1
X X
X L L . There are N sets of
code word V defined asV0LVjLVN−1 in codebook C. Each of V just like j X
hasM dimensional data defined as 0 M−1
j i j j V V
V L L . The distortion between feature
word and code word is defined in Equation 3-1.
∑
− =−
=
−
=
1 0 M i i j i j jX
V
X
V
Dis
(3-1)1
0
)
min(
min=
Dis
j
=
N
−
Dis
jL
(3-2)X
Codebook
With the definition of these variables above, we can explain the procedure of the human detection. Every time when we get a new foreground object, we do the normalization to get a uniform size image. After normalization, we take the feature wordX from this new object. And the way we extract the feature word X will be
shown in the next section. The feature word X is used to compare with every Vj in
the codebook (C). The compared function DIS(X,V) is shown in Equation 3-1.
min
Dis is the minimum of comparing result in the N code words. If the value of
min
Dis is smaller than the threshold we defined, the object with the feature word X
is considered as human; otherwise, it is not a human object. Figure 3-2 shows the demonstration of comparing X with Vj in the codebook.
Figure 3-2 : The procedure of the comparison with the codebook.
And the way to extract the feature word X is described as follows. After
normalizing the object image to 20 pixels by 40 pixels, we use a vector with twenty elements to describe the shape of the foreground object, and a histogram vector of ten elements by the projection of the object image on X axis is also used to increase the accuracy. To extract the shape features of foreground object, we draw a horizontal line with fixed coordinate at Y axis on the normalized image. Both the leftest and most right intersections of the horizontal line and the boundary of the object are recorded to represent the shape information. The features of feature word are obtained by drawing
min
ten horizontal lines. The twenty coordinates at X axis of the twenty intersections forms the feature word to represent the shape information. Figure 3-3 shows the feature word extraction in the image (white points).
Figure 3-3 : Feature word extraction: shape information.
There are something we need to notice. The top two and bottom two raw of pixels are not suitable for the feature word because these pixels are changeable. The way we find ten fixed Y axle values is to calculate the standard division in each fixed Y axle for total four thousand training samples, and then chooses ten lowest values each side to determine the coordinate Y axis of these ten horizontal lines.
After the shape information extraction mentioned above, we get feature word with twenty elements. The way to find the histogram of projection information is described below. Figure 3-4 (b) shows the final ten dimension of the feature word. We project the mask image to the X axis and calculate the pixel value to build a histogram of the projection on X axis. We take ten values of histogram for the feature word. If we only use discrete shape information, some of hollow object may not be detected correctly. The histogram of projection information can eliminate lots of non-human object and prevent the false alarm. The diagram to extract the histogram of project information is shown in Figure 3-4 (b)
(a)Object. (b)Histogram of projection
Figure 3-4 : Feature word extraction: histogram of projection information.
After describing our procedure of human detection, we will illustrate how to build a codebook for the distortion measurement in the next section. When we build a codebook for the classification, the further step is to overcome some problems encountered to improve the performance of system. It will be discussed in the section after the establishment of the codebook.
3.2 Training Algorithm
The design of the codebook is critical for the classification. The well-known partial distortion theorem for codebook design is that each partition region makes an equal contribution to the distortion for an optimal quantizer with sufficiently large N [16] and [17]. Based on this theorem, we use the distortion sensitive competitive learning (DSCL) algorithm to design the codebook. In order to describe this algorithm, we define
V
=
{
V
j;
j
=
1
,
2
L
,
N
}
as the codebook and V is the j j code vector. tht
X is the th
t
train vector andL
is the number of train vector.D
i is the partialdistortion of region
i
R
, andD
is the average distortion of codebook. The DSCL3.2.1 Pre-classify (K-Means)
The first step of the training algorithm is to initiate a set of code words in the codebook for the initial sets, and we select the K-Means to do this job. We use K-Means algorithm to build
N
prototypes fromt
M
training sample for the first stepof training algorithm. The simple description of K-Means algorithm is presented below.
The main purpose of K-Means algorithm is to cluster the whole samples based on attributes into k partitions. It is similar to the expectation-maximization algorithm for mixtures of Gaussians in that they both attempt to find the centers of natural clusters in the data. It assumes that the object attributes form a vector space. The objective is to make the center to achieve minimize total intra-cluster variance, or, the squared error function.
∑ ∑
= ∈−
=
k i x Si i j jx
Var
1 2μ
, (3-3)where there are
k
clustersS
i
k
i
,
=
1
,
2
L
.μ
i is the center or mean point of iS
. We use the Lloyd's algorithm which is the most common form of the algorithmusing an iterative refinement heuristic. Lloyd's algorithm consists of two steps. At first, the input points are partitioned into k initial sets. It may use either at random or using some heuristic data. Secondly, it calculates the mean point, or center, of each set. The second step will constructs a new partition by associating each point with the closest center. Then take the new clusters into first step, and algorithm repeated by alternately
applying of these two steps until convergence, which is obtained when the points no longer switch clusters (or alternatively centroids are no longer changed). Lloyd's algorithm and k-means are often used synonymously. In reality, Lloyd's algorithm is a heuristic for solving the k-means problem. However, with certain combinations of starting points and centroids, Lloyd's algorithm can in fact converge to the wrong answer (A different and optimal answer to the minimization function above exists.)
3.2.2 Training Algorithm
We refer the DSCL algorithm in the [17] to build the codebook of codebook matching algorithm, and the steps of training algorithm is list below.
z Step 1 :
Initialization I
Set
V
(
0
)
=
{
V
j(
0
);
j
=
1
,
2
L
,
N
}
with K-means algorithm, and∞
=
)
0
(
D
,D
j(
0
)
=
1
,r
=
0
. z Step 2 : Initialization I I Sett
=
0
z Step 3 :Compute the distortion of each code word.
)
(t
W
X
Dis
j=
t−
jz Step 4 :
Select the winner: the th
k
code wordN
j
Dis
t
D
Dis
k=
min(
j(
)
j)
=
1
,
2
L
,
z Step 5 :Adjust the code word for winner.
))
(
)(
(
)
(
)
1
(
t
W
t
t
X
W
t
W
k+
=
k+
ε
k t−
k z Step 6 :Adjust
D
k for winner.k k k k k k k k
D
t
D
t
D
Dis
t
t
W
t
W
t
N
D
Δ
+
=
+
+
+
−
+
=
Δ
)
(
)
1
(
1
)
1
(
)
(
1
Where
N
k is the number of train vectors belonging to regionR
k.z Step 7 :
If
t
<
L
thent
= t
+
1
, and go to step3. Others go to step8. z Step 8 : ComputeD
(
r
+
1
)
.∑
−
=
+
X
W
L
r
D
(
1
)
1
i If + − <ε ) ( ) ( ) 1 ( r D r D r D3.3 Deformable Codebook Matching
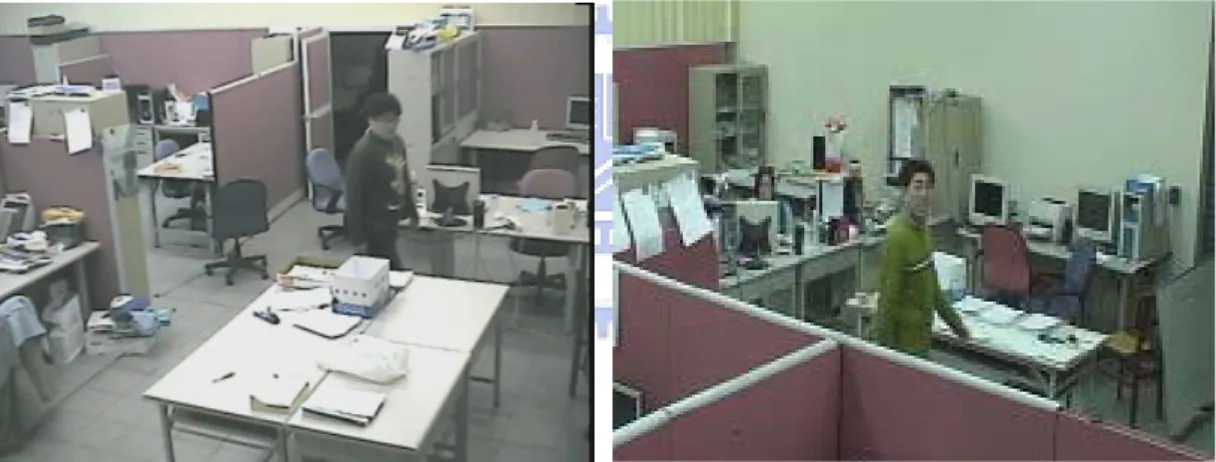
There are several problems for human detection in indoor environment such as light change or hidden foreground object. When people walk in the indoor environment, it is a common situation that the bottom half body of human is covered by background object. Some examples of this kind of situation are shown in Figure 3-5. The camera is setting on the ceiling and captures the video sequence with an angle of depression. On this angle, we can see the bottom half body of human on the field is blocked by the table or board.
Figure 3-5 : Indoor video.
When it comes to outdoor environment, the situations are also the same which is shown in Figure 3-6. When it comes to these situations, most of human recognition system which use the full body features will be failed. Because of this kind of situations, we propose “Deformable Codebook Matching (DCBM)” algorithm to attack the problem of half body of human occurring at first as shown in Figure 3-5 and Figure 3-6. Further more, we use the deformable codebook matching algorithm to do the multiple-occlusive human detection. This part will be also present after we finish describing the DCBM algorithm.
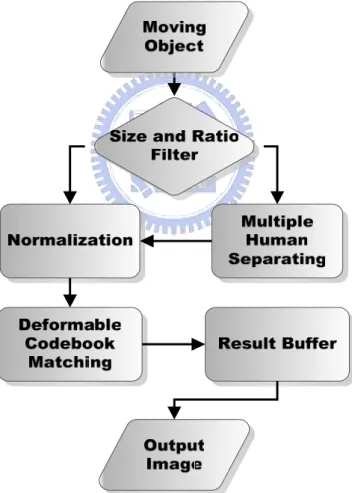
Figure 3-7 : The flow chart of deformable codebook matching.
Figure 3-7 is the flow chart of deformable codebook matching algorithm. The ratio filter tells us which detecting algorithm we should execute, full body matching
or first half body matching or multiple human matching. The result buffer can receive the result from object tracking table to correct the temporary result.
3.3.1 Full Body Matching
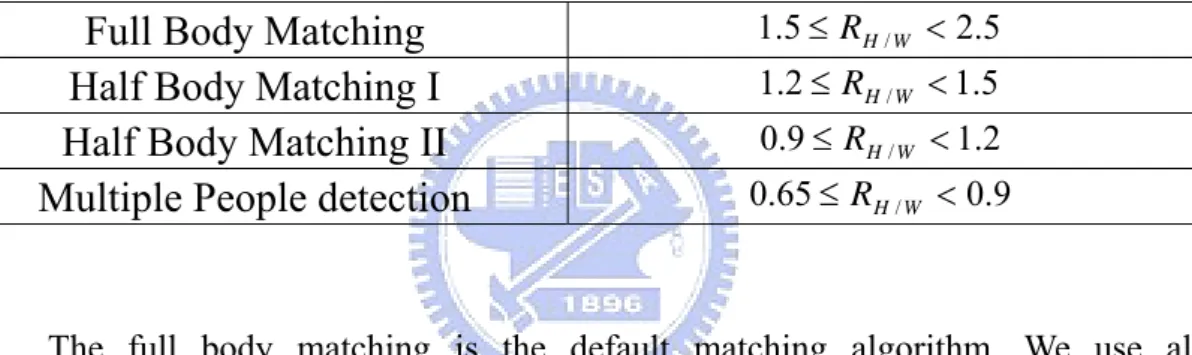
As we discussed in the previous section, we use the height and the width of the object to decide which matching algorithm we should use. The table 2 shows this process, where RH/W is the ratio between the height and the width of the object.
Table 2 : H/W ratio selecting table.
Full Body Matching
1.5≤ RH/W <2.5Half Body Matching I
1.2≤ RH/W <1.5Half Body Matching II
0.9≤ RH/W <1.2Multiple People detection
0.65≤RH/W <0.9The full body matching is the default matching algorithm. We use all information of the feature code word to distinguish human from the other objects. The distortion
Dis
between feature word and code word in the codebook is defined in Equation 3-1. AndDismin defined in Eq 3-2 is the minimum of the distortion with N code words. If the value of Dismin is smaller than the threshold we set, theobject is human, otherwise, it is not human. This part we already explain in the section 3.1.
The threshold of this matching algorithm is defined by the testing result. After training procedure, we use another two hundred testing samples to test the codebook we built and find the suitable threshold for the codebook. The testing result is shown in Figure 3-8. We take the value in the intersection as the value of threshold. And there is one thing we should notice that the feature word contain two part, shape
information and histogram information. Just as the feature word, there are two thresholds for shape feature word and for histogram feature word.
0 10 20 30 40 50 60 0.0 0.2 0.4 0.6 0.8 1.0 Accurate Threshold Value Human Object Non-Human Object
Figure 3-8 : Threshold finding result.
3.3.2 First Half Body Matching
The first half body matching is the most important part of the deformable codebook matching. This matching algorithm is proposed for solving the foreground object covered by background object such as the cases in Figure 3-5 and Figure 3-6. It uses the limited information to classify the moving object. The main idea is very simple. We use the H/W ratio RH/W to decide how many dimensions of data we
should use for classification. Table 2 shows the way we select matching algorithm by looking up RH/W . We can see there are two level of first half body matching.
need, but in order to reduce the computing power and simplify the system, we only use two stages to simulate the overall situations.
(a) People with only half body. (b) People with full body.
Figure 3-9 : Comparison with full and half body.
When people show in the video with only first half body, we can see in Figure 3-9, it contains a little less information of the human body than full body human object. If we want to remain the performance of detecting rate and not to modify the codebook we already build. The best and the simplest way is to use the information which is not lost when covered or the information which can not be affected by this situation.
The information which will not be lost when the human object is covered by something is the upper half body shape-based features. With this definition, they are the first ten or eighteen shape features of the shape-based part in the feature word. We can see the Table 3. In the ordinary full body codebook matching algorithm, the shape-based information is twenty dimensional data. With decreasing ofRH/W, we
also decrease the number of shape-based feature. And the size of object after normalized needs to be change for the matching procedure too.
Table 3 : Half body matching table.
Data Type
Level
W H R /Range
Shape Histogram
Full Body Matching
1.5≤RH/W <2.520 10
Half Body Matching I
1.2≤RH/W <1.516 10
Half Body Matching II
0.9≤RH/W <1.210 10
There is one thing we should notice, the feature word contain two part, information from shape and information from histogram. As we mention before, the information we need for the half body matching is the feature which can not be affected when covered situation occurs. When we get the feature word from histogram, we also normalize it in to a fixed range. So even if the bottom part of human is covered, the histogram of the human is not change a lot. The threshold for this part is also been modified according the requirement. So the information from histogram can be taken as the invariable feature with covered situation occurring.
After recombination of these two parts of feature word, the only thing we need to do is to compare the feature word with the codebook to obtain the distortion. And this part has been discussed in the section 3.1. The only thing we need to do is to do some little modification in Equation 3-1.
∑
∑
∈ ∈−
+
−
=
−
=
H i i j i S i i j i j jX
V
X
V
X
V
Dis
(3-4)Equation 3-4 is the result after some modification. S is the set of the
shape-based feature which we need in the different level of half body matching algorithm. H is the set of all the feature from histogram.
3.3.3 Multiple Occlusive Human Detection
DCBM can also be used to solve some more complex problems, as well as the situation of detecting the human whose bottom half body been covered. Foe example, we can utilize DCBM to realize the human detection in the situation of multiple-occlusive human. We find out that these two problems have lots of common points. First, the major problem of multiple-human detection is that there are some occlusive part can not be seeing when people walk side by side as shown in Figure 3-10. Second, when we take a close look at non-occlusive part of this two human, we can see the upper half body of these two people are not covered. According to these two common points we consider that we can use the deformable codebook matching algorithm to realize the human detection in detecting the multiple-occlusive human.
Figure 3-11 : Flow chart of multiple-occlusive human detection.
Figure 3-11 is the flow chart of this procedure. The first step is to select the object which probably is the occlusive object of two or more human. This step contains two moves, one is the size and ration filter and the other is the information from histogram. We use size and ration filter to take appropriate size and H/W ratio which is between 0.65 and 0.9, just as the value in the Table 2. And we use information of histogram to ensure if the moving object contains two or more occlusive blobs. Finally, we use the information of histogram to separate these blobs and then feed into the DCBM algorithm to recognition what these objects are.
0 10 20 30 40 50 0 10 20 30 40 50 60 Nu m b er of P ixels Column Number
0 10 20 30 40 50 -20 -10 0 10 20 30 40 50 60 Nu m b er of Pixels Column Number Original Histogram After Smoothing First Derivative Second Derivative
Figure 3-13 : Projection histogram checking and separating.
Figure 3-12 is the projection histogram of moving object in Figure 3-10, we can easily see there are two major blobs joined together, and the height/width radio is competent. But how does our system know there are two blobs joined together? We use the first order differentiation and second order differentiation of the histogram to ensure the shape of histogram is like a camel's hump. According to Fermat's theorem, let f :(a,b)→R be a continuous function and suppose that x0∈(a,b) is a local
extremum of f . If f is differentiable in x and 0 f'(x0)=0. So we can find there
are three extremums for the histogram except the beginning and ending point in Figure 3-13. And the “second derivative test” tells us if the function is twice differentiable in a neighborhood of a stationary point, then the sign of second derivative can tell us the open side of the camel's hump. By using first and second derivative of histogram we can easily to figure out whether the shape of histogram is right or not. We can use the above procedure to tell the difference between Figure 3-13 and Figure 3-14 which is a histogram of tree waved shadow. And by using the location of stationary points, we can separate the connected blobs by cutting through the location of local minimum.
0 10 20 30 40 50 60 -10 0 10 20 30 40 50 60 N u mb er of Pi x el s Column Number Original Histogram After Smoothing First Derivative Second Derivative
Figure 3-14 : Histogram analysis of a tree waved shadow.
Figure 3-15 : Result of multiple-occlusive human detection.
The vertical red line in the red block in Figure 3-15 is the result of multiple-human separating algorithm. As we can see, the vertical red line makes these two blobs become individual ones. Finally we cut the blob we separated and take the information of first half body. Then we use DCBM algorithm to classify the blob. And this is how the Multiple Occlusive Human Detection algorithm works.
0 10 20 30 40 50 60 -10 0 10 20 30 40 50 60 Nu m ber of Pix e ls Column Number Original Histogram After Smoothing 1st Order Differentiation 2nd Order Differentiation
4
Chapter 4
Experimental Result
In this chapter, we will show the experimental results of our human detection system. First, we discuss the importance of the threshold when doing temporal difference and binalization in the chapter 2 and present the function to determine the optimize threshold. Section 4.1 will show the simulation result of this method. And section 4.2 will preset the result of how the noise elimination filter works, and carry out some comparison with the ordinary situation. Section 4.3 presents the most main simulation result of the human detection with deformable codebook matching, DCBM algorithm. Including single and multiple human detection and half body situation. Section 4.4 and 4.5 is the summary of the simulation results. And finally we will make some discussion in section 4.5.
4.1 Simulation Result of Optimize Threshold Finding
Algorithm
Recall the function we discussed in Chapter 2, our threshold is based on background gray value. The dark part in the background frame has lower threshold, on the other hand the bright part of background has higher threshold. And the adjustment of threshold is according to the average and standard deviation of current frame and background model. To prevent the heavy computing consumption, this threshold selecting method is activated during background update process. Figure 4-1
is the example of plot of the threshold adjustment. The middle line is TH , the basic 0
part of our threshold, the upper and under line is the threshold modified by the argument β . The two turning points of Figure 4-1 are decided by the stander deviation and the average value of current frame and background model.
0 50 100 150 200 250 5 10 15 20 25 30 35 40 T h re shol d
Background Pixel Gray Value
Figure 4-1 : The plot of threshold adjustment.
Figure 4-2(a) is the testing video of our system, the scene of this video is our laboratory but the light is off at all. The only light source is the infrared rays from camera itself. This frame shows the poor luminance and bed situation in the indoor environment. Figure 4-2(b) is the result with utilizing the fixed threshold. We can see that the people’s bottom half body in Figure 4-2(b) can not be detected. Figure 4-2(c) is the result with utilizing the regulation 3σ of threshold which is used in several papers with good performance. We can see that it is a little batter than Figure 4-2(b), but it is not as well as our threshold yet. If use our threshold adjustment function, we can see in Figure 4-2(d) not only bottom half body but also the shoulder and head can be seen more clearly. It shows that the higher sensitivity part of our threshold adjustment function works.
(a) Current frame. (b) With fixed threshold.
(c) With regular 3σ threshold. (d) With our threshold. Figure 4-2 : Example of utilization of the threshold adjustment function.
(a) Frame n (b) Frame n+1 Figure 4-3 : Scene of Figure4-4.