2012 International Conference on Systems and Informatics (ICSAI 2012)
EEG Power Spectrum Analysis to the Human Impact
of Energy Crystal
Wei-Dian Lai
Dept. of Computer Science and Information Engineering Chung Chou University of Science and Technology
Changhua, Taiwan, ROC
Ben-Yuh Liao
Dept. of Education National Taitung UniversityTaitung, Taiwan, R.O.C.
Abstract—This study focuses on EEG (Electroencephalogram)
measurement instruments to measure subjects touched in the energy field to find a crystal by the results, and record the brain waves of those subjects 60 seconds. The brain waves are measured amplitude sector in ± 200μV. Brain wave measuring instruments used is Electrical Geodesics, Inc (EGI) model GES 140. Measurement signal sampling rate is set per channel per second, at 250 samples selected points. Impedance of each channel is controlled at 80KΩ, which is below normal in general use between about 0-5KΩ. The signal uses a notch filter 60 Hz filter. Subjects are men between the ages of 21 to 23, with normal physical conditions. A total of 20 subjects are measured. There are 11 subjects out of energy after the larger energy of 7, while 2 showed no change. Finally, brain waves are obtained through the Fourier transform, and changed from the time domain into the frequency domain of the brain wave frequency spectrum. In addition, changes in channel CH27 are less obvious, while the remaining channels in the body are made after touching power crystal δ wave (1-4 Hz), where α (8-12 Hz) wave was significantly enhanced. Experimental results show that human touch energy crystal creates the δ wave and α wave is markedly enhanced, thus, confirming the effectiveness of the energy crystals.
Keywords-Electroencephalogram; energy field; Fourier transform; Impedance; brain wave
I. INTRODUCTION
EEG Brain waves are mainly used in clinical cerebrum-vascular diseases, epilepsy, sleep disorders, neurological diseases, and schizophrenia, where clinical identification of disease are mainly based on waves, rather than the potential size of the change. In this study, the human brain is examined through the scalp by EEG. Brain waves are transformed through the Fourier method from the time domain into the frequency domain of the brain wave frequency spectrum, as the frequency of the different domains can be divided into five basic EEG frequency bands, Delta (δ)-band, Theta (θ)-band, Alpha (α)-band, Beta (ß)-band, Gamma (γ)-band. As the five basic frequency bands are not uniform, there are differences. Fikri Goksu [1] proposed to use features of the spectrum,
namely, time and space domain methods of classification of EEG. The basic wave band is defined as δ-band (1-4 Hz), θ-band (4-8 Hz), α-θ-band (8-16 Hz), ß-θ-band (16-32 Hz), and γ- band (32-64 Hz). Hassan Sharabaty [2] proposed to apply the Hibbert Huang transform (HHT) to locate the EEG waves of the α and θ waves. The basic wave band is defined as δ-band (<4Hz), θ-band (4-8 Hz), α-band (8-12 Hz), ß-band (12-30 Hz), and γ-band (>30). N.A. Salleh [3] proposed a unique position in the church kowtow analysis found that use of the spectrum produces a relatively high alpha power (RPα), can promote human mind and body relax. That study band used the δ-band (0.5-4Hz), θ-band (4-8 Hz), α-band (8-13 Hz), ß-band (13-30 Hz), and γ-band (>30Hz). R. Sudirman [4] of the sound frequency 20Hz-20 kHz exposed to the activities of the human brain. Characteristics of EEG signals using the fast Fourier transform (FFT), filter, and categorize the frequency of the sound from the EEG signal. The Daniel Alvarez [5] study used the traditional parameters of the relative frequency spectrum band, where peak amplitude of blood oxygen saturation is used to describe the frequency, and the EEG records information to assess blood oxygen saturation (SaO2). It can provide diagnosis of obstructive sleep apnea (OSA) syndrome information. Shuo Yang [6] used magnetic stimulation of the Shenmen δ-band and α-band of brain waves to place people at ease.
II. THEORIESANDMETHODSS
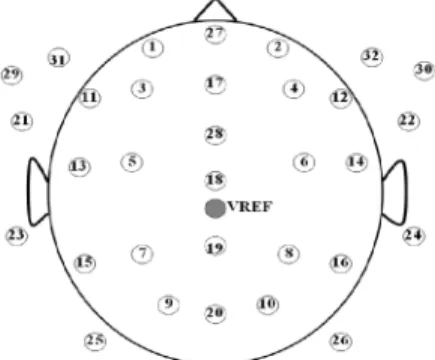
In this study, 32-channel EEG analyzer changes in the scalp to detect brain waves. Brain waves are obtained through Fourier transform, where the brain waves change from the time domain into the frequency domain of the brain wave frequency spectrum, as the frequency of the different can be divided into five basic EEG frequency bands, δ-band, θ-band, α-band, ß-band, and γ-band. This frequency band of the state of the brain uses scalp electrodes to detect point distribution, as shown in Figure 1, for a total of 32 channels. Channel 1- channel 4, channel 27, channel 17, and channel 28 are in the former location of the frontal lobe. Channel 5 channel 8, channel 18, and channel 19 are in the parietal position. Channel 9, channel
Meng-Long Shih
Dept. of Social Studies Education National Taitung University
Taitung, Taiwan, R.O.C.
Mu-Jin Chen
College of Education and RCMBL National Chenchi University
10, channel 20, channel 25, and channel 26, are in the occipital lobe location. Channels 11, channel 13, and channel 15, are in the left temporal lobe. Channel 12, channel 14, and channel 16 are in the right temporal lobe. Channel 21, channel 29, channel 31, and were in the left face. Channel 22, channel 30, and channel 32 are in the right side of face. Channel 23 is in the left ear and channel 24 is in the right ear. Operation of the first 32-channel sensor net is worn on the subjects head. Then the sensor net and amplifier are connected to amplify the signal and convert analog signals to digital signals. Finally, the computer captures and analyses the signals. The EEG signals from 32 channels measuring the relative positions of the Sensor Net are as shown in Figure 1. Brain wave measurement apparatus uses the Electrical Geodesics, Inc (EGI) model GES 140 for measurements of signal sampling rate per channel per second for 250 sample selection points. The impedance of each channel is controlled 80KΩ below normal in general use between about 0 -5KΩ, with a notch filter of 60 Hz, for male subjects between the ages of 21 and 23 with normal physical conditions. Subjects were tested a total of 20 times, and 11 after the energy larger smaller energy 7 2 did not change, the subject of energy by touching crystals in Figure 2. In the experiments, in order to avoid the noise impact of blinking subjects, for the measurement period subjects were instructed to close their eyes, and repeat the psychological and silent count from 1 to 10 for a total of 6 times in order to record 60 seconds. Comparative experiment 2 state, the first state to the hand did not touch any thing; record the subjects of brain wave for 60 seconds.The second condition has the hand touch the energy crystal, and recorded the subject’s brain waves for 60 seconds, by testing the energy crystal in Figure 2.
Figure 1. Measuring 32-channel EEG sensor net network configuration diagram.
Figure 2. The energy field is to find a energy crystal.
Measured amplitude of brain waves was in the ± 200μV sector. Finally, brain waves obtained through Figure 2. The energy field is to determine an energy crystal. Fourier transforms the brain waves from the time domain into the frequency domain
the waves in order to clearly see the fundamental frequency brain waves in the five performances under, δ-band, θ-band, α-band, ß-α-band, and γ-band.
III. RESULT
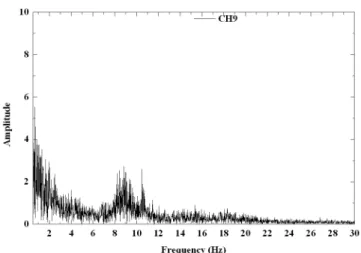
This study used an energy field in order to determine the effects of a crystal as a DUT, and measures the energy transmitted to the human body by the crystal effect. The results are shown in Figure 3 to 6, where the energy in the body, without touching the crystal, measure brain waves before the 32-channel effects, Figure 7 to 10 show the energy of the crystal in the body after touching a 32-channel EEG measurement results. This result is the measured amplitude of brain waves in the ± 200μV sector. After Fourier transform, 32 channels of EEG from the time domain into the frequency domain of the brain wave frequency spectrum. Map analysis of the horizontal axis is more common in the 0-30Hz frequency range. Vertical axis is the result of Fourier amplitude of the converted results. It can be seen in Figure 3, that Channel 1 - Channel 8 did not touch the crystal energy bands for the main reactions in the EEG δ wave (1-4 Hz) and α (8-12 Hz) wave. Figure 4 and 5 EEG reaction zones were also in the δ waves (1-4 Hz) and α (8-12 Hz) waves, but compared to Figure 1 and 6, have greater amplitude. Figure 7 - 10 are the result of post-stroke power crystal. Figure 7 and Figure 3 show a comparison of channels CH1-CH8 δ, where touching the wave of energy crystals (1-4 Hz) changed significantly. Figure 8 compared with Figure 4, in addition to the channel CH9-CH16 δ waves, (1-4 Hz) have changed significantly. Channel CH9 and CH10 in the α (8-12 Hz) waves also show significant changes. Remaining in the Figure 9 - Figure 10 is δ wave (1-4 Hz) changed significantly List of all channels, in addition to Figure 6 and Figure 10 changes the channel CH27 less obvious, the remaining channels in the body are made after touching power crystal δ wave (1-4 Hz) and α (8-12 Hz) wave significantly enhanced. The map is the more common horizontal axis of the frequency range of 0-30Hz. In addition, the changes in channel CH27 are less obvious, while the remaining channels in the body after touching crystals are made of energy waves δ and α wave are increased significantly. In order to more clearly distinguish the effects of energy crystals, especially out of Channel 9, Figure 11 and 12. show clearly the brain wave frequency spectrum in Figure 11 is not touching the energy crystal, while Figure 12 is touching the crystal energy after the stroke can be seen from the chart after the δ wave energy crystal and α significantly increased the energy thus confirm the effectiveness of crystal. During the experiment, male subjects a were aged between 21 to 23, with normal physical conditions, for total number of 20 subjects. Subjects after the 11 energy larger smaller 7, 2 did not change the effectiveness of crystal can be seen the energy impact of 18 to 20 people; while 18 of these people affected was smaller larger energy, just as with a drug's physical condition because of personal characteristics have different effects.
Figure 3. Does not touch the energy of crystal in the channel before the channel 1 to 8 brain wave frequency spectrum.
Figure 4. Does not touch the energy of crystal in channel 9 to channel 16 before the brain wave frequency spectrum.
Figure 5. Does not touch the energy of crystal before channel 17 to channel 24, the brain wave frequency spectrum.
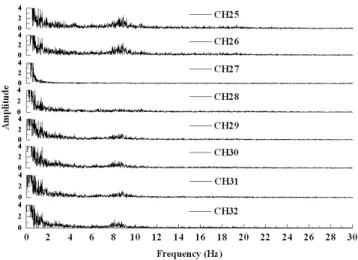
Figure 6. Does not touch the energy of crystal in the channel before the channel 25 to the 32 brain wave frequency spectrum.
Figure 7. Touch upon the energy crystal channel 1 to channel 8 in the brain wave frequency spectrum.
Figure 8. Touch upon the energy crystal channel 9 to channel 16 in the brain wave frequency spectrum.
Figure 9. Touch upon the energy crystal channel 17 to channel 24 in the brain wave frequency spectrum.
Figure 10. Touch upon the energy crystal channel in the channel 25 to 32 of brain wave frequency spectrum.
Figure 11. Does not touch the energy of crystal in the channel 9, before the brain wave frequency spectrum.
Figure 12. Touch crystal energy channel 9 after the brain wave frequency spectrum.
IV. CONCLUTION
This study used energy fields to find a crystal as the DUT, and measures the effects of the energy transmitted to the human body through the crystal. Brain waves obtained through Fourier transform the brain waves from the time domain into the frequency domain of the brain wave frequency spectrum. Comparison of the effects of energy crystal can be seen from the Figures, after touching crystal δ wave energy and α significantly enhanced wave. As the energy of the impact of crystal on the human body is in addition to the individual's physical condition, the course of the study also found that there are different energy crystal types. Future studies of different types of energy will continue for another crystal on these people.
ACKNOWLEDGMENT (HEADING 5)
This work was supported by NSC research grant 99-2622-E-235-001-CC2.
REFERENCES
[1] Fikri Goksu, Nuri Firat Ince, Vijay Aditya Tadipatri, and Ahmed H. Tewfik, “ Classification of EEG with Structural Feature Dictionaries in a Brain Computer Interface,” 30th Annual International Conference of IEEE EMBS pp.1001-1004, August 20-25, 2008.
[2] Hassan Sharabaty, Jordi Martin, Bruno Jammes, and Daniel Esteve, “Alpha and Theta Wave Localisation using Hilbert-Huang Transform: Empirical Study of the Accuracy,” 2006 International Conference on Information & Communication Technologies: From Theory to Applications pp.1159-1164,April 24-28, 2006.
[3] N.A. Salleh, K.S. Lim, and F. Ibrahim, “AR modeling as EEG spectral analysis on prostration,” 2009 International Conference for TECHPOS pp. 1-4, Kuala Lumpur, December 14-15, 2009.
[4] R. Sudirman, A. K. Chee, and W. B. Daud, “Modeling of EEG Signal Sound Frequency Characteristic Using Time Frequency Analysis,” Fourth Asia International Conference on Mathematical/Analytical Modeling and Computer Simulation. pp.221-226, May 26-28, 2010.
[5] Daniel Alvarez, Roberto Hornero, J. Victor Marcos, Felix del Campo, and Miguel Lopez, “Spectral analysis of electroencephalogram and oximetric signals in obstructive sleep apnea diagnosis,” 31th Annual International Conference of IEEE EMBS, pp.400-403, September 3-6, 2009.
[6] Shuo Yang, Guizhi Xu, Lei Wang, Yaohua Geng, Xiu Zhang, Qingxin Yang, and Weili Yan. 2007. “Effect of Magnetic Stimulation at SHENMEN Point on the Electroencephalogram,” 2007 Joint Meeting of
![TraditionalMLCalgorithmsmainlytacklethebatchMLCproblem,wheretheinputdataarepresentedinabatch[24,28].Nevertheless,inmanyMLCapplicationssuchase-mailcategorization[22],multi-labelexamplesarriveasastream.Onlineanalysisistherefore dimensionreducermotivatedbyma](data:image/gif;base64,R0lGODlhAQABAIAAAP///wAAACH5BAEAAAAALAAAAAABAAEAAAICRAEAOw==)