Pergamon
Inr. J. Hrur Mass Trons/er. Vol. 38, No. 9. pp. 1661 1674, 1995 Copyright i: 1995 Elsewer Science Ltd Prmted III Great Bntam. All rights reserved 0017 Y3lOf95 $9 50+0.00
0017-9310(94)00289-4
Vortex flow and thermal characteristics
in
mixed convection
of air in a horizontal
rectangu)lar
duct: effects of the Reynolds and Grashof
numbers
C. C. HUANG and T. F. LINt
Department of Mechanical Engineering, National Chiao Tung University, Hsinchu. Taiwan. Republic of China
(Received 1 February 1994 and in,final form 10 August 1994)
Abstract-A three-dimensional unsteady numerical simulation was carried out to study the effects of Reynolds and Grashof numbers on the vortex flow structure and thermal characteristics in a buoyancy- induced time periodic mixed convective air flow through a bottom heated horizontal rectangular duct. The unsteady Navier-Stokes equations along with the continuity and energy equations were integrated by the Projection method with the convective and diffusive terms discretized by higher order finite difference schemes. Results for the Reynolds number varied from 1000 to 200 at a fixed Grashof number clearly show the splitting and merging of the longitudinal rolls. The flow destabilizes during the processes of roll merging and splitting. After the merging and splitting the flow gradually stabilizes as it moves downstream. For the Reynolds number at 100, stable thermal stratification appears in the upper half of the duct and the flow
oscillation is significantly suppressed there.
1. INTRODUCTION
Forced convective heat transfer in ducts can be sig-
nificantly modified by the buoyancy force when it is
large compared with the inertia force. The degree of modification is determined by the values of the domi-
nated parameters, namely, the Grashof, Reynolds and
Prandtl numbers and duct geometry. Detailed under-
standing of this modification is important in many
technological processes, such as cooling of micro-
electronic equipment, growth of single crystal from
fluid phase, collection of solar energy, and many
others. To unravel the complex mixed convective flow
at a high buoyancy-to-inertia ratio, we numerically
simulated the flow by performing unsteady and three- dimensional computation [ 11. The results clearly show
the buoyancy-induced transition from steady laminar
to time periodic laminar, then to quasiperiodic tran- sitional, and finally to weakly chaotic turbulent flow
at increasing Grashof number for air flow through a
bottom-heated horizontal rectangular duct with the
Reynolds number fixed at 500. In a continuing effort, the present study intends to investigate the effects of
the Reynolds and Grashof numbers on the flow and
thermal characteristics. In what follows the literature
t Author to whom correspondence should be addressed.
on the mixed convective flow in a horizontal rec-
tangular duct is briefly reviewed. A detailed review is available in a previous study [ 11.
Because of the limited availability of the com-
putation facility to calculate the complex three-dimen-
sional unsteady vortex flow considered here, most
early studies [24] relied on experimental measure-
ments to deduce the flow and thermal characteristics. Other studies [5, 61 used linear stability theory to predict the critical Rayleigh number for the onset of
vortex flow. Besides, a numerical solution was
attempted by Incropera and his colleagues [7, 81 for
steady vortex flow. The above studies primarily
focused on the large aspect ratio duct (A > IO) in order to simulate the flow in a plane channel. In spite of these studies the detailed processes on the for- mation of the vortex flow and the merge and splitting of the longitudinal vortex rolls are still poorly under- stood, especially for a finite aspect ratio duct in which the presence of the side walls can greatly change the vortex Row structure.
Considered in the present study is a mixed con-
vective air flow in a bottom heated horizontal rec-
tangular duct which is thermally well insulated, as
schematically shown in Fig. 1. Initially, at time t < 0 the flow in the entire duct is fully developed and iso- thermal at T,. At time t = 0 a uniform heat flux q: is
suddenly imposed on the bottom wall over a finite
1662 C. C. HUANG and T. F. LIN
NOMENCLATURE
A aspect ratio, b/d .Y.J. z Cartesian coordinates
b, d width and height of the duct X, Y. Z dimensionless Cartesian
g gravitational acceleration coordinates, s/d, y,ld and z/d
Gr modified Grashof number, Z’ modified Z coordinate, Z/( Rr Pr)
g/Yy:d4/kv’
h local convection heat transfer
coefficient
k thermal conductivity
1, L dimensional and dimensionless length
of the heated plate, I/d
NU Nusselt number, hdjk
P, pm dimensionless and dimensional dynamic pressures, p,/pw:
Pr Prandtl number, V/E
Y’: wall heat flux
Rr Reynolds number, wed/v
I, T dimensional and dimensionless time, tl(d/M’J
r, 0 dimensional and dimensionless
temperatures, (T- T,)/(qLd/k)
u, 21, w velocity components in X, y, 2 directions.
U, V, W dimensionless velocity components
in X, Y, Z directions, u/w,, V/W~ and W/W,
Greek symbols ;
thermal diffusivity
thermal expansion coefficient
v kinematic viscosity
P density.
Subscripts
e values at the duct inlet
fd fully developed P period W of wall qualities. Superscripts - average value * provisional value
11 value at the nth time step.
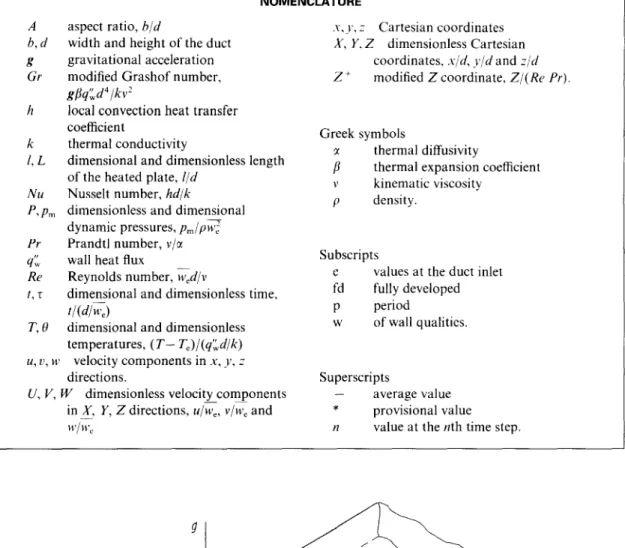
Fig. 1. Schematic of the physical system and the detection points at a cross-section. The X and Ycoordinates at various points are as follows : l-(2,0.08) ; 2-(2.0.5) ; 3--(2,0.92) ; 4-(0.96,0,08) ; 5---(0.96,0.5) :
6-(0.96,0.92); 7-(0.32.0.08); 8--(0.32,0.92).
length I. This heat input produces upward buoyancy and Grashof numbers on the evolution of the vortex
which is normal to the forced flow direction and hence flow structure and associated heat transfer at high
can result in complex vortex flow structure. This study Grashof numbers, so that the flow does not reach
Vortex flow and thermal characteristics 1663 2. MATHEMATICAL FORMULATION AND
SOLUTION METHOD 2.1. Mathematical formulation
Basic nondimensional equations describing the time evolution of a three-dimensional mixed convective flow of a Boussinesq fluid in a bottom-heated hori- zontal rectangular duct are
au av
aw
x+Fy+z=O
(1)
~,~+“g+v~;+w!$
-g
1 a2u
a2u
a2u+z z+s+=
[
I
(2)
^
~~~+~;;+vg+w~~
-gy
+& g+z+g +ge (3) [ I C’W ,+U;;+V;$+w>;= -!f az I a2wa*w
+Rp ~+~+jgT
F
a2w1
(4) 68 i?e deae
i ~-+“~+V~+W~Z&Pr irta28 ale a28 ’ [ -+*+s ax* 1 (5) subject to the following initial and boundary con- ditions :
at r=O or Z=O u=v=e=o
w= w,, = (533~~-(,2Y-I,)“~,
where the values of m, and m, depend on the aspect ratio [9], for 7 > 0.
at z=2L g=g=g=g=o (7)
at Y=O and O<Z<L
~Y+l=U=v=w=o (8)
at all other surfaces
ae
an=U= I/= w=o (9) where n is a unit normal to a surface. The above equations are in terms of the following non- dimensional variables : A’= .x-/d Y = y/d Z = z/d Re =xd/v Pr = v/cl Gr =T V e = ~ CT- Tel A=b/d 7=--- t ~dLd/k) (d/w,) p=&. P4 (10)Note that in the above formulation an insulated sec- tion of length I is added to the exit end of the heated section to facilitate the prescription of the out-flow boundary conditions in the present elliptic flow analy- sis. This added section must be long enough so that the specified downstream boundary condition, equa- tion (7) is suitable. Care is always taken in the solu- tion process to examine whether this added length is long enough or not.
The local Nusselt number on the heated plate measuring the convective heat transfer from the plate to the flow in the duct is defined as
Nu=E= 4: d ’
___=_
k T,-T, k 0,’ (11)
The spanwise averaged Nusselt number is defined as
o
(TN -
7;)kdX
(12)
where A is the aspect ratio.2.2. Solution method
The time-dependent three-dimensional governing equations were solved numerically by the Projection method [IO] on a staggered grid system. This frac- tional step method, which was also used in the pre- vious study [1], consists of two steps. First, the press- ure gradient is ignored and a provisional velocity field is predicted by the simple explicit method [I I]. Second, the provisional velocity is corrected by includ- ing the pressure effect and enforcing the mass con- servation. The resulting pressure Poisson equation was solved by a vectorized SOR method. The energy equation was also solved by the simple explicit method. To ensure the converged solution, the CFL condition that the Courant number must be less than unity was imposed in selecting the time step size. In the spatial discretization the convective and diffusive terms were respectively approximated by the third- order upwind and fourth-order central difierence schemes. These higher order schemes can produce stable and accurate results. In the grid distribution 41-61 nodes were placed uniformly in each coordinate direction. Computations were started from the begin- ning of the transient to the final steady state or to the statistical state when the flow does not reach steady state at large r.
Stringent program tests were carried out in the pre- vious study [I] to verify the proposed solution
1664 C. C. HUANG and T. F. LIN
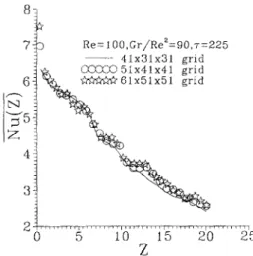
Re=100.Cr/Re2=90.~=225 _-- 41~31x31 gnd CEZC 51x41~41 grid fkiX~%Y 61x51~51 grid
Fig. 2. Comparison of the spanwise averaged Nusselt number at the same time from various grids for Pr = 0.7, Re = 100.
Gr/Re’ = 90, A = 4 and L = 20.
method. Good agreement between the present pre-
dictions and published results in the literature was
shown by comparing our predictions with the analytic and/or numerical results for the limiting case of pure
forced convection and the experimental data for the
steady mixed convective vortex flow in a horizontal
flat duct [3, 41. To further validate the solution
method, grid independence tests were conducted here.
Figure 2 shows the sample results for the spanwise
averaged Nusselt number for a typical case with a
time-periodic flow induced in the duct for Re = 100
and Gr/Re’ = 90 from such tests. Good agreement is
found for the predictions from various grid densities.
More details on the solution method are available
from the previous study [I].
It is important to ensure the predicted flow oscil-
lation does not result from numerical instability.
When an oscillatory flow appears in the computation
for a given set of parameters, the Reynolds number
was raised by a certain amount and the computation is continued. The results indicate that the vortex flow gradually becomes steady for a large rise in Re. Thus the predicted oscillatory flow is due to physical insta- bility instead of numerical artifacts.
3. RESULTS AND DISCUSSION
In the present numerical simulation the Reynolds
number was first systematically varied over wide
ranges so that the flow of air (Pr = 0.72) changes from a steady laminar state to a turbulent chaotic state at fixed Grashof numbers, duct aspect ratio (A = 4) and heated section length (L = 20). Besides, the Grashof number was also varied over wide ranges at Re = 100, again for A = 4 and L = 20. Only a small sample of results will be presented here to mainly delineate the
effects of the Reynolds and Grashof numbers on the
vortex flow structure and associated heat transfer
characteristics.
Results for Gr fixed at 2.5 x IO6 and Re reduced
from 1000 are presented first. The results indicate that. for 700 < Re < 1000, steady vortex flow in the form of longitudinal rolls prevails after the initial transient
in the downstream portion of the heated section.
When Re is reduced to 600, temporal flow oscillation is seen near the duct exit at large t. Reducing the
Reynolds number further causes the oscillatory flow
to be prevalent over a larger downstream region in
the heated section.
Continuing reduction of Re to 500 and 400 results
in some unusual flow characteristics which deserve
special attention. To illustrate these special flow
characteristics, Fig. 3(a)-(d) shows the time histories of the temperature H and axial velocity W at large 5 at eight detection points, specified in Fig. I at four selected cross-sections. Note that the flow oscillates period- ically with single fundamental frequencyf’ ( = 117~ = 0.14) in the entire duct. where tp is the nondimen- sional period of the oscillations. But the amplitude
of the oscillation shows nonmonotonic variation
with the axial distance. This defies the general
conception that the flow gradually becomes dis-
ordered when travelling downstream. Specifically, at
locations 1, 2 ’ dnd 3 near the central vertical plane at X = A,‘2, the flow is steady in the duct. Near the side walls (locations 7 and 8), large oscillation is induced in the entry region [Fig. 3(a) and (b)] and decays significantly for Z > 7.1. In regions away from the central plane and side walls the oscillation increases with the axial distance for Z < 7.1. Downstream of it
the oscillation decays. The consequence of this
unusual decay in the flow oscillation can be attributed
to the unusual axial flow development displayed in
Fig. 4, in which. due to the flow being symmetric with respect to the central vertical plane, the isotherms in the left half and the streamlines of the secondary flow in the right half of the duct are plotted together at selected cross-sections at selected time instants in a typical period. These results clearly show that four pairs of vortex rolls in the entry region gradually
merge into two pairs at Z 2 6.0. Comparing the
results in Fig. 4 with those in Fig. 3 suggests that.
during the process of the cell merging, the flow is
destablized with amplifying oscillation, especially at
the cell interfaces (locations 4-6). After the cell merges the flow gradually stablizes, as is evident from the periodic flow patterns in Fig. 4. It is of interest to mention that the change of the flow pattern with time is rather small after the cell merges (Z > 6.0).
At an even lower Reynolds number, more structural changes in the vortex flow appear. The periodic flow
patterns for Re = 200 are demonstrated in Fig. 5.
Note that two pairs of longitudinal rolls occupy nearly the entire heated section of the duct, except in the exit region where the roll splitting takes place and two new pairs of rolls become visible. This roll splitting then
destablizes the flow. The time records of W and (1
given in Fig. 6 show that the flow in the entry region oscillates periodically at a frequency of 0.267 in a
(1
e
(4
C
()
04
(
>
a
‘G
6+0.25T,
T+O.5T,
T+O.75-c,
Fig. 4. Periodic flow patterns at a large T for GriRc ’ = 15.625 and Re = 400 at : (a) Z = I .29 ; (b) Z = 3.87 ; (c) Z = 6.45 ; (d) Z = 9.03 : and (e) Z = 14.19. The period of the oscillation is about 7.153.Q:.27(.02).48k-.
16(.03).178:.27(.02).48\k:-.15(.03).170:.28(.02).47\k:-.14(.03).170
(e)
8(4
0
(4
8
(b)
:.28(.02).47\k:-.
11(.03~.17&.28(.02),48'+,11(.03).17
. , . _ . r . I \ , . ,T+O.25T:,,
T+O.57;,
T+0.75Tp
Fig. 5. Periodic flow patterns at a large T for Gr/Re ’ = 62.5 and Re = 200 at : (a) 2 = 1.29 ; (b) Z = 6.45 ; (c) Z = 11.61 ; (d) Z = 14.19; and (e) Z = 16.77. The period of the oscillation is about 3.7453.C. C. HUANG and 1 F. LIN
7 7 l- -r I- -i-
(4
(b)
(cl
Fig. 6. Time samples for Wand 0 at eight detection points for Re = 200. Gr/Re’ = 62.5 at : (a) Z = 3.23 : (b) Z = 10.97 ; (c) Z = 18.70.
oscillation amplitude decays somewhat, but some
nonperiodic components are observed [Fig. 6(b)].
Near the duct exit the oscillation intensifies drastically
and becomes chaotic [Fig. 6(c)] because of the roll
splitting. As Re is further lowered to 100, the flow
becomes highly unstable and fluctuates violently,
except near the duct inlet. Hence we failed to obtain a converged solution.
It is of interest to point out that the buoyancy-
induced unsteady mixed convective vortex flow at low
Reynolds numbers possesses some other unique
characteristics. To explore these characteristics, a series
of computations was conducted for Re fixed at 100
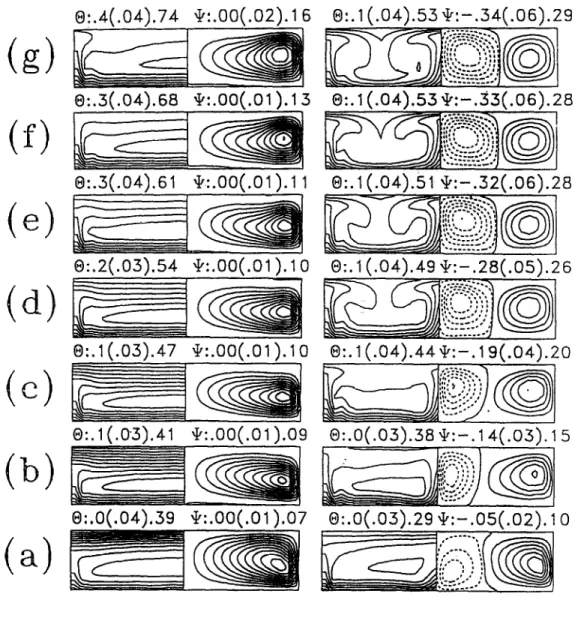
and Gr gradually raised. The results from these com- putations indicate that the flow finally attains steady state for Gr/Re’ < 40 or Gr < 4.0 x 10⁵. Figure 7 shows that, at a very low buoyancy (GrlRe’ < 15 or Gr < I .5 x IO’), there is a single pair of buoyancy- driven longitudinal rolls occupying the entire duct at steady state. Thus, the roll size is about twice in the spanwise dimension as that in the vertical direction. When the buoyancy is slightly raised to the range of
Gr/Re’ between 20 and 40, two pairs of longitudinal rolls are induced at steady state. The wavelength of the rolls is about 2d. As Gr/Re’ is raised to 50, flow starts to oscillate periodically in the region near the
duct exit (Z 3 14.84), but there are still only two pairs of vortices in the duct, like those observed at lower
buoyancy. For a higher GriRe’ the flow oscillation
appears in the region close to the duct inlet, and the region in which steady flow prevails is smaller and
hence confined to the duct entry. For instance the
results for Gr/Re’ = 90 are shown in Figs, 8 and 9. The periodic vortex flow patterns in Fig. 8 suggest that, in the region for Z between 1.5 and 10.0. the rolls split over a certain interval of time in a period.
but they merge later in another interval of time.
Furthermore, at a given time instant the cells may
split near the duct inlet and merge downstream. This complicated temporal and spatial variation in the vor- tex flow structure causes the flow to be highly fluc- tuating, as is evident from the time histories of Wand 0 in Fig. 9. A power spectrum density analysis of the data in Fig. 9 indicates that the flow in the entire duct oscillates at a single fundamental frequency,/; = 0.093 and the oscillations at various locations can be charac-
terized by this frequency and its harmonics, Com-
paring the oscillation amplitudes in Fig. 9(a)-(c)
shows that the oscillation amplifies in the first half of the duct (3.23 d Z < 10.97), but decays in the sec- ondary half (Z > 11.0). It is worth mentioning from the results in Fig. 9(a) and (b) that the flow is nearly
Vortex flow and thermal characteristics 1669
0:.4(.04).74 \k:.OO(.O2).16
0:.3(.04).68 \k:.OO(.O1).13
0:.1(.04).53%--,?i3(.06).280:.3(.04).61 \k:.OO(.Ol).l
1
0:.2(.03).54 +:.OO(.Ol).lO
0:.1(.04).53k-.34(.06).29
0:.1(.04).%1 k-.32(.06).28
. I \ I@:.1(.04).49k-.28(.05).26
0:.0(.03).38k-.14(.03).15
Gr/Re*=lS
Gr/Re*=20
Fig. 7. Steady flow patterns at selected cross-sections for Re = 100, Gr/Re* = 15 and 20 at : (a) Z = I .29 :
(b) 2 = 3.87; (c) Z = 6.45; (d) Z = 9.03; (e) Z = 11.61 ; (f) Z = 14.19; (g) Z = 16.77.
steady at locations 3, 6 and 8 in the region adjacent to the duct top. This is conjectured to result from the stable thermal stratification in this region, as is evident from the isotherms in Fig. 8. This stable stratification also confines the cell motion in the lower half of the
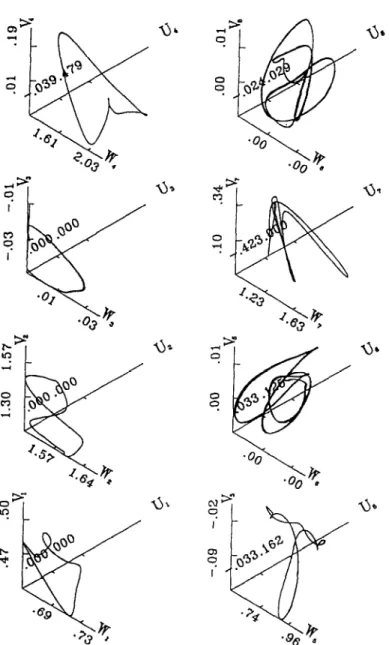
duct. To further elucidate the complicated flow
motion, the phase space trajectories which relate the
motion of three velocity components U, V and W at
large T are plotted in Fig. 10 for the eight detection points at 2 = 10.97. At each location a limiting cycle (repeated curves) results, reflecting the flow at this
location being completely periodic. These curves
clearly show that the relative motion of U, V and W
driven by the vertical buoyancy is rather complex,
especially at locations 5-8.
Results for the distributions of the bottom plate
temperature and local Nusselt number, which are of
value to thermal design, are given in Fig. 11 at selected time instants for the three selected cases discussed
above. The results obviously reflect the buoyancy-
induced vortex roll structures. Note that the time vari- ation of Nu with time is much smaller than that of velocity and temperature, due to the fact that Nu is an integral property of the flow.
Finally, the condition for the onset of the Hopf
(
>
e
cd)
C(
>
(b)
a
(
>
'&.4(.02).63\k:-.18(.03).1
1
8:.2(.03).52+:-.12(.02).1
5
0:.4~.02~.64k-.22(.03).1
1
@:.4(.02).63k-.18(.031.14
1
2
0
5
8:.2(.03).52+:-.13(.031.20
. _7;
'G+o.2571,,
z:+OST:,,
7;+0.75Tp
Fig. 8. Periodic flow patterns at a large 7 for Cir;Rc~' = 90 and RP = 100 at: (a) Z = 1.29; (b) Z = 3.87; (c) % = 6.45: (d) Z = 9.03: and (e) Z = 14.19. The period of the oscillation is about 12.99.Vortex flow and thermal characteristics 1671
2.4
L
$5 8.4 J.5 L= 2-4 k -1.5 kwvw w z= 0.1 0.0 0.1 0.0 0.1 0.0Fig. 9. Time samples for Wand 0 at eight detection points for Re = 100, Gr/Re2 = 90 at : (a) 2 = 3.23 : (b) Z = 10.97 ; (c) Z = 18.70.
1612 C. C. HUANG and T. F. LIN
Fig. 10. Phase space trajectories of C’, V and W at eight detection points for Re = 100. Gr:Re’ = 90 and z = 10.97.
Vortex flow and thermal characteristics 1673
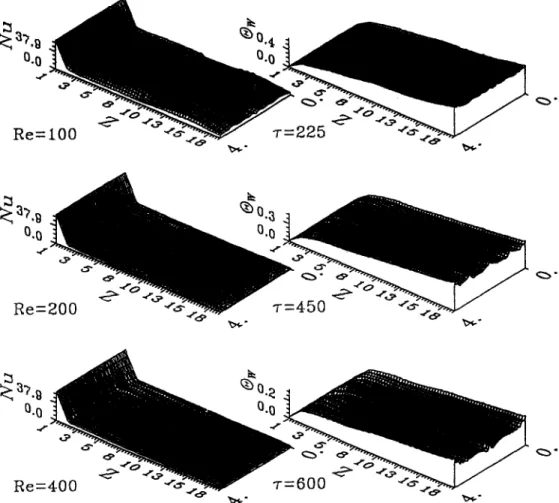
Fig. 11. The local Nusselt number distributions on the heated bottom plate for: (a) Re = 100, Gr!‘Re’ = 90 ; (b) Re = 200, Gr/Re’ = 62.5 ; and (c) Re = 400, Gr/Re’ = 15.625 at large 7.
iodic state deduced from the large amount of the com- puter data, can be correlated as
Ra*(Z+)” I5 = 2.62 x lo5 (13)
where Z’ = Z/(Re Pr).
4. CONCLUDING REMARKS
Through a direct three-dimensional unsteady
numerical simulation, the splitting and merging of the
longitudinal rolls were predicted in a high Grashof
and/or low Reynolds number mixed convective flow
of air in a bottom-heated horizontal rectangular duct.
These complicated structural changes in the vortex
flow have substantial effects on the fluctuating charac- teristics of the flow. Usually, the flow becomes more
unsteady during the processes of roll splitting and
merging. But after the splitting and merging the flow
gradually stabilizes as it moves downstream. At low
Reynolds numbers and high Grashof numbers stable
thermal stratification results in the upper half, which in turn suppresses the roll size and stablizes the flow there.
Finally, it was recognized during the course of this investigation that the change in vortex flow structure
is more severe in a large aspect ratio (wider) channel. since it provides larger lateral space for cells to move. Besides, the effects of duct inclination are expected to be significant. The evolution of vortex flow in mixed convection of water is also important in various appli-
cations. Preliminary computations on these problems
support these statements.
Acknowledgement-The financial support of this study by
the engineering division of Nation Science Council of Taiwan through the contract NSC83-0404-E009-054 is greatly appreciated. The support of the present computation by the National Center for High-performance Computing and by the computer center of the National Chiao Tung University. Taiwan is also acknowledged.
REFERENCES
1. C. C. Huang and T. F. Lin, Buoyancy-induced flow transition in mixed convective flow of air through a bottom-heated horizontal rectangular duct, In/. J. Heat Mass Tramfer 37, 1235-1255 (1994).
2. Y. Kamotani and S. Ostrach, Effect ofthermal instability on thermally developing laminar channel flow. 1. Heat Transfer 98,62-66 ( 1976).
3. K. C. Chiu. J. Ouazzani and F. Rosenberger, Mixed convection between horizontal plates-II. Fully
1674 C. C. HUANG and T. F. LIN
developed flow, Int. J. Heat Mass Tram/k 30, 1655- 1662 (1987).
J. R. Maughan and F. P. Incropera, Regions of heat transfer enhancement for laminar mixed convection in a parallel plate channel, Inc. J. Hear Mass Transfer 33, 555-570 (1990).
G. J. Hwang and K. C. Cheng, Convective instability in the thermal entrance region of a horizontal parallel-plate channel heated from below, J. Heat Transfer 95, 72-77 (1973).
F. S. Lee and G. J. Hwang, Transient analysis on the onset of thermal instability in the thermal entrance region of a horizontal parallel plate channel, J. Hea/
Transfkr 113, 363-370 (1991).
H. V. Mahaney, S. Ramadhyani and F. P. Incropera.
Numerical simulation of three-dimensional mixed con- vection heat transfer from an array ofdiscrete heat sources in a horizontal rectangular duct, Numer. Heat Trunsfiv
A 16,267-286 (1989).
8. J. R. Maughan and F. P. Incropera, Fully developed mixed convection in a horizontal channel heated uni- formly from above and below, Numw. Heat Trausfiv A
17,417-430 (1990).
9. R. K. Shah and A. L. London, Lrrminur FIOw~ Lbrw Convection in Ducfs. pp. 196198. Academic Press, Neu
York (1978).
IO. A. J. Chorin, Numerical solution of the NavierStokes equations. J. Ma/h. Comput. 22, 7422762 (I 968).
I I. R. Peyret and T. D. Taylor, Compufulional tt4tJthod.y /ot