國 立 交 通 大 學
生醫工程研究所
碩 士 論 文
不同型態的地標影響人類
在虛擬實境巡行時腦波的動態反應研究
EEG Activities of Brain Dynamics Related to Spatial Navigation
via Different Landmarks Processing in a Virtual Environment
研 究 生: 張 書 彥
指導教授: 林 進 燈 教授
不同型態的地標影響人類
在虛擬實境巡行時腦波的動態反應研究
EEG Activities of Brain Dynamics Related to Spatial Navigation
via Different Landmarks Processing in a Virtual Environment
研 究 生:張書彥
Student : Shu-Yen Chang
指導教授:林進燈 博士
Advisor : Dr. Chin-Teng Lin
國 立 交 通 大 學
生醫工程研究所
碩 士 論 文
A ThesisSubmitted to Institute of Biomedical Engineering College of Computer Science
National Chiao Tung University in partial Fulfillment of the Requirements
for the Degree of Master
in
Computer Science June 2009
Hsinchu, Taiwan, Republic of China
不同型態的地標影響人類
在虛擬實境巡行時腦波的動態反應研究
學生:張書彥
指導教授:林進燈 博士
國立交通大學
生醫工程研究所
Chinese Abstract中文摘要
在本研究裡,我們建構一個簡單結構的立體虛擬迷宮,用來研究人類空間巡行能 力,人藉由使用不同型態的地標來進行迷宮巡行時。我們只需要考慮不同型態地標的影 響而不用考慮結構的特性所造成的影響。不同型態的地標對空間巡行會有不同的影響, 全域地標扮演有效的指引,受測者在只有區域地標的虛擬環境下花費了多餘的移動路 徑,在行為實驗中,整體趨勢的表現是不斷進步。在腦波反應實驗中,當受測者在迷宮 巡行時,同時紀錄腦波的變化狀況,我們藉由生理訊號(如腦波)以研究地標對空間巡行 所造成的影響。我們研究空間巡行的腦電波圖,藉由獨立成份分析的方法將資料分析成 獨立的腦波訊號源。在個別只有全域和只有區域地標的迷宮裡,發現在受測者進行空間 巡行都會出現θ 頻帶的震盪,在前葉區會有θ 能量的上升。在空間巡行時,我們比較全 域地標和區域地標是否造成對腦波造成差異,使用排列檢定發現全域地標和區域地標在 前葉區的θ 能量變化有顯著性的差異。 關鍵字: 空間巡行, 地標, θ 振盪, 腦波圖, 排列檢定EEG Activities of Brain Dynamics Related to Spatial Navigation
via Different Landmarks Processing in a Virtual Environment
Student : Shu-Yen Chang
Advisor : Dr. Chin-Teng Lin
Institute of Biomedical Engineering Abstract
In this study, we built the 3D virtual environment of simple structure mazes to study the human’s ability of spatial navigation while the human navigated in the virtual mazes by using different typical landmarks. We considered the influence of different typical landmarks without considering the feature of structure. Different typical landmarks affected the performance of navigation. The global landmarks played the role of effective guidance. Subjects wasted more redundant walking paths in the virtual environment of local landmarks. The entire trend of performance presented improvement in the behavioral experiment. In the brain activity experiment, the brain dynamics was recorded while the subjects navigated in the virtual mazes. We researched the effect of landmarks to affect spatial cognitive function by physiological signals, such as brain waves. We investigated electroencephalography (EEG) dynamics in responses to spatial navigation. The EEG channel signals were separated into independent brain sources by using the independent component analysis (ICA). The results showed the theta oscillations which appeared during navigating the maze with the global or the local landmarks. The theta power of the frontal midline showed increase. In addition, the theta power of the frontal midline was presented the significant difference between the global condition and the local condition during spatial navigation by using permutation tests.
誌 謝
Acknowledgement 本論文的完成,首先要感謝指導教授 林進燈教授這兩年來的悉心指導,讓我學習 到許多寶貴的知識,在學業及研究方法上的學習。感謝口試委員們的建議與指教,使得 本論文能夠更完整。 特別感謝國立中央大學認知神經科學研究所 張智宏教授給予我研究上最大的協 助,從實驗設計、實驗分析、實驗結果討論到論文撰寫,給我最專業的意見跟看法。 我也要特別感謝常常跟我一起討論的實驗組員:立偉學長與騰毅學長與盈宏學長與 紹瑋學長,他們給我很多實驗進行的探討,腦波分析結果的討論,感謝他們在做實驗的 部份給予很多協助,讓我對實驗的程序能夠熟悉,在研究上疑難的解答、研究方法、寫 作方式、經驗分享等惠我良多。 最後,我要感謝腦科學研究實驗室的全體成員,沒有他們也就沒有我個人的成就。 感謝立偉、世安、青甫、尚文、德正以及君玲等學長姊;也感謝建安、俞凱、華山、馥 戍、昂穎、睿昕等同學在我碩班兩年間無論是學業上、研究上、或是生活上,都提供我 很多的幫助,大家相互扶持與鼓勵;我也要感謝謹譽、敬婷、佳琳等學弟妹,在過去這 一年中的相伴。感謝伯昰學長以及實驗室助理 Jessica、 Nao、May、與紹瑋、怡然,在 許多事務上的幫忙以及陪伴。 謹以本文獻給我親愛的家人與親友們,以及關心我的師長,願你們共享這份榮耀與 喜悅。Contents
I. Introduction ...1
II. Materials and Mthods ...5
2.1 Implement of the Virtual Environmen...5
2.1.1. Apparatus...7
2.1.2. Program Setup ...10
2.1.2.1. Basic Control ...10
2.1.2.2. Task mode Settings ... 11
2.1.2.3. Input/Output Settings... 11
2.2. Questionaire... 11
2.3. Subjects...12
2.3.1. Behavior Experiment Subjects ...12
2.3.2. EEG Experiment Subjects ...12
2.4. Behavioral Data Analysis ...12
2.4.1. Corrected Travel Distance of Path Ratio Analysis ...12
2.4.2. Analysis of Variance (ANOVA) Analysis...13
2.5. EEG Data Analysis ...14
2.5.1. EEG Data Analysis Procedures ...14
2.5.2. Independent Component Analysis (ICA) ...18
2.5.3. Component Clustering...20
2.5.4. Event Related Spectral Perturbations (ERSP) Analysis ...21
2.5.5. Permutation Tests...22
III. Spatial Navigation in Virtual Environments with Different Types of Landmarks: Behavioral Experiment ...23
3.1. Methods of the Behavioral Experiment...23
3.1.1. Behavioral Environment Setup ...23
3.1.2. Behavioral Experiment Procedures ...24
3.2. Results ...25
3.2.1. Training Trials Associated with Gender and Landmarks ...25
3.2.2. Travel Duration...26
3.2.3. Path Ratio Results...28
3.3. Summary of the Behavioral Experiment ...30
IV. Brain Activity of Spatial Navigation...32
4.1. EEG Experiment Paradigm Design ...32
4.1.1. EEG Environment Setup ...32
4.1.2. EEG Experiment Procedures...34
4.2. Brain Sources of Stimulus Response...36
4.2.1.1 Brain Dynamics in the Frontal Midline...38
4.2.2. EEG Activities in Different Independent Components ...40
4.2.2.1 Independent Component(IC) Clustering and Source Localization...40
4.2.2.2 Frontal Midline Component ...40
4.2.2.3 Parietal Component ...43
4.2.3. Brain Activity of Permutation Tests...44
4.3. Summary of Brain Activity Experiment...44
V. Discussion...46
5.1 Discussion of Behavior Results...46
5.2 Discussion of Brain Activity ...49
VI. Conclusion...52
Reference...53
Figures
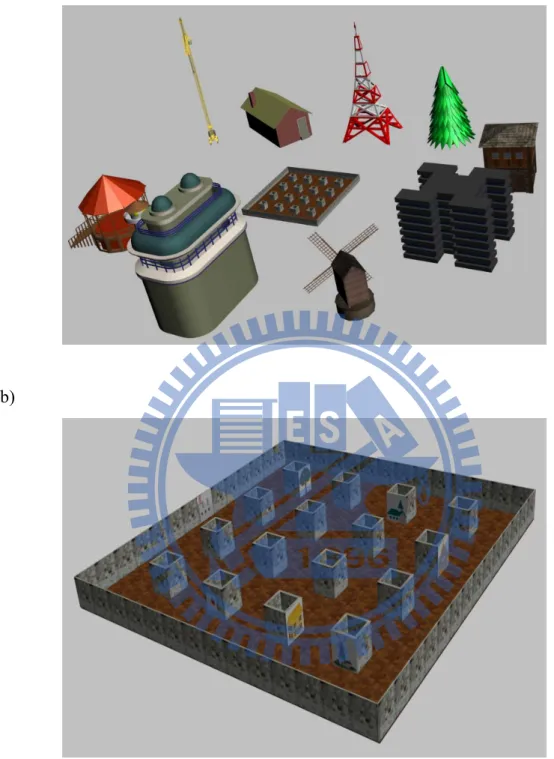
Figure 2-1: 3D model (a)Global (b)Local. ...6
Figure 2-2: (a)、(b)、(c)、(d) Targets were appeared in the virtual environment of global landmarks. (e)、(f)、(g)、(g) Targets were appeared in the virtual environment of local landmarks...7
Figure 2-3: (a) Global landmarks and targets. (b) Local landmarks and targets. (c) The structure of the maze and two typical landmarks in the virtual environment...10
Figure 2-4: The method of calculating the path ...13
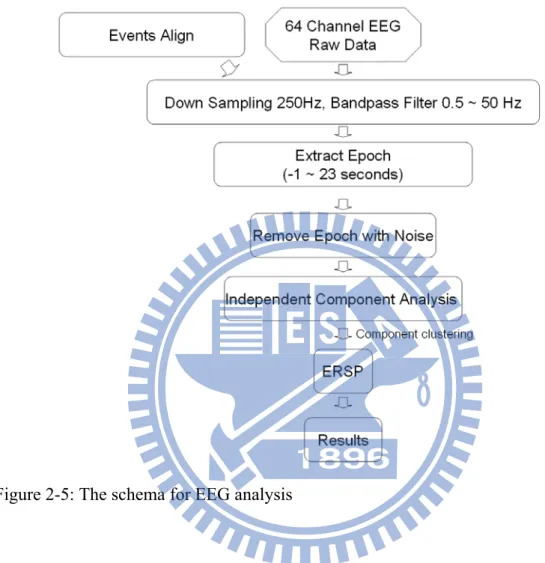
Figure 2-5: The schema for EEG analysis...15
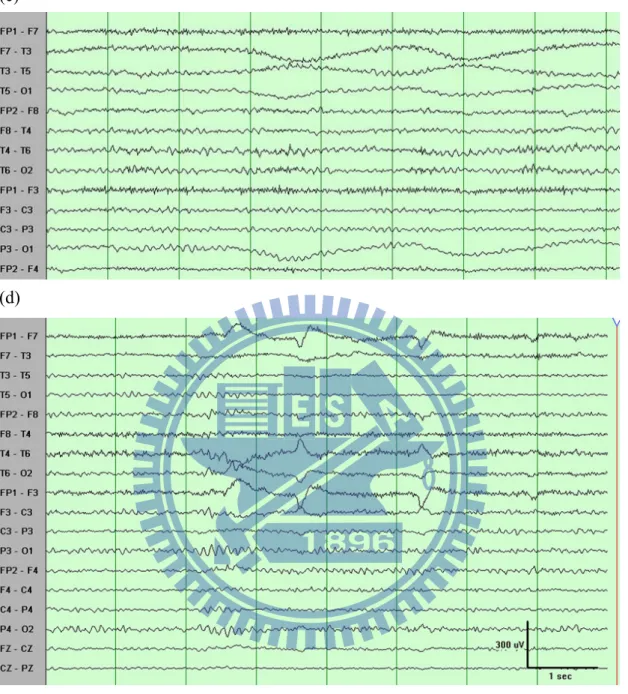
Figure 2-6: Several types of artifacts were existed in the EEG signals...16
Figure 2-7: Schema for Independent Component Analysis (ICA) data decomposition and back-projection [39]. ...19
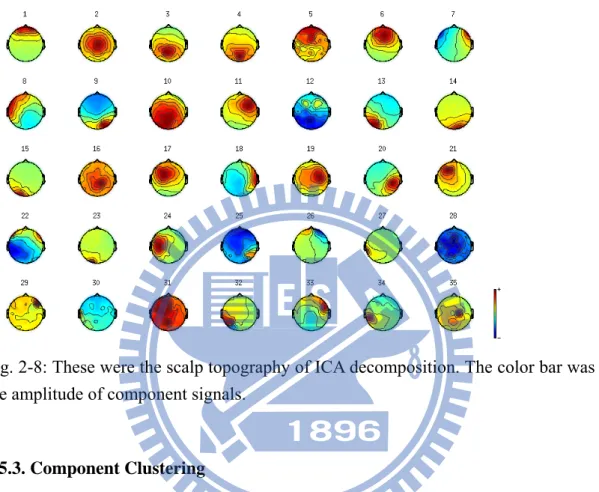
Figure 2-8: These were the scalp topography of ICA decomposition. The color bar was the amplitude of component signals...20
Figure 2-9: The data was processed by using ERSP analysis [44]...21
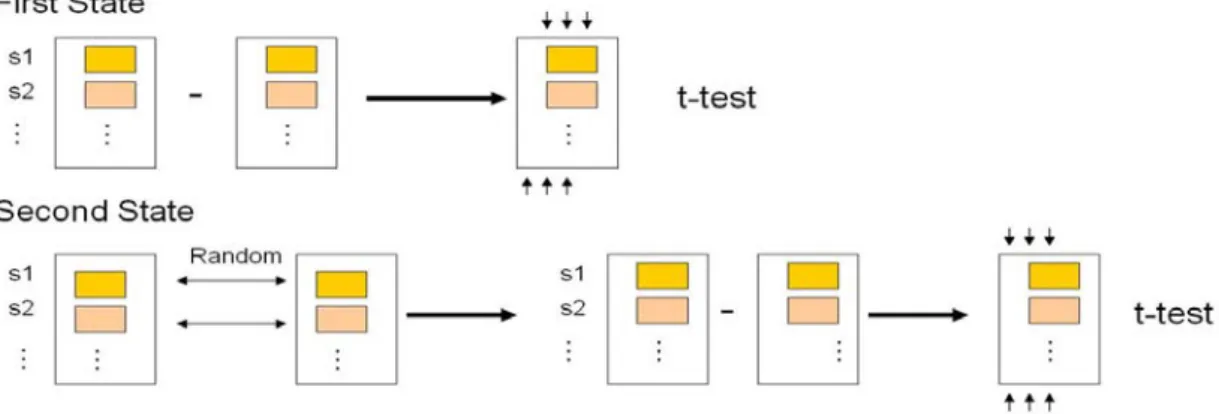
Figure 2-10: The procedure of permutation tests. ...22
Figure 3-1: (a)Experiment environment. (b)Shielding room...23
Figure 3-2: Schema of behavior experiments with different landmarks.. ...25
Figure 3-3: (a) Different landmarks needed different trials to reach 100% success rate.(b) Males and females needed different trials to reach 100% success rate. ...26
Figure 3-4: (a) Subjects wasted time to search the target in the virtual reality environment with different landmarks in each trial. (b) Males and females wasted time to search the target in each trial... ...27
Figure 3-5:(a) Male wasted time to navigate in the mazes with different landmarks. (b)females wasted to navigate in the mazes with different landmarks. Females consumed the less time in the local condition in the whole.. ...28
Figure 3-6: The different path ratio values were between global landmark environments and local landmark environments in each trial...29
Figure 3-7: (a) In the global landmark state, the path ratio was compared with male and female. (b) In the local landmark state, the path ratio was compared with male and female. (c) The global landmark state was compared with the local landmark state for male. (d) The global landmark state was compared with the local landmark state for female... ...30
Figure 4-1: The environment of the EEG experiment...32
Figure 4-2: The photographs showed physiological recording containing the SynAmps RT EEG amplifier and the electrode cap...33
Figure 4-3: The 64 channel EEG system of electrode placement.. ...33
Figure 4-5: Subjects had better performance in global condition than in local condition for each trail ...37 Figure 4-6: The results showed the percentage of the trials.. ...38 Figure 4-7: (a) Path ratio=1 (b) 1≤ Path ratio ≤ 1.5 (c) 1.5 ≤ Path ratio
The theta power continuously increased in both global condition and local
condition.. ...39 Figure 4-8: The results showed the IC clusters of the frontal midline.. ...40 Figure 4-9: (a) Brain activity of theta power increased in frontal midline in the global
condition. (b) Brain activity of theta power increased in frontal midline in the local condition.. ...42 Figure 4-10: (a) Brain activity of power decreased in the parietal in the global condition.
(b)Brain activity of power decreased in the parietal the in the local condition...43 Figure 4-11: The results of permutation tests indicated the significant differences in the gray
block. Brain activity of theta power increased and had significant differences in the frontal midline... ...44 Figure 5-1: Time course of information processing in different layers...50
Table
I. Introduction
To establish a reference system for representing spatial information was dependent on specific characteristics of the learning situation [1]. The direction was the crucial mechanism for higher-level memories of space [2]-[3]. Human possessed the cognitive ability to engage in spatial navigation and to generate mental maps of the environment. The spatial cognitive performance was decided by accessing the information of features, such as environment structure and objects. Human would promote their performance, when they performed several empirical navigations.
Siegel and White (1975) defined the landmarks of distinctive features that allowed them to be more easily remembered. In previous study, some of the subjects used only local landmarks while others relied exclusively on global landmarks. Other subjects used local landmarks at one location and global landmarks at the other location [4]. Gillner and Mallot manipulated the positions of landmarks following training showed that the navigation performances were the poorest when the new positions of the landmarks offered conflicting action choices [5]. Human might adopted several strategies according to their habits to navigate in the virtual environment. Their movements might be associated with landmarks.
The transfer of knowledge obtained in a virtual environment to the real world had been studied [6]. Subject sufficiently exposed to the virtual training environment. The virtual environment training eventually would surpass real-world training [7]. There were structural landmarks and objective landmarks in the real world. We built the 3D virtual environment to simulate the real world. We adopted the simple structure, like as checkerboard lattice, to construct the virtual environment. This design could avoid the influence of the structural features and then we could not consider the influence of the structure during navigating in the maze.
In this study, we focused on the influence which was caused from single type landmarks, for example the global landmarks or the local landmarks. When subjects navigated in the virtual maze, only single typical landmarks were referred in the virtual maze. There were many walking paths in the simple structure and subjects might not always choose the specific walking path. There was no effect about router navigation experience because the starting position was randomly decided by program. Subjects would use landmarks to navigate and then subjects could be familiar with the virtual environments by landmarks. Two types of landmarks were designed to ensure that each of them could be only dealt with as global or local landmarks. We would observe the affection that caused from different types of the landmarks. The global landmarks surrounded outside in the maze. In another maze, the local landmarks existed inside the maze on the wall. Subjects made decisions about the direction to move based on the relative location of the target. The landmarks provided the help and the guidance for subjects. The landmarks could be regarded as spatial cues that were associated with the relative location of the target. The landmarks played a role as mental reference points of spatial navigation. Subjects could build spatial memory of the relative relationships between the landmarks and the target. Subjects relied on a set of neighbor landmarks to determine the target’s location in the global landmarks but subjects relied on a sequence of intermediate local landmarks to navigate in the virtual environment. Subjects would recognize their location by the landmarks around themselves during navigating. Behavior experiment aimed to investigate the different types of the landmarks that affected the performance of subjects’ spatial navigation.
Brain activity related to the landmark information obtained from virtual environments [8]. Human could use the spatial memory to cognize the environment by recalling the landmarks and spatial relationships [9]. Participants were sensitive to the information content of landmarks and they would allocate memory resources form
the information of the landmarks [10].The cortical theta (4 – 8 Hz [11]) oscillations had been observed during the variety of learning tasks, including recognition [12] and recall [13]. The frequency of theta-wave episodes occurred more frequently in the complex mazes [14].The frequency of theta was more frequent in recall trials than in learning trials in the complex mazes [15]. Human cortical theta oscillations acted to coordinate sensory and motor brain activity in various brain regions to facilitate exploratory learning and navigational planning [16]. Many researchers had observed theta oscillations during cognitive tasks [17]-[22]. The scalp electroencephalogram (EEG) was recorded from 64 channels during human virtual maze navigation. The theta oscillation was usually localized at two regions which were the fontal region, possibly associated with spatial working memory, and the parietal-temporal region [23]. Neuroimaging studies suggested the role of the theta oscillations that was were associated with spatial navigation and wayfinding tasks [24]-[28]. The theta band in the scalp in the frontal midline was often present during working memory [29]. Brain activity was recorded when subjects navigated the virtual mazes by using landmarks. We would observe the variation of brain activities and then we would see if different landmarks caused the different responses of brain dynamics. When the target was appeared, subjects would recall the relative location of the target by loading working memory and subjects would consult the landmarks to search the target. The theta power might increase in the frontal midline during navigating.
The different difficulty was closely related to the type of visual cues, such as landmarks, hall way structure, or location information. In previous study, landmark information and optic flow information significantly reduced the navigating time in the virtual maze [30]. In this study, we focused on the effect of different typical landmarks. Two types were divided into the global landmarks and the local landmarks. We researched the effect of landmarks to affect spatial cognitive function by
physiological signals, such as brain waves. Through physiological signals we could objectively understand each cognitive state of the subjects. Both types of landmarks provided different style of help for guiding direction. We would adopt the brain dynamic of the EEG data recorded in the individual situation. We tested brain activities data recorded in between the global condition and location condition by using permutation tests to see if there was the significant difference of brain activities in the same independent component or not.
II. Materials and Methods
2.1. Implementation of the Virtual Environment
The virtual maze environment in the current study, FlexNavi (i.e., flexible navigation), was implemented in two independent modules: the 3D environment and the control module. The 3D environment is a 3D model in 3ds-Max (Autodesk®, San Rafael, CA, USA) compatible format (3ds format). The 3D model can be created with any 3D model software that can export 3ds format, and its layout is totally up to the research purpose of the users. The control module is implemented in Visual C++ using WorldToolKit (WTK) library (SENSE8®). The WTK library is an advanced cross-platform environment for the development of high-performance and three-dimensional graphics applications. The C program including the WTK library is used and its library function is called up to control the three-dimensional models.
The control-module loads the 3D model and allows the user to navigate inside the virtual environment in first-person view. This two-module framework of implementation gives users the flexibility to create any kind of maze layout that suits their research purpose, while avoiding the cumbersome process of acquiring programming skills. Figure 2-1 showed the 3D models for global landmarks and local landmarks.
For general application purpose, the environment was built for different purposes and the program allowed the user to use a text file to define various parameters, such as basic control, target environment, task mode, and input/output setups.
(a)
(b)
2.1.1. Apparatus
The virtual maze environment was loaded on a PC-compatible desktop computer equipped with 2GB of RAM and a 22 TFT LCD monitor. The participants used four arrow keys on the keyboard to control their movement inside the maze. The view of the screen was in a first-person perspective. The participant pressed the “UP” key to move forward, “DOWN” key to move backward, and “RIGHT” and “LEFT” keys to turn leftwards and rightwards, respectively.
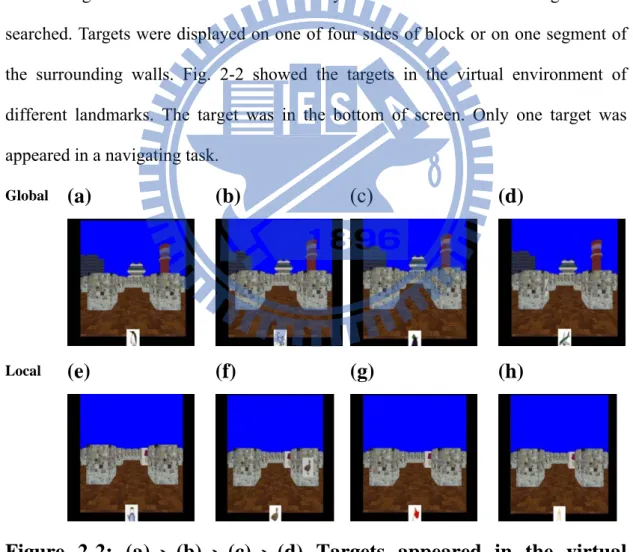
The layout of the maze used in the current experiment was a 5 × 5 grid of interleaving roads and blocks surrounded by walls. There were four targets to be searched. Targets were displayed on one of four sides of block or on one segment of the surrounding walls. Fig. 2-2 showed the targets in the virtual environment of different landmarks. The target was in the bottom of screen. Only one target was appeared in a navigating task.
Global
(a)
(b)
(c)
(d)
Local
(e)
(f) (g) (h)
Figure 2-2: (a) 、 (b) 、 (c) 、 (d) Targets appeared in the virtual
environment of global landmarks. (e)、(f)、(g)、(g) Targets appeared
in the virtual environment of local landmarks.
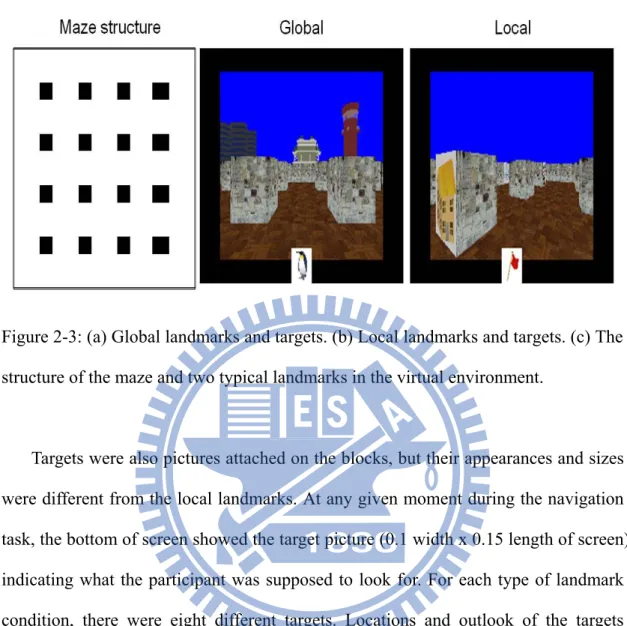
In the global condition, ten large architectures were placed outside the surrounded walls. Participants could see from everywhere inside the maze and the target was searched in the maze (Figure 2-3 (a)). In the local condition, ten picture landmarks were placed on the sides of different blocks and targets were searched in the maze (Figure 2-3 (b)). We built two virtual mazes which were consisted of two typical landmarks (Figure 2-3 (c)). Participants could see a particular landmark only from a few restricted orientations at certain locations inside the maze. However, if participants control his/her view by rotating 360 degrees at any position, they will see at least one landmark. For a given type of maze, only one type of landmarks was displayed. There were no specific paths for subjects to walk in the maze composed of simple structure because there were several moving styles of the minimal paths.
(a)
(c)
Figure 2-3: (a) Global landmarks and targets. (b) Local landmarks and targets. (c) The structure of the maze and two typical landmarks in the virtual environment.
Targets were also pictures attached on the blocks, but their appearances and sizes were different from the local landmarks. At any given moment during the navigation task, the bottom of screen showed the target picture (0.1 width x 0.15 length of screen) indicating what the participant was supposed to look for. For each type of landmark condition, there were eight different targets. Locations and outlook of the targets differed between mazes of different types of landmarks.
2.1.2. Program Setup 2.1.2.1. Basic Control
The basic control settings include the program window size, forward and rotational speed of navigation, pitch angle of viewpoint, the brightness of environment light, the log file name, the control keys, joystick and mouse.
The target environment settings contain the total numbers of mazes and targets, the number of targets, the order of targets, whether showing the other target pictures
during searching one target or not, the farthest distance between view position and target to display the target picture, the user-defended positions and directions for random start points database of searching task, and the limited distances to make sure the available random start positions not too close to the end position of prior searching task and current target position.
2.1.2.2. Task Mode Settings
The task mode setup includes the order of task modes and durations, and the time to switch maze. The modes of task contain searching task, motion condition, navigation followed by defined sign, fixation marker in the center of screen, all black display, one full screen picture, and a center fixation marker with one picture background. Except the searching task and navigation followed by defined sign, the other mode screen was halted at the last position. During the motion condition, four white rectangles randomly display on the upper, bottom, left and right sides of screen then participants must respond the correct direction by control keys.
2.1.3.3. Input/Output Settings
The output signal is an 8 bits event and grid position signal transmitted from parallel port (2pin ~ 9pin) and the input signal is a one bit signal received from parallel port for synchronizing the tasks switch. The input/output setup includes the parallel port number, whether enabling the input or output port or not, and the pin number of input port.
2.2. Questionnaire
The questionnaire was a technique commonly used by researchers to realize the feelings of subjects who participated in the behavioral experiment. After completing the experiment, subjects were asked to fill the questionnaire associated with searching
style. Subjects might make use of different strategies to search the target in the different mazes. The information of the questionnaire could let us know that the characters related to different typical landmarks were gave rise to the different impacts for subjects.
2.3. Subjects
2.3.1. Behavior Experiment Subjects
Thirty right-handed healthy adults gave informed consent before the study approved by local Institutional Review Board. Fifteen males and females participated in the experiment. Mean age of the females was 20.5 ± 3.5years and mean age of the males was 22.3 ± 4.6 years. None had a history of neurological or psychiatric disorders or any sign of color blindness or visual field defects.All participants were rewarded with NT$ 200.
2.3.2. EEG Experiment Subjects
Thirteen right-handed healthy females gave informed consent before the study before the study approved by local Institutional Review Board. Mean age of the females was 21.5 ± 3.6years. None had a history of neurological or psychiatric disorders or any sign of color blindness or visual field defects. All participants were rewarded with NT$ 800.
2.4. Behavior Data Analysis
2.4.1. Corrected Travel Distance of Path Ratio Analysis
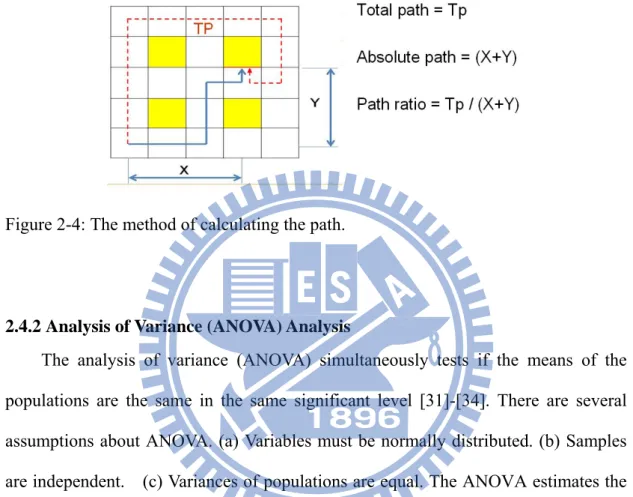
The travel distance was the length of covered path when the participant navigated from the start position to the target position in each trial, and the corrected
travel distance was the ratio of the real path length which the participants travelled during a trial to the shortest path length (Figure 2-4). Path ratio was used to determine the performance of the spatial navigation. If subjects were familiar with the virtual environment, the value of path ratio would decrease.
Figure 2-4: The method of calculating the path.
2.4.2 Analysis of Variance (ANOVA) Analysis
The analysis of variance (ANOVA) simultaneously tests if the means of the populations are the same in the same significant level [31]-[34]. There are several assumptions about ANOVA. (a) Variables must be normally distributed. (b) Samples are independent. (c) Variances of populations are equal. The ANOVA estimates the variance within the populations and the variance of inter-populations by sampling data. The freedom of each population is used to apply the F distribution test.
The one-way analysis of variance (one-way ANOVA) is a technique used to compare means of two or more samples. The one-way ANOVA is used to test the average of groups and one-way ANOVA is used to test whether these differences are significant. It appears to test the average, but it analyzes the variance in fact. The one-way ANOVA is a robust procedure relative to violations of the normality assumptions. (a) Variables must be normally distributed. (b)The sample is a simple random sample (SRS). (c)Samples are independent. (d)Variances of populations are
equal. The ratio of variance is a comparison of the variance amongst the different
populations. The one-way ANOVA measures significant effects of one factor only and the
two-way ANOVA measures the effects of two factors simultaneously. The methods of ANOVA tests are divided into non-repeat experiment and repeated experiment. For non-repeat experiment of two-way ANOVA, the data are classified with two factors and the factors are tested individually to see whether there are significant impacts on the average for two factors. Classification variables are used to test the relationship between the independent variables and the dependent variables. We can see if there is any interaction between them. For repeated experiment, one-way ANOVA is used to test the different values of the same group in the different situations. For repeated experiment of two-way ANOVA, the above test is processed in addition and then we can observe the impact of the interaction between two independent variables and the dependent variable.
2.5. EEG Data Analysis
2.5.1. EEG Data Analysis Procedures
Fig. 2-5 showed the schema of the data analysis procedure for EEG signals. The EEG data were recorded with 16-bit quantization level at a sampling rate of 2000 Hz .The EEG signals were down-sampled to sampling rate from 2000 to 500 Hz. The EEG signals were filtered with a low-pass with the cut-off frequencies at 50 Hz and then the EEG signals were filtered with high-pass filter with the cut-off frequencies at 0.5 Hz. The EEG data were extracted epochs from 1 s before the deviation onsets and 23 s after the deviation onsets. We would remove some epochs that were consisted too many noisy signals. These remainding epochs were combined with each other. The EEG data were processed by independent component analysis (ICA) and we applied
the method of Event-Related spectral perturbations (ERSP) to investigate the brain dynamics responses.
Figure 2-5: The schema for EEG analysis
The EEG responses related to different navigation stages of a block were extracted and combined together. There were several types of artifacts which were identified and eliminated from EEG data by using the EEGLAB toolbox. Criteria of artifact rejection included linear drift (Figure 2-6 (a)) and abnormally distributed data (Figure 2-6 (b)). The artifacts might be generated from equipments or the physiologic activity like as muscle artifact. Eye movements usually were observed in frontal electrodes. Sweat artifact was characterized by very low-frequency oscillations (Figure 2-6 (c)) [35]. The high impedance at posterior temporal electrode T6 resulted
in this electrode recording from the ground on the forehead (Figure 2-6 (d)) [35]. (a)
(c)
(d)
Figure 2-6: The artifacts were existed in the EEG signals. (a): Artifacts were generated from the bad channel T7. (b): Artifacts were muscle activities. (c) The distribution here (midtemporal electrode T3 and occipital electrode O1) were suggested sweat. Note that morphology and frequency were also consistent with slow rolling eye movements [35]. (d) The high impedance at posterior temporal electrode T6 results in this electrode recording from the ground on the forehead [35].
2.5.2. Independent Component Analysis (ICA)
The broad spread of EEG source potentials through the brain, skull, and scalp at each scalp electrode. The ICA algorithm was suitable to decompose the EEG data which was collected with single scalp channels. The ICA algorithm was related to the method called blind signals separation and it was a powerful approach to identify the complex spatiotemporal dynamic [36]-[37].The ICA was used to find a linear signal separation and feature extraction. The ICA performed a linear un-mixing of multi-channel EEG recordings into temporally independent statistical source signals. After ICA decomposition, the spatial filters were chosen the maximum among temporally independent signals in the mixed channel data. These information sources might represent synchronous activity. The application of the ICA algorithm was solved identification, localization and separation [38]-[40]. (1) The component source locations to the scalp sensors were fixed throughout the data. (2) The source activities of mixing source activities were summed linearly and instantaneously. (3) The component source activity waveforms were temporally independent of one another. (4) There were no differential delays involved in projecting the source signals to the different sensors. (5) The probable distributions of the individual component source generated by nonlinear cortical dynamics activity values were not precise Gaussian. (6)The signal source of physiological activity was not time locked to the sources of the EEG data. We would adopt independent component analysis (ICA) to find spatial filters for information sources of the EEG data. Figure 2-7 showed the process about ICA decomposition data which were transform into temporally independent processes. ICA applied to a matrix of EEG scalp data to find a non-mixed matrix of weights and non-mixed matrix were permuted by weights.
The sources of EEG activities were regarded as reflecting synaptic activity of cortical neurons. An independent component of the EEG data composed of the fixed
scalp map and a time series. The fixed scalp map showed the relative weights of the projection from each electrode location. The information of time series was relative to the amplitude and the polarity at each time point. In matrix algebra form, the scalp data were X, the component activations were U, and the ICA model estimated a linear mapping W such that the unmixed signals U were mutually independent.
X
U =W . (2-1)
We would apply spatial filters W to the EEG data to derive activation time courses of the independent component processes. The reconstituted data from the components were used by conversing process. were the component mixing matrix. 1 − W U X = W−1 (2-2)
Figure 2-7: Schema for Independent Component Analysis (ICA) data decomposition
and back-projection [39].
ICA weighting matrix projected each component onto the surface of the scalp. We could observe the artifacts and channel noises were effectively separated from the signals.
Fig. 2-8: These were the scalp topography of ICA decomposition. The color bar was the amplitude of component signals.
2.5.3. Component Clustering
Two equivalent EEG sources in different subjects might project to the same electrode location with variable amplitude [41].The component clustering of the
cross-subject was classified several significant clusters of the brain activity. To cluster these components from different subjects was determined by the information about scale maps, spectra, event-related potentials, time-frequency results, dominant activity patterns, source localization information [42]. Independent component clustering was required to compare ICA decompositions from all subjects [39]. In the similar component clusters, we meant the values of these components to get individual component.
2.5.4. Event Related Spectral Perturbations (ERSP) Analysis
Event-related spectral perturbations analysis was time-locked but not phase-locked. ERSP was first proposed by Makeig [43]. An event-related spectrogram was averaged power or log power of frequency / time values, before applying Fast Fourier Transform with overlapped moving windows and we could choose the spectral baseline. We would normalize the result by subtracting the baseline period. The procedure was applied to all epochs, and the color-coded image of mean log spectral differences were the ERSP image. The ERSP image showed spectral differences after events. Figure 2-9 showed the steps of the ERSP [44]. FFT was applied in each window with 256 samples.
2.5.5. Permutation Tests
The permutation test was a type of statistical significance test. The reference distribution was obtained by calculating all possible values of the test statistic under rearrangements of the data [45]. Permutation tests tried to find all possible combinations and permutations of the data. Permutation tests were suitable for the comparison of two populations with features were not the normal distribution or a small number of samples. There were two groups of global data and local data in our experiment. We adopted permutation tests [46]-[48] to estimate the probability distribution of these groups. The sampling distribution showed what would happen if we took many samples under the same conditions. Figure 3-6 showed the procedure of permutation test. We put together the ERSP data of different typical landmarks into two matrices form all subject. First, the matrix of global landmarks subtracted the matrix of local landmarks to get the new matrix. We processed the t-test for the new matrix. If the result was showed significance (p < 0.05), we continue to execute the second step. There were three steps in the second state. The elements of relative row values of the same subject between these two matrices were exchanged randomly with each other. Then, we processed t-test like as first state. We would repeat the second state 10000 times to see if the result was significant or not.
III. Spatial Navigation in Virtual Environments with
Different Types of Landmarks: Behavioral Experime
nt
3.1. Methods of the Behavioral Experiment
3.1.1. Behavior Environment Setup
Fig. 2-4(a) showed the experiment environment. Subjects looked at the screen which was displayed the virtual environment of the maze, and subjects navigated in the maze by using keyboard. The shielding room was used widely in various areas of researches to prevent foreign interference. Fig. 2-4(b) showed the shielding room which was used to prevent magnetism, sound, electro-magnetic wave, and electronic signals. The shielding room was consisted of single acoustic wall, single acoustic ceiling, and single floating floor. Subjects processed the experiment in the shielding room avoiding outside interference. Subjects could be monitored from the camera on the desk.
(a) (b)
Figure 3-1: (a)Experiment environment. (b)Shielding room.
3.1.2. Behavioral Experiment Procedure
All participants were tested individually by similar global or local landmarks in the virtual maze environments. In the beginning, subjects were unfamiliar with the virtual environments. For this reason, we designed the training state in order to help subjects to familiar with environments of different typical landmarks. Subjects could adopt different typical landmarks to navigate the virtual environment in the training state. Figure 3-2(a) showed the order of behavior experiment in training state and testing state. A trial was composed of 12 blocks at most and subjects searched only one target in a block. Subjects searched totally 12 targets at most in the single type landmarks environment. Subjects searched each target without time limit until all 12 targets were found unless up to 6-minutes limit. Subjects learned the positions and locations of targets in the training state. Then the participant searched each target within 20-seconds time limit each target in the testing state. Only one target appeared in a task and the other one would not appear until the current target was found or the 20–seconds time limit which was reached. Although the order of the targets order was randomly assigned, there were the same times of targets. After finding the target, the scene would be transferred randomly to other position and a new target picture was appeared to start next searching task. There were two sequences of landmarks when subjects participated in the spatial navigation experiment. One sequence consisted of eight consecutive trials of global landmarks followed by another eight consecutive trials of local landmarks, and the other consisted o eight consecutive trials of local landmarks followed by another eight consecutive trials of global landmarks. Subjects were randomly assigned to one sequence to avoid confounding from order effect
caused by a particular sequence.
Figure 3-2: Schema of behavior experiments with different landmarks.
3.2. Results
3.2.1. Training Trials Associated with Gender and Landmarks
The main effect of landmark was not significant (F (1, 28) =.595, p > .05, η2=0.021, Figure 3-3 (a)). The participants needed equivalent number of learning trials to reach the criterion of 100% performance (Global: 3.43±0.37 trials; Local: 3.83±0.39 trials, Figure 3-3 (b)). The main effect of gender was also significant (F (1, 28) = 9.946, p < .01, η2=0.262). In general, the male participants needed fewer
learning trials (2.77±0.39) than females (4.5±0.39) to fulfill the criterion success rate. None of the interactions reached significance (all ps > .05). Males had better performance to search targets than females. Males needed fewer trials to reach 100% success rate than females. Although time was restricted within 6-minutes in the training state, the training state was effective for males. Males achieved 100% success rate faster. The results indicated that males became familiar with the virtual environment earlier than females did.
(a) (b)
Figure 3-3: (a) Different landmarks needed different trials to reach 100% success rate.(b) Males and females needed different trials to reach 100% success rate
3.2.2. Travel Duration
The travel duration was the amount of time passed between the time when participants started out to find a given target as instructed and the time when they reached the target location. There was no significant main effect of landmark (F (1, 28) = 3.133, p > .05, η2=0.101, Figure 3-4 (a) ), but there were significant main effects of trial (F (7, 196) = 20.342, p< .01, η2=0.421, Figure 3-4 (b) ) and gender (F (1, 28) = 19.128, p< .01, η2=0.406). In general, the participants spent less time to find the targets in the later trials (the last trial: 8.32±0.21 seconds) than in the earlier trials (the first trial: 11.10 ± 0.29 seconds), and the male participants needed fewer time than female participants. There were also a significant interaction between landmark and gender (F (1, 28) = 6.79, p< .05, η2=0.195), and between landmark types and trial (F (7,196) = 2.611, p< .05, η2=0.085). The curves of global and local landmarks were implied that the performance of subjects was got better and better in the later trials. The phenomenon indicated that subjects became more familiar with the virtual environment so that subjects spent little time searching targets. Subjects had similar performance in the virtual environment with global or local landmarks in the whole
trials and then we analyzed travel duration of time about gender. All participants got better and better manifestation of searching time across the experiments. Males wasted little time searching targets in both landmarks environments. Males had better cognitive performance of searching time than females regardless of different landmarks in every trial. Males and females improved their performance in the later trials.
(a) (b)
Figure 3-4: (a) Subjects wasted time searching the target in the virtual reality environment with different landmarks in each trial. (b)Searching time of males and females in each trial. Males spent less time than females for each trial. Both males and females’ travel duration get shorter with the number of trials performed.
The analysis on the simple main effect revealed that male participants spent similar amount of times before finding the target position in both types of landmark’s environments ( Figure 3-5 (a)), while the females spent less amount of time to finish a trial in the local than in the global condition( Figure 3-5 (b)). Furthermore, the participants had unequal improvement in local and global landmark environments.
Neither the trial × gender nor the three-way interactions reached significance (trial × gender: F (7, 196) = .482, p >.05; three-way interaction: F (7,196) = .365, p >.05).
(a) (b)
Figure 3-5: (a) Male wasted time navigating in the mazes with different landmarks. Males had the similar performance of global and local condition. Males improved his performance in the later trials. (b) Female wasted time navigating in the mazes with different landmarks. Females consumed the less time in the local condition in the whole.
3.2.3. Path Ratio Results
The main effect of landmark was significant (F (1, 28) = 56.946, p< .01, η2=0.670, (Figure 3-6)). The corrected travel distance was longer for the local condition (1.72±0.05) than for the global condition (1.46±0.03). The main effect of trial order was also significant (F (7,196) = 14.962, p < .01, η2=0.348). The three-way interaction was significant (F (7,196) = 2.953, p < .01, η2=0.095). The global condition had better performance than the local condition for all subjects in comparison of path ratio.
Figure 3-6: The different path ratio values were between global landmark environments and local landmark environments in each trial. In the whole, subjects covered shorter walking path in the global than in the local condition. There was the variation in the local condition in comparison of path ratio.
In the global condition (Figure 3-7(a)), the females had longer corrected travel distance than males in the first trial, while they had equivalent corrected path length in the rest of the trials. Females had a little better performance of corrected travel distance than males in the local landmark environment across the eight trials (Figure 3-7(b)). Both of males and females had shorter corrected travel distance in the global condition than in the local environment. Males had greater extent of improvement in local than in global landmark condition (F (7, 98) = 3.853, p < .01, η2=0.216, (Figure 3-7(c)) while the females had the same degree of improvement between the two types of landmark conditions in the eighth trial(F (7, 98) = 1.73, p > .05, η2=0.11, (Figure 3-7(d)), By examining the interaction between landmark-type and trial-order in males and females, respectively, we found that while females did not show differential progress of corrected travel distance in both types of landmarks, males did show
significant interaction between these two variables (report the two way interaction and post hoc analysis accordingly).
Figure 3-7: (a) Path ratio as a function of gender and number of trials in the global landmark condition; (b) Path ratio as a function of gender and number of trials in the local landmark condition (c) The global landmark state was compared with the local landmark state for male. (d) The global landmark state was compared with the local landmark state for female.
3.3. Summary of the Behavioral Experiment
Subjects navigated in virtual reality environments with different types of landmarks. Males used fewer learning trials reaching the 100% success rate in the virtual environment. In comparison of learning, there was the significance between males and females. Males became more familiar with the virtual environment than females in the early trials. In comparison of the duration curves, the performance of
subjects was got better and better in the later trials. Subjects had similar performance in the virtual environment with global or local landmarks in the whole trials. Males wasted little time searching targets in both landmarks environments. Males had better cognitive performance of searching time than females regardless of different types of landmarks in every trial. Males and females wasted little duration of searching time in the later trial. When males were compared with different types of landmarks, males had the similar performance of duration time in the global condition and local condition. Females wasted little searching time in local condition.
In comparison of path ratio, there was better performance in global condition than in the local condition in the whole trials. Males and females had the similar performance in the global condition, but females had better performance than males in the local condition. This phenomenon was appeared that males wasted more walking path walking then females in the local condition. As a result, females were more familiar with the environment of local landmarks than males. When males were compared with different types of landmarks, males had good performance of walking path in global condition. Females had better performance of walking path in global condition than in local condition. Global landmarks were treated as compass for subjects so that subjects decided the direction more quickly in the global condition.
IV. Brain Activity of Spatial Navigation
4.1. EEG Experiment Paradigm Design
4.1.1 EEG Experiment Setup
Subjects performed the environment in the shielding room. Fig. 4-1 showed the schematic environment of EEG experiment. Subjects navigated in the virtual reality environment on the screen and computer1 received EEG raw data from the amplifier which received the brain activity signals from electrode cap. Computer2 controlled the program to display the virtual environment on the screen and the computer2 recorded the log files from the maze programs.
Figure 4-1: The environment of the EEG experiment.
Fig. 4-2 (a) showed the situation of the experiment in the shielding room. Subjects wore a movement-proof electrode cap with 64 electrodes (Fig. 4-2 (b)). The 64-channel electroencephalogram (EEG) system measured scalp-potentials during the experiment for us to examine correlations between brain activity and cognitive factors such as working memory performance, direction decision, and the potential benefits of exercise on brain functioning. A 64-channel EEG system provided high spatial resolution information about brain activity in the simulator situations [49]
The EEG data were recorded with 16-bit quantization level at a sampling rate of 2000 Hz. The EEG data were recorded form amplified with the Scan SynAmps RT
Amplifier
3D environment
Express system (Compumedics Ltd., VIC, Australia). The SynAmps RT is a 70 DC channel amplifier system, consisting of 64 monopolar, 4 bipolar and 2 high-level channels. Each channel has a dedicated 24 bit A-to-D to ensure the most accurate sampling data.
(a) (b)
Figure 4-2: The photographs showed physiological recording containing the SynAmps RT EEG amplifier and the electrode cap.
Table 4-1: SynAmps RT Specifications
Monopolar Channel
Count
64 Per Headbox, 256 Per System Unit
Maximum Sampling
Rate
20,000 Hz / Channel all channels drive
A/D Resolution
24 Bit
Input Impedanc
10 GOhms
Input Noise
<0.5 uV RMS DC to 200Hz,<1.5uV RMS
Low Pass Filter
(Maximum)
-3 dB at 3500 Hz, single pole
High Pass Filter
(Minimum)
DC or -3 dB at .05 Hz, single pole
4.1.2. EEG Experiment Procedures
All participants were tested individually by global or local landmarks within the mazes in the shielding room. Before subjects proceeded with EEG experiment, they were asked to train the behavior experiment. They didn’t need to perform eight trials completely. When their success rate of the testing session was up to 100%, they would terminate the behavior experiment. They would not perform experiment immediately and they would perform EEG experiment of maze next day.
They navigated ten trials in mazes to search target locations with sixteen times. A block of a mission was composed of four states. Subjects jumped to the initial station in the first state. The first state was sustained two seconds in static state. The target was appeared at two seconds and subjects still maintained static state. In the third state, subjects would search target at less than fifteen seconds. In fourth state, the screen was suspended at two seconds. A block was divided into four stages in order to
increase the aligned events. We would observe the phenomenon related to brain activity in different stages.
There were two sequence types of trials. The sequence of type one was continuous eight blocks of global landmarks before eight blocks of local landmarks, and the sequence of type two was reversed sequence of landmarks. The sequence of type one was composed of four parts. The first part was the free walking in the maze with no target in five seconds, the second part was eight blocks in the maze of global landmarks, the third part was the free walking in the maze with no target in ten seconds to avoid different landmark types which affected subjects performance, the fourth part was eight blocks in the maze of local landmarks. The sequence of type two was similar to the type one sequence. The first part was the free walking in the maze with no target and no landmarks at five seconds, the second part was eight blocks in the maze of local landmarks, the third part was the free walking in the maze with no target and no landmarks at ten seconds, the fourth part was eight blocks in the maze of local landmarks. Fig. 4-4 showed the schema of sequences. Subjects randomly adopted one type sequence to avoid the fixed sequence of landmarks to cause particular result. These two type sequences were exchanged with each other in the experiment.
Figure 4-4: The structure of sequences
4.2 Brain Sources of Stimulus Response
4.2.1 Brain Dynamics in Different Path Ratio Categories
We analyzed the path ratio in brain dynamic experiment. Before brain dynamics experiment, females would practice to reach the 100 % success rate. Females were familiar with the virtual environment. Females had better performance in the global condition than in the local condition during the brain dynamic experiment for each trial.
Figure 4-5: Subjects had better performance in global condition than in local condition for each trail.
We collected all trials from all experiments in which females participated and we performed path ratio analysis by using the grid information of the EEG recorded data. The path ratio was classified the three parts (Figure 4-6). In the global condition, the percentage of path ratio one was 52% trials, the percentage of path ratio between one and one point five was 45% trials, and the path ratio larger than one point five was 3% trials. In the local condition, the percentage of path ratio one was 32% trials, the percentage of path ratio between one and one point five was 50% trials, the path ratio larger than one point five was 18% trials. Females had better performance in global condition than in local condition. Females might effectively decide the direction to move in global condition for the reason that subjects didn’t waste redundant walks.
Figure 4-6: The results showed the percentage of the trials.
4.2.1.1 Brain Dynamics in the Frontal Midline
The results showed the action of ICA applied to EEG data to remove effects of non-brain activities from scalp recordings. We classified the results of the ERSP based on path ratio categories (Figure 4-7). The power and amplitude of the theta band (4~8Hz) in the global condition were obvious strong. The theta power continuously increased in both global condition and local condition. When females searched the targets, the duration time of theta power increased longer in global condition than in local condition.
(a)Path ratio=1
(b) 1≤ Path ratio 1.5 ≤
(c) 1.5≤ Path ratio
Figure 4-7: (a) Path ratio=1 (b) 1≤ Path ratio ≤ 1.5 (c) 1.5 ≤ Path ratio
4.2.2. EEG Activites in Different Independent Components
4.2.2.1 Independent Component(IC) Clustering and Source Localization
The component clusters showed that the spatial navigation involved frontal midline components.
Figure 4-8: The frontal IC clusters of the location.
4.2.2.2. Frontal Midline Component
The block contained four states in the searching situation. The time range was at most twenty one seconds in a task, but the times of blocks were very variable. Therefore we adjusted the time scale of the navigation time in order to compare brain activity. We enlarged the time less than ten seconds and narrowed down beyond ten seconds when subjects searched the target. The time of static state was fixed so that the time was adjusted sixteen seconds in a block. Figure 4-8 showed the ERSP results in the frontal midline. In the first state, subjects were jumped to the starting point and
the environment did not cause obvious brain activity response for subjects. In the second state, the target was appeared for subjects to search and the brain activity of theta power was increased in the last one second. We wanted subjects to recall where the target was and the phenomenon involved with working memory in the static state. Obviously, the theta power lasted a long time in the third state when subject searched the target in the virtual reality environment. In the fourth state, the theta power returned like as the baseline power. The duration time and strength of theta power lasted longer in global condition than in local condition. Females recalled the location of the target in the early searching time so that the theta power increased and the brain activity of subjects became weak in the end of searching time. The peak value of the theta power was appeared in the third state in which females searched the target. The theta power was in the peak value for a long time in the global condition but the theta power was in the peak value for a short while in the local condition.
(a)
(b)
Figure 4-9: (a) Brain activity of theta power increased in frontal midline in the global condition. (b) Brain activity of theta power increased in frontal midline in the local condition.
4.2.2.3. Parietal Component
The parietal lobe integrated sensory information from different modalities, particularly determining spatial sense and navigation. We could observe that power decreased in the parietal during the experiment. In the first state, subjects exchanged the location in the beginning and power decreased for a while. The target was appeared in the second state and power decreased across almost second state. In the third state, females searched the target in the virtual environment and power decreased across the whole state. Figure 4-9 showed the results of ERSP in the parietal.
(a)
(b)
Figure 4-10: (a) Brain activity of power decreased in the parietal in the global condition. (b) Brain activity of power decreased in the parietal the in the local condition.
4.2.3. Brain Activity of Permutation Tests
Figure 4-10 showed the brain activity of power variation and significant differences between global condition and local condition. The theta band increased values during the experiment with different landmarks. There were significant differences of theta band between global condition and local condition. In addition, the theta power was higher in the global condition than in the local condition during the experiment.
Figure 4-11: The results of permutation tests indicated the significant differences in the gray block. Brain activity of theta power increased and had significant differences in the frontal midline.
.
4.3. Summary of Brain Activity Experiment
Females would be trained to reach 100% success rate before the brain dynamic experiment and females were familiar with the virtual environment. We observed the behavior performances in the brain dynamic experiment and females had better performance of path ratio in the global condition than in the local condition during the
experiment for each trial. The result of the performance was the same as behavioral experiment for females in comparison of path ratio. Global landmarks seemed more helpful for females to move in the virtual environment.
We classified the path ratio into three levels of path lengths which were short, medium, and long path. Females had more percentage of trials that were consisted of short and medium path length in the global condition than in the local condition. For this reason, females would not waste too much redundant path walking in the global condition.
The increase of the theta band was present in frontal midline. We observed that theta power increased during the navigation task. The theta band was more power and strength in global condition than in local condition. In permutation tests, there were significant differences of theta band between the global condition and the local condition during navigation in the frontal midline. In addition, we also observed that power decreased in the parietal during the experiment.
V. Discussion
5.1 Discussion of Behavior Results
The cognitive styles might be regarded as individual’s consistent approach to process the information during recall and thinking [50]-[51]. The relationships of styles were observed behaviors, such as learning performance, learning preferences, subject preferences [52]. Conventional training design methodologies played the important role so that we designed the training state and testing state for different purposes. Subjects had sufficient searching time when subjects searched the target in the training state. The accommodation of spatial navigation in the training design process had the potential to improve the efficiency of individual performance. The process could be seen the cognitive styles of navigation. We determined the performance of subjects in the testing state. The males needed fewer learning trials (2.77±0.39) than females (4.5±0.39) to fulfill 100% success rate. The phenomenon appeared that males were more familiar with the virtual reality environment than females in the early trials.
The cognitive functions for gender-specific performance difference were well known [53]-[54]. The behavioral research demonstrated that women rely predominantly on landmark cues, whereas men use both geometric and landmark cues [55]. For previous research, males were better spatial perception ability than females in the spatial experiment [56]. Both types of landmarks might be provided with different help of guide for subject and both types of landmarks differenced dimension that affected strategy choice. Subjects could use the landmarks as references or make choices with respect to moving in the environment. The global landmarks were used as direct goals, whereas the local landmarks were used as intermediate goals. We observed the improvement of the searching time and path the ratio in the behavioral
experiment.
We also found the different performances of gender. In comparison of searching time, males spent less searching time than females for each trial in both types of landmarks. Males had better performance of searching time than females. Subjects sometimes needed to rotate their view to decide the direction in order to search the target so that ability of rotation skills possessed influence about searching time. In comparison of path ratio with respect to gender, females had a little better performance of corrected travel distance than males in the local landmarks environment. The phenomenon was appeared that males wasted more redundant walking path than females in the local landmarks environment. Females effectively adopted the local landmarks to navigate the virtual maze. Males and females had similar corrected path length in the global condition. In global landmarks environment, all males and females effectively made use of global landmarks to determine the direction during navigating. The closest landmarks around the target played the important role for subjects. In global condition, subjects could easily know where they were for a short while in the maze but this was not easy matter for subjects to know the location in the local condition. When subjects decided the direction to walk in the global condition, subjects would quite easily choose the shortest path. Therefore, subjects would not waste redundant walking in the global condition.
The empirical navigation was depended on practice and the different strategies were affected searching style. We also determined the detailed performance for males or females in the different condition. Males spent the similar amount of searching times in both types of landmark environments. Females spent less amount of searching time in the local than in the global condition. In comparison of path ratio with respect to landmarks, both of males and females had shorter corrected travel
distance in the global condition than in the local environment. The phenomenon appeared that the global landmarks played the role as beacons to guide the subjects the direction. As a result, subjects would not waste too many redundant walking paths form the information of the global landmarks. To sum up the females’ performance was different between searching time and path ratio. Subjects would waste the searching time which was constructed from walking time, rotating time and recalling time. The searching time could not absolutely present the ability of navigation. We considered the improved trend of the searching time. Females got better and better performance of the searching time. The path ratio presented the familiarity with the virtual environment.
Because subjects were randomly transformed to another position far away from the target in the first state, then even the same target would not be necessarily corresponded to the same initial position. For this reason, subjects might have different walking path in the different navigating task and the performance of subjects was slight ups and downs. The overall trend gradually progressed.
After subjects completed the experiment, subjects were asked to write the questionnaire. We found that all subjects could not be able to describe the integrant structure of the landmarks’ location about both type landmarks. Subjects could mark a part of landmarks surrounding target in the global condition. Subjects could only describe the landmarks that were close to the target in the local condition. Subjects only described the relative position between the target and landmarks. It was difficult for subjects to describe the entire map with both landmarks. It seemed that subjects memorized the landmarks related to the target and subjects played less attention to other landmarks. There was different weight of landmarks according to targets. The landmarks closed to the target possessed the most significant help so that subjects
memorized these relative landmarks to search the target. The other landmarks played important role of assistance to cognize where subjects was.
In the EEG experiment, females had been familiar with the virtual environment. Females had shorter corrected travel distance in the global condition than in the local environment, too. It was obviously that there was stable performance in the global condition. Females still wasted redundant walking path in the local condition.
5.2 Discussion of Brain Activity
Theta oscillation could hence be conceived as the navigation rhythm through both physical and mnemonic space [57]. The theta band associated with states of concentration and conscious control over attention [58]. The observation of human theta had begun to reveal an intriguing connection between brain oscillations and cognitive processes [59] Both the frontal cortex and the centroparietal cortical areas contributed to learning during spatial navigation [60]. Prominent theta activity appeared over the frontal midline. The theta rhythm in the frontal midline increased in magnitude with memory load and where as a parietal central, alpha signal decreased in magnitude with increased task difficulty [21]. Previous researches demonstrated that the theta power in the frontal midline scalp increased with mental effort associated with working memory [61]-[64]. Memory recall had been associated with an increase of theta band during encoding and retention [65]-[66]. Some studies [67]-[68] reported that theta of the frontal midline appeared during short-term working memory tasks and the theta activity increases with memory load. The theta band in the scalp in the frontal midline was often present during working memory [29]. In the EEG experiment, we observed the increase of the theta (4-8 Hz) power in the frontal midline. Before the target was appeared, the theta band of the frontal
midline did not increase the power .When the target was appeared on the screen, the increase of theta power appeared after one second in the second state. The theta band of the frontal midline increased the power until subjects almost find the target. The phenomenon was related with working memory because subjects needed to recall the location of the target by the landmarks. Current sensory input, spatial memory and motion are concurrently coded in the phase of every theta cycle to compute a possible direction of motion [69].
Figure 5-1: Time course of information processing in different layers [69].
Although subjects watched the landmarks in the first state, it seemed that subjects were less concerned with the landmarks and there was no variation of brain activity in the sensory information. In the previous task, the theta power returned to baseline state in the fourth state. In the present task, subjects were familiar with the virtual environment. The advantage of the simple structure kept off the influence from the structure of the virtual environment. We only considered the influence from different type of the landmarks, such as global and local landmarks. When the target was appeared, the weight of the landmarks was according to the target. The target affected the navigation strategies by which subjects decided the direction to go. In the second state, the phenomenon showed memory retrieval and the theta power increased.
![Figure 2-7: Schema for Independent Component Analysis (ICA) data decomposition and back-projection [39]](https://thumb-ap.123doks.com/thumbv2/9libinfo/8042708.161974/29.892.145.760.425.978/figure-schema-independent-component-analysis-ica-decomposition-projection.webp)
![Figure 2-9: The data was processed by using ERSP analysis [44].](https://thumb-ap.123doks.com/thumbv2/9libinfo/8042708.161974/31.892.138.693.444.990/figure-data-processed-using-ersp-analysis.webp)
![TraditionalMLCalgorithmsmainlytacklethebatchMLCproblem,wheretheinputdataarepresentedinabatch[24,28].Nevertheless,inmanyMLCapplicationssuchase-mailcategorization[22],multi-labelexamplesarriveasastream.Onlineanalysisistherefore dimensionreducermotivatedbyma](data:image/gif;base64,R0lGODlhAQABAIAAAP///wAAACH5BAEAAAAALAAAAAABAAEAAAICRAEAOw==)