國立交通大學
機械工程學系
碩士論文
利用廢熱回收提升進氣溫度對沼氣發電的影
響研究
The Experimental Study on Biogas Power
Generation Enhanced by Using Waste Heat to Preheat
Inlet Gases
研 究 生 :黃聖容
指導教授:陳俊勳 教授
利用廢熱回收提升進氣溫度對沼氣發電的影響研究
The Experimental Study on Biogas Power Generation Enhanced by Using Waste Heat to Preheat Inlet Gases
研究生 :黃聖容 Student:Sheng-Rung Huang 指導教授:陳俊勳 Advisor:Chiun-Hsun Chen 國 立 交 通 大 學 機 械 工 程 學 系 碩 士 論 文 A Thesis
Submitted to Department of Mechanical Engineering College of Engineering
National Chiao Tung University In Partial Fulfillment of the Requirements
For the Degree of Master of Science In Mechanical Engineering
June 2011
Hsinchu, Taiwan, Republic of China 中 華 民 國 一○○年六月
i
利用廢熱回收提升進氣溫度對沼氣發電的影響研究
學生:黃聖容 指導教授:陳 俊 勳
國立交通大學機械工程學系
摘要
本論文在台中台糖養豬場測試小型 30kW 沼氣發電機,收集資料以供長 時間沼氣發電使用。本論文分為三大部分,第一部分,使用 73%甲烷濃度 的沼氣,測試在不同沼氣供給量與不同過剩空氣比時的發電狀況;第二部 分,將此結果與計畫第一年的 60%甲烷濃度實驗數據比較,觀察不同甲烷 濃度(60%與 73%)對發電效能之影響。第三部分,利用廢熱回收系統加熱 進氣,測試不同進氣溫度對沼氣發電的影響。實驗結果顯示,使用目前 73%之甲烷濃度沼氣,在沼氣供給量為 260L/min 時,引擎最佳發電量為 26.7kW;在沼氣供給量為 200L/min 時擁有最佳熱效率 27%和最佳甲烷使 用率 96.03%。提升甲烷濃度,發電功率隨著甲烷濃度提升而提升,除了 當過剩空氣比λ<0.85 時。對熱效能而言,在燃料量較稀的狀況下(λ>0.95) 可讓熱效能提升;但在燃料量較濃的狀況下(λ<0.95),提升甲烷濃度對 熱效能沒有好的影響。提升近氣溫度,在過剩空氣比約大於 1.3 後有較明 顯的影響。 關鍵字:沼氣、沼氣發電、沼氣濃度、進氣溫度ii
The Experimental Study on Biogas Power Generation
Enhanced by Using Waste Heat to Preheat Inlet Gases
Student: Sheng-Rung Huang Advisor: Prof.Chiun-Hsun Chen
Department of Mechanical Engineering National Chiao Tung University
ABSTRACT
This research used a 30kW-generator in Taiwan Sugar swine farm in Taichung to collect data for the long-term electricity generation. This study is an continous effort of Lin’s work [3], which carried out the electricity generation project by using 60% methane concentration of biogas in a small swine farm in Miaoli. This experimental study, using 73% methane concentration of biogas, consisted of three parts. Firstly, investigate the effect of biogas supply rate together with the different excess air ratios on generator performance. Secondly, make a comparison with Lin’s results. Finally, apply a waste heat recovery system to preheat the inlet gas under different temperatures and analyze the preheating influence on the generator performance.
In the present study, the maximum power generation is 26.7kW occurred at biogas flow rate of 260L/min, whereas the maximum thermal efficiency and methane consumption ratio are 27% and 96.03% at biogas flow rate of 200L/min. The power generation in the present work is higher than one in Lin’s one [3], except the region around λ (excess air ratio) < 0.85. However,
iii
the thermal efficiency increases with the increasing methane concentration just in the region of λ>0.95, while on the relatively rich side (λ<0.95), there is no benefit. The improvement by preheating inlet gas is obvious when excess air ratio is relatively high, such as λ>1.3.
Keywords: Biogas, Biogas generator, Methane concentration, Inlet gas temperature
iv
Acknowledgements
首先要感謝指導教授 陳俊勳老師,您嚴謹的教學方式,使我在研究生 涯中獲益良多,不僅只於學問上的研究,還有為自己負責的態度。並感謝 國科會計畫的經費支持,讓我的實驗能夠持續下去。 感謝宗翰學長的指導,讓我了解實驗的方法和計畫報告的處理方式,使 我的研究之路變得順遂。並感謝實驗室其它學長阿貴、昶安、金輝、家維、 瑭原,在生活和學習中適時給我協助與建議。謝謝你們! 感謝同學云婷、抓抓、世庸、黃鈞你們的陪伴,讓我在這條路上不孤單。 謝謝學弟們平日的搞笑,舒緩我的壓力,小豬、天洋、阿扁、鉦鈞,謝謝 你們。 最後,謹以此文獻給我的雙親。v
Contents
ABSTRACT(Chinese) ... i ABSTRACT(English) ... ii Acknowledgements ... iv Contents ... vLIST OF TABLE ... viii
LIST OF FIGURES ... x
Chapter 1 ... 1
Introduction ... 1
1.1 Motivation and Background: ... 1
1.2 Literature Review ... 5
1.3 Scope of Present Study ... 14
Chapter 2 ... 16
Biogas System in Swine Farm ... 16
2.1 Swine Manure Management ... 16
2.2 Three-step Piggery Wastewater Treatment (TPWT) ... 16
2.2.1 Solid-liquid Separation ... 17
2.2.2 Anaerobic Treatment ... 17
2.2.3 Aerobic Treatment ... 18
2.3 Utilization of Biogas ... 19
2.4 Engines ... 21
2.4.1 Four-stroke Gas Engine and Diesel Engine ... 21
vi
2.4.3 Gas Turbine ... 22
2.4.4 Micro Gas Turbine ... 23
2.4.5 Fuel Cell ... 23
Chapter 3 ... 25
Experimental Apparatus and Procedures ... 25
3.1 Experiment layout ... 25
3.1.1 Engine ... 25
3.1.2 Air Flow Meter (VA-400) ... 26
3.1.3 Biogas Flow Meter (TF-4000) ... 27
3.1.4 Thermocouple ... 27
3.1.5 Gas Analyzer (HM5000) ... 28
3.1.6 Methane Concentration Analyzer ... 28
3.1.7 Heat Exchanger ... 28
3.1.8 Data Acquisition ... 28
3.1.9 Temperature Monitor ... 29
3.1.10 Humidity Temperature Meter (Center 311) ... 29
3.2 The Theoretical Calculation ... 30
3.3 The Effect of Methane Concentration ... 33
3.4 The Effect of Intake Gases Temperature ... 34
Chapter 4 ... 36
Results and Discussion ... 36
vii
4.2 Effect of Methane Concentration ... 46
4.3 Effect of Inlet Gas Temperature ... 51
4.4 Comparison with Other Researches ... 55
Chapter 5 ... 57
Conclusions and Recommendations ... 57
5.1 Conclusions ... 57
viii
LIST OF TABLE
Table1.1 Biogas contents from different biogas producing plants [2] ... 2
Table 3.1 Engine Technical Data ... 26
Table 3.2 Specifications of the data acquisition modules ... 29
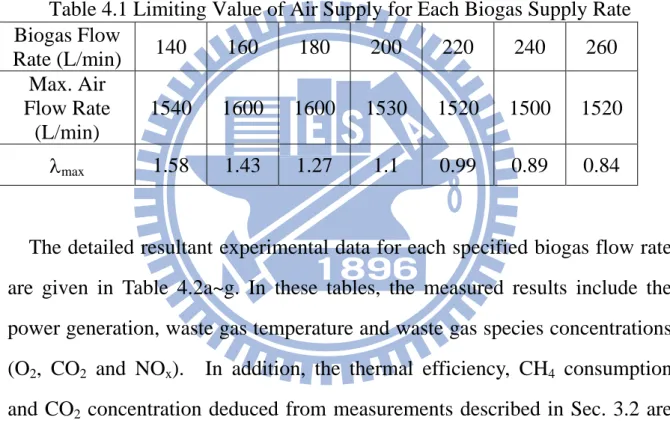
Table 4.1 Limiting value of air supply for each biogas supply rate ... 37
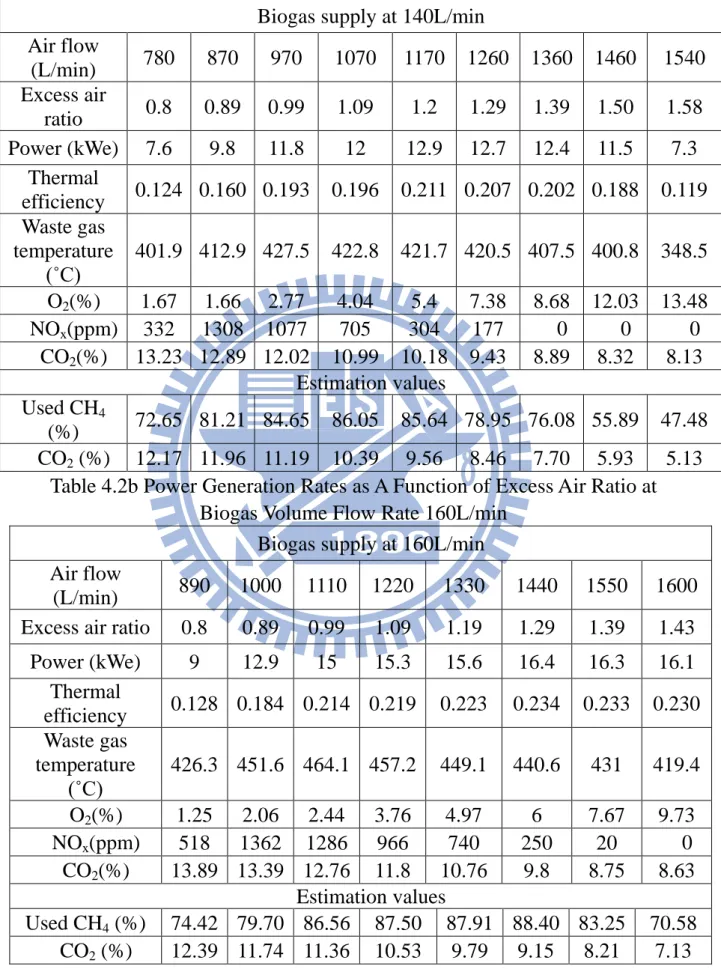
Table 4.2a Power Generation Rates as A Function of Excess Air Ratio at Biogas Volume Flow rate 140L/min ... 42
Table 4.2b Power Generation Rates as A Function of Excess Air Ratio at Biogas Volume Flow rate 160L/min ... 42
Table 4.2c Power Generation Rates as A Function of Excess Air Ratio at Biogas Volume Flow rate 180L/min ... 43
Table 4.2d Power Generation Rates as A Function of Excess Air Ratio at Biogas Volume Flow rate 200L/min ... 43
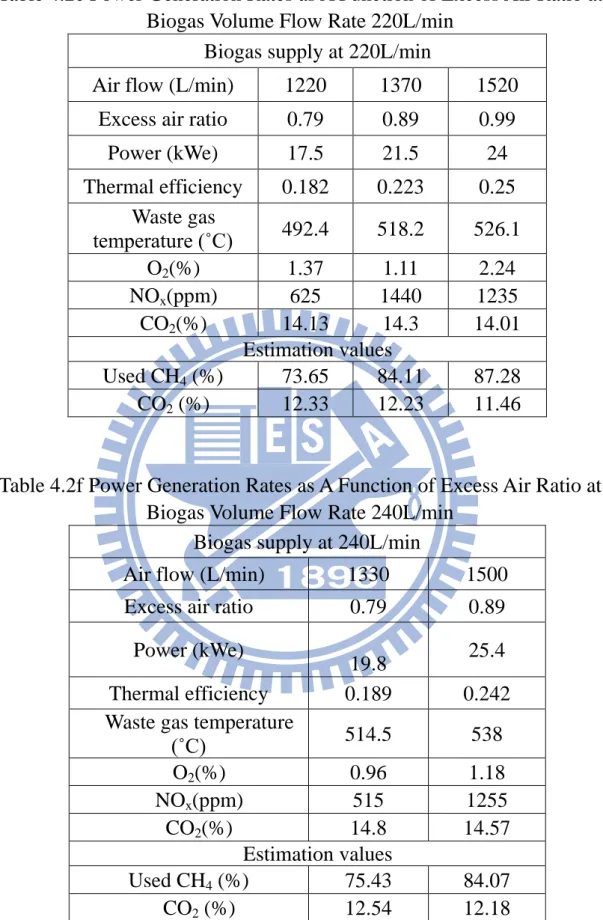
Table 4.2e Power Generation Rates as A Function of Excess Air Ratio at Biogas Volume Flow rate 220L/min ... 44
Table 4.2f Power Generation Rates as A Function of Excess Air Ratio at Biogas Volume Flow rate 240L/min ... 44
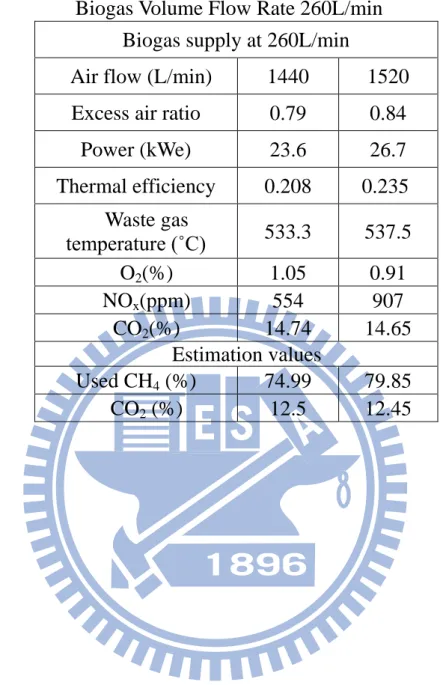
Table 4.2g Power Generation Rates as A Function of Excess Air Ratio at Biogas Volume Flow rate 260L/min ... 45
Table 4.3 The Maximum Excess Air Ratio of Biogas Flow Rate with 60% and 73% CH4 of Biogas. ... 47
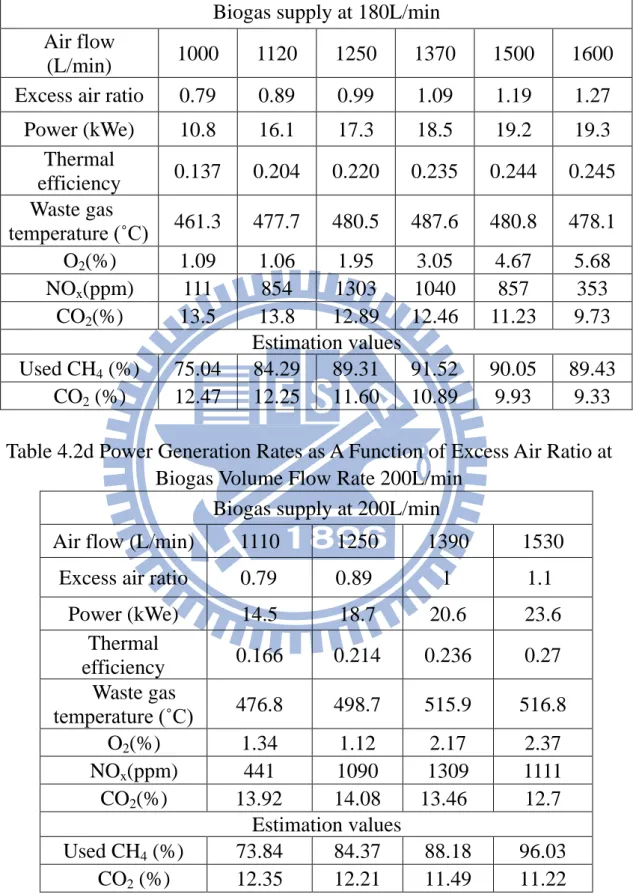
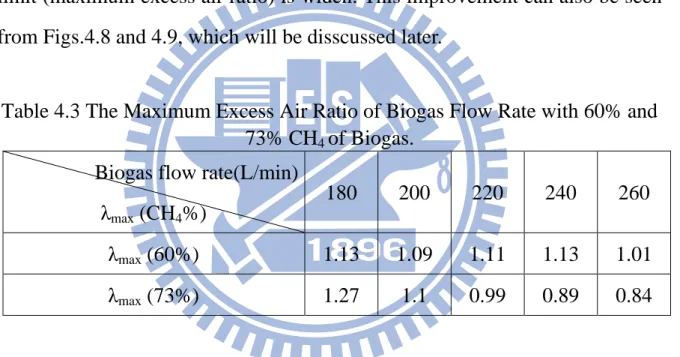
Table 4.4a Power Generation Rates as A Function of Excess Air Ratio at Biogas Volume Flow rate 180L/min with 60% CH4 [3] ... 50
Table 4.4b Power Generation Rates as A Function of Excess Air Ratio at Biogas Volume Flow rate 200L/min with 60% CH4 [3] ... 50
ix
Table 4.4c Power Generation Rates as A Function of Excess Air Ratio at Biogas Volume Flow rate 220L/min with 60% CH4 [3] ... 50 Table 4.4d Power Generation Rates as A Function of Excess Air Ratio at Biogas Volume Flow rate 240L/min with 60% CH4 [3] ... 51 Table 4.4e Power Generation Rates as A Function of Excess Air Ratio at Biogas Volume Flow rate 260L/min with 60% CH4 [3] ... 51 Table 4.5a Power Generation Rates as A Function of Excess Air Ratio at Biogas Supply Rate 140L/min and Inlet Gas Temperature 80~120℃ .... 54 Table 4.5bPower Generation Rates as A Function of Excess Air Ratio at Biogas Supply Rate 160L/min and Inlet Gas Temperature 80~120℃ .... 54 Table 4.5cPower Generation Rates as A Function of Excess Air Ratio at Biogas Supply Rate 180L/min and inlet gas temperature 80~120℃ ... 55
x
LIST OF FIGURES
Fig. 1.1 Carbon dioxide emissions avoided via the use of renewable energy
sources in Germany 2009. [26] ... 63
Fig. 1.2 Simple Carbon Cycle for Biogas [3] ... 63
Fig. 1.3 Scope of this Research ... 64
Fig. 2.1 Range of Capacities for the Power Generators ... 65
Fig. 2.2 Values of Power Generators ... 65
Fig. 3.1a Experiment Layout ... 66
Fig. 3.1b Waste Heat Recovery Layout ... 66
Fig. 3.2 Four stroke diesel engine ... 67
Fig. 3.3a VA-400 flow sensor ... 68
Fig. 3.3b VA-400 flow sensor data ... 68
Fig. 3.4a TF-4000 Flow meter ... 69
Fig. 3.4b TF-4000 Flow Meter Data ... 70
Fig. 3.5 K-Type Thermocouple ... 71
Fig. 3.6 HM5000Gas Analyzer ... 71
Fig.3.7 Guardian Plus Infra-Red Gas Monitor ... 72
Fig 3.8 Heat Exchanger ... 72
Fig. 3.9a CompactDAQ Chassis ... 73
Fig. 3.9b NI 9203 Analog Input Module ... 73
Fig. 3.9c NI 9211 Analog Input Module ... 74
Fig.3.10 Temperature Monitor ... 74
Fig.3.11 Center 311 Humidity Temperature Meter ... 75
Fig. 4.1 Power generation v.s. excess air ratio at different biogas supply rates ... 76
xi
Fig. 4.2 Thermal efficiency v.s. excess air ratio at different biogas supply rates ... 76 Fig. 4.3 Waste gas temperature v.s. excess air ratio with different biogas supply rates ... 77 Fig. 4.4 O2 concentration in waste gas v.s. excess air ratio with different biogas supply rates ... 77 Fig. 4.5 CO2 concentration in waste gas v.s. excess air ratio with different biogas supply rates ... 78 Fig. 4.6 NOx concentration in waste gas v.s. excess air ratio with different biogas supply rates ... 78 Fig. 4.7 Estimated CH4 consumption ratios in combustion v.s. excess air ratio with different biogas supply rates ... 79 Fig. 4.8 Power generation with different methane concentrations of biogas ... 79 Fig. 4.9 Thermal efficiency with different methane concentrations of biogas ... 80 Fig. 4.10 Waste gas temperature with different methane concentrations of biogas ... 80 Fig. 4.11 Power generation of biogas supply rate 180 L/min v.s. excess air ratio with different inlet gas temperatures ... 81 Fig. 4.12 Thermal efficiency of biogas supply rate 180 L/min v.s. excess air ratio with different inlet gas temperatures ... 81 Fig. 4.13 Power generation of biogas supply rate 160 L/min v.s. excess air ratio with different inlet gas temperatures ... 82 Fig. 4.14 Thermal efficiency of biogas supply rate 160 L/min v.s. excess air ratio with different inlet gas temperatures ... 82
xii
Fig. 4.15 Power generation of biogas supply rate 140 L/min v.s. excess air ratio with different inlet gas temperatures ... 83 Fig. 4.16 Thermal efficiency of biogas supply rate 140 L/min v.s. excess air ratio with different inlet gas temperatures ... 83
1
Chapter 1
Introduction
1.1 Motivation and Background:
Global warming and energy shortage crisis are serious problems for human beings now. Therefore, controlling the emissions of greenhouse gases and finding alternative energy become international issues.
Recently, people pay a lot of attention to renewable energy, including hydropower, solar thermal energy, wind energy, geothermal energy and biomass energy. Renewable energy, which has a great potential substitution of fossil fuel, is an important part of carbon offset, it not only can avoid the carbon dioxide produced from the fossil fuel (see Fig. 1.1), but also has renewability to handle energy shortage crisis.
Biomass energy, a kind of renewable energy, becomes more popular due to its contribution to energy supply and environmental protection in the same time. It comprises about two thirds of total renewable energy. The source of biomass energy can be derived from plant or animal organic matter, such as waste, wood, gas, etc.
Biogas is one of the biomass energy resources, it can be generated from many places, including landfill, farm biogas plant and sewage digester. Different sources of biogas contain different components, which is illustrated in Table 1.1. Concerning with the reduction of carbon dioxide emission and high dependence on import energy, which was 98.2% in 1998, 99.0% in 2003, and 99.3% in 2008 [1], in Taiwan, biogas appears to be an attractive energy resource.
2
Table1.1 Biogas Contents from Different Biogas Producing Plants [2]
Animal manure of the farm can produce biogas after anaerobic treatment. The main components of the biogas are methane (CH4) and carbon dioxide (CO2) with relatively little amounts of nitrogen (N2), hydrogen (H2), ammonia (NH3), hydrogen sulfide (H2S) and organic compounds. Methane inside the biogas is a flammable fuel, therefore, such biogas can be used as renewable fuel, provided that methane content is sufficient enough.
The main greenhouse gases in atmosphere are water vapor, carbon dioxide, methane, nitrous oxide, ozone and chlorofluorocarbons. When the earth is radiated by the sun light, part of radiation is reflected to the outer space, another part of radiation is absorbed by the earth’s surface. These greenhouse gases can absorb the heat energy emitted by the earth surface, leading to the increasing temperature of atmosphere. There are many benefits using the farm biogas. First of all, untreated manure contains nitrous oxide (NOx), carbon dioxide (CO2) and methane (CH4) gases. The greenhouse potential of methane is 23 times of the carbon dioxide. If those gases emit into the surroundings, the impact to the environment is huge. Furthermore, the biogas is a carbon neutral energy resource. Unlike fossil fuels that releases carbon dioxide which is captured by billion years ago, carbon dioxide released by the biogas which is captured recently. The carbon in the biogas comes from the photosynthesis through plants, and after burning it, the carbon dioxide goes back to the
3
surroundings, so the net of carbon amount in this cycle is zero (see Fig. 1.2 for the illustration). However, the carbon of fossil fuels is out of the carbon cycle because they are captured long time ago, and its combustion leads more carbon dioxide content in environment. For this reason, biogas can make balance of greenhouse gas emissions in earth. In other words, biogas is an environmentally friendly fuel. Second, animal manure has lots of organic matters, which lead the river quality to become deteriorated, and wastewater treatment can avoid the further pollution. Third, biogas can generate power that has great potential to reduce the amount of import energy by this way in Taiwan. Last, biogas is a renewable energy resource. The carbon of the biogas comes from photosynthesis through plants. As long as the sun continues emitting light, the energy supply will not stop. Beside, according to the survey of Tsai and Lin [4], with a practical basis of the total swine population from the farm scale of over 1000 heads, the usage of bio-energy from swine manure management showed following benefits: emissions of methane reduce 21.5 Gg, total electricity is generated of 7.2 × 10⁷kW-h per year, equivalent to electricity charge saving of USD 7.2 × 10⁶, and carbon dioxide mitigation is of 500 Gg per year. To sum up, biogas is a renewable and green alternative energy fuel.
This laboratory has been awarded a three-year research project by National Science and Technology Program for Energy from 2010 to 2012. The project is named as Development the technology of agricultural waste bioconversion to
biogas for electricity generation and carbon dioxide elimination by microalgae.
Constructing a pilot biogas plant is the ultimate goal of this project. The project is divided into four subprojects. The subproject 1 is to upgrade the utilization efficiency of biogas by removing H2S and CO2 to improve the biogas generation rate. In the subproject 2, the desulfurized biogas of subproject 1 will
4
be utilized to operate the biogas engine to produce electricity under different monitoring parameters. The subproject 3 is to produce biodiesel from high lipid-content algae utilizing waste CO2 either from the engine flue gas or the biogas itself. The purpose of subproject 4 is to research the operating conditions which will affect biogas production rates and methane concentrations emission during the anaerobic processes.
This study is originated from the subproject 2 mentioned above. In the first year, the subproject uses a 30kW generator as a vehicle to build a waste heat recovery system and to analyze the power supply and efficiency for the system in a small scale. In the second year, based on the achievements and experience from the first year, a pilot plant is constructed for biogas and power plant in Taiwan Sugar swine farm. In the meantime, a fuzzy control system is also installed to enhance the performance. In the third year, a completely self-operated biogas plant with CHP system is constructed. By 2010, this subproject is capable to generate 90,000kW-h electricity per year, equivalent to electricity charge saving of 270 thousand NT dollars, in an order of 2000 pigs.
In the first year, Lin [3] tested different air-fuel ratio for 30kW generator with 60% methane concentration of biogas in a small swine farm in Miaoli. The oxygen-enriched combustion and heat recovery were also applied to his research. The results showed that the efficiency of the generator is improved by using oxygen-enriched combustion and heat recovery system. For the following years, the biogas plant is enlarged in Taiwan Sugar swine farm in Taichung. This study mainly will test the scale-up effect based on Lin’s research [3].
5
1.2 Literature Review
Chen et al. [1] analyzed renewable energy situation in Taiwan, such as biomass energy, solar energy, wind power, geothermal energy and hydropower etc. They indicated that renewable energy has not yet fully developed in Taiwan because the fossil energy is cheaper than renewable one. However, the renewable energy will become more competitive in the energy market since Legislative Yuan passed ―Renewable Energy Development Bill‖ in June 2009. Besides, the promotion of the renewable energy will offer positive economic benefits for the related industry.
Rasi et al. [2] researched biogas component and variation in landfill, sewage treatment plant sludge digester, and farm biogas plant to analyze its potential used as bio-energy. They found that the biogas compounds vary with different biogas plants: carbon dioxide ranges from 36% to 41%, methane from 48% to 65%, nitrogen from 1% to 17% and oxygen content is less than 1%. Sewage digester biogas contains highest methane content, landfill biogas contains lowest methane and highest nitrogen contents in winter. The total volatile organic compounds (TVOCs) range from 5 to 268 mg/m3, and the farm biogas plant has the lowest TOVCs. The sulphur compounds are found in all three places.
Lin [3] tested different air-fuel ratios for 30kW generator with 60% methane concentration of biogas in a small swine farm in Miaoli. The oxygen-enriched combustion and heat recovery were also applied to his research. The results showed that a higher power output and better thermal efficiency can be achieved by a greater conversion of CH4 in the combustion process. The engine performances are not improved much by 1% oxygen-enriched air, but
6
with 3% oxygen-enriched air, the maximum power generation and thermal efficiency are increased, especially the engine now can be operated normally at a lower limiting fuel supply rate. The heat recovery system is used to heat water, leading to an improvement of overall efficiency.
Tsai and Lin [4] surveyed bio-energy from livestock manure management in Taiwan. With a practical basis of the total swine population from the farm scale of over 1000 heads, the analysis showed following benefits: emissions of methane reduce 21.5 Gg, total electricity is generated of 7.2 × 10⁷ kW-h per year, equivalent to electricity charge saving of USD 7.2 × 10⁶, and carbon dioxide mitigation is of 500 Gg per year.
Su et al. [5] established greenhouse gas production data from anaerobic livestock wastewater treatment processes in Taiwan, and made the difference between the livestock wastewater treatment system in Taiwan and that presented by the IPCC. The data revealed that anaerobic wastewater treatment systems of pig and dairy farms emit 0.768 and 4.898 kg CH4, 0.714 and 4.200 kg CO2, and 0.002 and 0.011 kg N2O per year per head during three temperature periods. Because animal manure is diluted before being treated with a solid/liquid separator and an anaerobic wastewater treatment system, the average emissions rates of CH4 in the selected pig and dairy farms are lower than the limits imposed by the IPCC.
Yang et al. [6] estimated of methane and nitrous oxide emissions from animal production sector in Taiwan during 1990~2000. Methane emission from enteric fermentation of livestock was 30.9 Gg in 1990, increased to 39.3 Gg in 1996, and decreased to 34.9 Gg in 2000. Methane emission from the waste management was 48.5 Gg in 1990, 60.7 Gg in 1996, and 43.3 Gg in 2000. In the case of poultry, methane emission from enteric fermentation and waste
7
management were 30.6~44.1 ton and 8.7~13.2 Gg. Nitrous oxide emission from waste management of livestock was 0.78 ton in 1990, 0.86 ton in 1996, and 0.65 ton in 2000. Nitrous oxide emission from waste management of poultry was higher than that of livestock with 1.11 ton in 1990, 1.68 ton in 1999, and 1.65 ton in 2000.
Saiful Bari [7] used carbon dioxide and nature gas, which contained about 96% methane, to simulate the operation of diesel engine in dual-fuel mode with biogas containing various percentages of carbon dioxide. They found out when biogas contains more than 40% carbon dioxide, the engine runs harshly. The trend of bsfc (brake specific fuel consumption) curve decreases in 20 to 30 per cent carbon dioxide region, but raises beyond certain (20 to 30) per cent of carbon dioxide region. It is because the carbon dioxide can be dissociated into carbon monoxide and oxygen under high temperature, and the carbon monoxide is comparatively fast burning gas than other alternative fuels, in the meantime, the oxygen from the dissociation increases the concentration of oxygen in the gas air mixture, leading to reducing the ignition delay and enhancing the combustion of unburned carbon particles. But when the carbon dioxide content is beyond certain region, the carbon dioxide becomes higher for the superfluous carbon dioxide remains undissociated, making the curve of bsfc to rise with an increase carbon dioxide concentration.
Duc et al. [8] used a small IDI biogas premixed charge diesel dual fuelled CI engine to test Diesel fuel substitution, engine performance, energy consumption and long term operation. They obtained following results. First, although the diesel dual fuel (DDF) mode has lower energy conversion efficiency, it can be offset by the reduced fuel cost of biogas over diesel. At low and medium loads, the DDF engine produces higher UHC (unburnt hydrocarbon) and less soot,
8
leading to a reduction in efficiency. When engine load increases to full load the conversion efficiency is good as that in diesel fuelling. Second, the engine operates in DDF mode has the lower exhaust gas, higher lube oil and higher cooling water temperatures than those temperatures in diesel mode.Last, as a gas mixer is installed, the temperatures of oil and cooling water increases and lube oil sucks to the cylinder, resulting in high lube oil consumption. So, the engine cannot withstand the higher thermal load under DDF mode at the engine speeds and loads proposed for diesel fuel.
Tippayawong et al. [9] used biogas and diesel mixed fuel to feed a small diesel engine and examined its endurance over 2000 hours. The results showed that engine has 7% of higher power output and higher efficiency compared to that in normal diesel operation.
Alasfour [10] used 30% iso-butanol-gasoline blend and preheated the inlet air to investigate the NOx emission in a spark ignition engine. The results showed that the maximum level of NOx emission is reduced by 9% in 30% iso-butanol-gasoline blend comparing to gasoline. When the inlet air temperature increases from 40 to 60°C, the NOx emission will increase 10% at a fuel/air equivalence ratio of 0.9.
Porpatham et al. [11] tested the effect of CO2 concentration in biogas on the performance of constant speed spark ignition (SI) engine. A lime water scrubber was used to absorb carbon dioxide (CO2) in biogas. They found when carbon dioxide (CO2) in biogas is reduced from 41% to 30%, then 20% of engine performance is improved, unburned hydrocarbons (HC) is reduced and lean limit of combustion is extended.However, such improvement occurs just in the lean-fuel region. Increasing methane concentration plays a significant role in lean-fuel region because the flame velocities are low in such region. There is
9
no benefit for power and efficiency on the rich-fuel side due to incomplete combustion of engine.
Borjesson and Berglund [12] analyzed the emissions of nitrogen oxides (NOx), carbon dioxide (CO2), carbon oxide (CO), sulphur dioxide (SO2), hydrocarbons (HC), methane (CH4), and particles from a life-cycle for different biogas systems on six different raw materials. They identified that the biogas systems emit lots of gases mentioned above, and the emissions are affected by the properties of the raw material digested, the energy efficiency of the biogas production, and the end-use technology. Between two biogas systems that provide an equivalent energy service, fuel-cycle emission may vary by a factor of 3–4, and for certain gases the factor by up to 11. There are extensively significant source of emissions, for example, waste-products or ley cropping.
Abd-Alla et al. [13] operated a high speed indirect injection dual fuel engine, using methane and sometimes propane as main fuel and Diesel fuel as pilot fuel. The effects of exhaust gas recirculation (EGR), diluents admission (N2 and CO2), and intake air temperature on combustion and emissions were concerned. The results showed that the admission of diluents reduce the NOx emissions, the higher intake temperature increases the NOx emissions but reduces the unburned hydrocarbon emission.
Tsagarakis [14] analyzed optimal number of energy generators for biogas utilization in wastewater treatment facility. The data of this analysis was based on the first generator for energy production from biogas, and it had been operated for 5.5 years. If one generator is used, the cost per kWh produced is 0.0876 €/kWh covering 15.9% of the facility’s needs. If two generators are used, the average cost for energy production is 0.0881€/kWh covering 32.6% of the facility’s needs. The estimations of six generators have been made. The
10
economic analysis is calculated by total annual economic cost, which is the sum of the annuitized construction cost and the annual operation and maintenance costs. The results showed that the cost of each kWh produced may increases when the number of generators is increased, the cost decreases when the lifetime of generator increases.
Semin et al. [15] compared the cylinder pressure and maximum pressure of the compressed natural gas engine with original diesel engine. The result showed that the transform of diesel engine into compressed natural gas engine decreases the cylinder pressure.
Torregrosa et al. [16] tested the effect of coolant and inlet charge temperature on the emission reduction and performance of DI Diesel engines. The coolant temperature ranged from 65 to 97℃. The intake charge temperature ranged from 44 to 68 ℃. The results show that the coolant temperature has low effects on engine operation. There is no effect at medium or higher load. The NOx emissions decrease and HC emissions increase for lower wall temperature at low loads. Intake air temperature influences NOx formation for all the loads, as the temperature increases the NOx emissions increases. But its influence on HC emissions is restricted to low loads, as the temperature increases the HC emissions decrease. For engine, HC emissions are the result of incomplete combustion, and the higher HC emissions imply the lower fuel conversion efficiency.
Zarante et al. [17] operated four-cylinder, flexible fuel engine, using gasoline and nature gas as fuels, to evaluate the exhaust emissions of carbon monoxide (CO) and carbon dioxide (CO2). Due to the low carbon-hydrogen ratio of nature gas with regard to gasoline, the CO2 emission of nature gas is less than that of gasoline. Also the CO emission of nature gas is less than that of gasoline,
11
because the engine can operate with leaner mixtures when natural gas is used instead of gasoline.
Ga et al. [18] used biogas-gasoline hybrid engine to test the conversion efficiency of the biogas. The results showed that 1 m3 of biogas can produce 1kW-h electricity and reduce 1kg CO2 emission in the atmosphere.
Cho et al. [19] made a review for spark ignition of natural gas engines. In order to meet the emission standards and consider the stable combustion of engine, several methods can be used. First, lean burn is an effective way to reduce NOx emissions, but for recovering power output losses, turbocharging technology should be considered. Second, stoichiometric natural gas engine can equip with three-way catalyst to convert CO, HC and NOx, however, air-fuel ratio controller is needed. Third, EGR can improve knocking situation by reducing combustion temperature.
Huang and Crookes [20] diluted natural gas by using CO2 to simulate biogas as fuel in single-cylinder spark-ignition engine. The fraction of CO2 in simulated biogas was ranged from 0 to about 40%. They tested the effects of CO2 fraction, relative air-fuel ratio, engine speed and compression ratio on the engine performance and exhaust gas emissions. The measured results included power, thermal efficiency, exhaust temperature and mole fractions of the emissions CO, NOx and unburnt hydro-carbon in exhaust gases. The following are conclusions obtained from experimental results: First, increasing the fraction of CO2 in biogas can lower the NOx emission and enable the compression ratio to be increased. However, it would reduce cylinder pressure that results in the reductions of power and thermal efficiency, and the increases of unburnt hydrocarbon emissions at the same time. Second, the CO emissions are low and change little when running with fuel-lean mixture. As running
12
with fuel-rich mixture, the CO emissionsincrease sharply when CO2 fraction is above 30% due to incomplete combustion. The CO emissions are almost unaffected by compression ratio and engine speed. Third, when the compression ratio becomes higher, the brake mean effective pressure, brake efficiency and emissions of NOx and unburnt hydrocarbon become higher. But when the compression ratio is above 13:1, the power and thermal efficiency increase slightly and the emissions of CO increase. As the compression ratio is further above 15:1, the detonations occur. Fourth, the highest power and thermal efficiency occur with compression ratio between 13:1 and 15:1 and the relative air-fuel ratio between 1.05 and 0.95. In this range, the emissions of CO and unburnt hydro-carbon are low but the NOx emissions are relatively high.
Nathan et al. [21] converted a single-cylinder, diesel engine to operate in homogeneous charge compression ignition (HCCI) mode with acetylene as fuel. They tested the effects of intake air temperature and exhaust gas recirculation (EGR) on the engine performance and exhaust gas emissions. The intake air was heated by an electric heater in the range of 40~110℃ from no load to brake mean effective pressure(BMEP) of 4 bar. The results showed that the intake air temperature and amount of EGR have to be controlled according to engine output. At high engine output, engine is very sensitive to the intake air temperature and EGR. In order to get greater brake thermal efficiency, precise control is required. It is observed that the best charge temperature is reduced as BMEP increases, because the elevation of BMEP will lead to an increase of engine temperature and make the mixture become richer. When the mixture is rich, the self-ignition temperature reduces and the combustion rate increases. Besides, at high BMEPs, using EGR will lead to knock.
13
Badr et al. [22] carried out a parametric study on the lean misfiring and knocking limits of gas-fueled spark ignition engine. They tested Ricardo E6 engine, using propane and liquefied petroleum gas (LPG) as fuels. The parameters included engine speed, compression ratio, spark timing, intake temperature, intake pressure, and relative humidity of intake air. The following are experimental results: Advancing the spark timing leads to the reduction of lean misfire and knocking limit. For low engine speeds, when the intake temperature increases, the lean misfire limit decreases. For high speeds, when the intake air temperature is up to 70℃ the lean misfire limit increases, beyond 70℃ the lean misfire decreases. As the relative humidity of the intake air increases, the lean misfire limit increases because the water vapors as a diluents will damp down the reaction rates during compression and combustion processes.
Sridhar et al. [23] reveled the misunderstanding when gas as a piston engine fuel. They converted multi-cylinder diesel engine into spark ignition engine, and the compression ratio ranged from 11.5:1 to 17:1. The results showed that the engine can run smoothly without auto-ignition tendency at high compression ratio (17:1). Besides, the engine can get higher efficiency and more brake power when working at higher compression ratio. However, comparing with diesel mode, the maximum de-rating in power is 16% and the overall efficiency drops down by almost 32.5% in gas mode. The analysis revealed that excess energy loses to coolant due to combustion chamber design. In order to improve the efficiency, the combustion chamber design for gas fuel is needed in the future.
Tricase and Lombardi [24] evaluated the development of biogas in Europe and Italy. The amount of biogas increases gradually, and the usage of biogas
14
depends on biogas quality. The percentage of biogas for generating electricity is 2/3 of total amount, and for generating heat is 1/3 nowadays. While Great Britain and Germany are the main producing countries so far, France has the highest production potential in the future. Most of Italian biogas is from landfills, and the biogas from animal waste is only small percentage of total.
Chung et al. [25] tested the chemical absorption and a biological oxidation process to remove high H2S concentrations. The results suggested that the liquid flow rate in the biological oxidation reactor was controlled at 3 mL/min, the volume ratio of biological reactor to chemical reactor was 13.5:1 when 150 g-S/m3/h of inlet H2S loading was introduced to the system.
1.3 Scope of Present Study
The scope of this research is presented in Figure 1.3. The goal of this research is to test a 30kW-generator in a swine farm.
The energy balance for overall biogas into the energy cycle is measured and calculated. The treatments of biogas include three-step piggery wastewater treatment system and H2S removal system, and all of them need energy to operate. So the net energy output from biogas-powered generator should deduct to the energy consumption by the systems.
The methane concentration of biogas can be affected by the organics concentration in wastewater. The usage of water to clean and cool the pigpen changes the organics concentration in wastewater, leading to variation of methane (CH4) concentration in biogas. So the first task of this study is to test the effects of different methane (CH4) concentrations in biogas on the generator performance with different fuel flow rates and excess air ratios.
15
These results will compare with other corresponding experimental ones.
Secondly, build waste heat recovery system to preheat inlet gases (the mixture of biogas and air) under different temperatures and analyzes the preheating influence on the generator performance.
16
Chapter 2
Biogas System in Swine Farm
2.1 Swine Manure Management
Swine production is very important in the agriculture of Taiwan. If the amount of wastewater produced by a pig is estimated as 20 liters per day, then the total wastewater produced by 6.6 million pigs (the total number of pigs in Taiwan) is 19 tons per day, making as the third most pollution source in Taiwan that is behind the sewage and industrial wastewater.
In 1987, the quality of waste water draining from livestock farms has to meet the governmental standards. Since then, a great variety of wastewater treatment technologies have been developed. Among them, the three-step waste treatment system developed by the Taiwan Livestock Research Institute (TLRI), which includes solid-liquid separation, anaerobic treatment and aerobic treatment (activated sludge treatment system), is regarded and accepted as one of the best systems in Taiwan, and has been extended to hog farms since 1987. Via the three-step treatment, both the Biochemical Oxygen Demand (BOD) and Suspended Solids (SS) of treated water can be less than 100 mg per liter.
2.2 Three-step Piggery Wastewater Treatment (
TPWT)
The three-step piggery wastewater treatment system is based on a typical continuous plug-flow design, and the volume of raw wastewater remains constant over each 24-hour period. Under optimal operation conditions, wastewater thus flows into the system and is discharged continuously. Anaerobic treatment is conducted after solid/liquid separation, and occurs
17
inside of anaerobic basins covered with ―red-mud plastic cover‖ (1.2~1.8mm of thickness), made of a kind of PVC material, which is corrosion-resistant and gas-and-water impermeable. Anaerobic treatment is generally slower than forced aeration, but consumes less energy. The anaerobic treatment system of TPWT process can also salvage a part of chemical energy content of wastewater by generating methane, a useful fuel. The optimal hydraulic retention time is around 4–6 days, and BOD removal is expected to be more than 80%.
2.2.1 Solid-liquid Separation
Separation of the solid fraction from the wastewater is to reduce the content of solids for subsequent handling and treatment, and to recover the solids for using as fertilizer, etc. This physical process is accomplished by using various kinds of filters. The efficiency of this treatment is a 15-30% decrease in BOD and a 50% decrease in SS. The moisture content of the separated solids is 70-80%. An extruder is often added to reduce the water content of the solids to 70% or below so that the material is suitable for composting.
2.2.2 Anaerobic Treatment
Since hog wastes are biodegradable, biological treatment is generally an economical way of handling them. The horizontal tent-type anaerobic fermenter is a modification of the Red Mud Plastic (RMP) bag fermenter which was also developed by the Taiwan Livestock Research Institute. Among its merits are the fact that it is easy to construct, has a low investment cost, is easy to maintain, and can be separated into several divisions as desired. These fermenters can be sealed from either inside or outside. The four sides of RMP sheet, which make up the top of fermenter, are in tubular shape, so that PVC pipes may be inserted inside them to give extra strength. The strengthened
18
sheet is then fixed to the wall of the fermenter with hooks.
The hydraulic retention time (HRT) is calculated according to the amount of water used to wash the pig houses, as the following the formula:
HRT =
A 1:3 ratio of manure to washing water is suggested, which can easily be achieved with a flushing tank system. According to the work by Hong (1985), the daily excreta of a 100-kg pig is around 5 liters, so the total wastewater from one pig may be estimated as 20 liters. A HRT of 12-15 days is common for hog wastewater treatment.
A tent-type fermenter should consist of no fewer than two digesters. The volume of the first digester is usually 1.2 times of the daily wastewater. Both acidogenesis and sedimentation take place in this first digester. Most of the methanogensis reaction occurs in the rear digester(s). Biogas may be collected for the use as fuel. The excreta of each pig can generate 0.1-0.3 m3 of biogas per day. Biogas may be used in cooking stoves, water heaters, water pumps, electric power generators, gas lamps, warming piglets, vehicles, mowers, and incinerators for animal bodies, etc.
2.2.3 Aerobic Treatment
There are many kinds of aerobic treatments that may be utilized for livestock wastewater. Considering the environmental conditions of Taiwan in subtropical climate, activated sludge processing and oxidation ditches are recommended. In aerobic treatment, organic matter is decomposed solely through aerobic oxidation.
Activated sludge processes are versatile and flexible. Effluent of any desired quality can be produced by varying the processing parameters. These
19
processes require less land but more skilled management than simpler processes, such as oxidation ditches. Activated sludge is a complex biological mass, resulting from when organic wastes are aerobically treated. The sludge will contain a variety of heterotrophic microorganisms, including bacteria, protozoa, and higher forms of life. The relative abundance of any particular microbial species will depend on the type of waste that is being treated, and the way in which the process is operated. For optimum treatment, raw waste must be balanced nutritionally. In three-step treatment, most of the easily biodegradable matter has already been decomposed in the anaerobic digester, therefore, operating an activated sludge treatment requires intensive care for good performance. It is better to control the BOD of anaerobic effluent at around 1000 mg/L. The growth conditions for microorganisms in activated sludge tanks are usually measured according to the mixed liquor suspended solids (MLSS) and sludge volume index (SVI). The HRT for an aerobic tank is normally 1.0-1.5 days.
While activated sludge tanks have a water depth of 2-5 m, this should not exceed 1.5 m in oxidation ditches. Oxidation ditches, therefore, require a larger land area, but have the advantages of being easy to operate and of generating less sludge.
A final clarifier to settle the activated sludge before the discharge of treated water is required in aerobic treatment. The settled sludge may be removed by mechanical methods for return to the aerobic unit, or be dehydrated for disposal. Usually the HRT in the clarifier should not exceed 6 hours.
2.3 Utilization of Biogas
20
sulfide (H2S), which can corrupt the power generator, so the desulfurization process is needed. The common method for reduction of hydrogen sulfide is biological desulfurization. In the process, the H2S is absorbed in water and then its content is mitigated greatly by biological method. After desulfurization process, the humidity of biogas is very high due to the usage of water in such process. In this project, the biogas will pass through the active carbon tower to absorb water vapor in the biogas, then, this dehumidified biogas will store in a red plastic bag.
After above processes, biogas can be used either for the production of heat only or for the generation of electric power. Normally heat and power are produced in the same time for higher efficiency. Such power generators are called combined heat and power (CHP) generation plants, and normally use a four-stroke or a Diesel engine. A Stirling engine or gas turbine, a micro gas turbine, high- and low- temperature fuel cells, or a combination of a high-temperature fuel cell with a gas turbine are alternatives.
Biogas can also be used by burning it to produce steam, by which can drive an engine in the Organic Rankine Cycle (ORC) or the Cheng Cycle, the steam turbine, the steam piston engine, or the steam screw engine.
Figure 2.1 shows the range of capacities for the power generators, which are available on the market for the pilot-plant or industrial scale. The efficiency is defined as the ratio of the electrical power generated to the total energy content in the biogas. Efficiency figures are also provided by different manufacturers. Small-capacity engines generally can result in the lower efficiencies than that of high-capacity engines.
The generated current and heat can supply to the bioreactor itself, associated buildings, and neighboring industrial companies or houses. The power can be
21
fed into the public electricity network, and the heat into the network for long-distance heat supply. Vehicles can sometimes be driven by the power or the heat.
2.4 Engines
Figure 2.2 lists some engines that can be operated with biogas. These have been improved during the recent years by following the development works inspired by the worldwide boom in biogas plants. The performance by some manufacturers even has already exceeded that of those given in this figures. 2.4.1 Four-stroke Gas Engine and Diesel Engine
Today’s four-stroke biogas engines were originally developed for natural gas and are therefore well adapted by the special features of biogas. Their electrical efficiencies normally do not exceed 34~ 40%, as the nitrogen oxide (NOx) output has to be kept below the prescribed values. The capacity of the engines ranges from 100 KW to 1 MW.
Four-stroke biogas engines often run in the lean-burn range (ignition window 1.3 < λ < 1.6, λ = air-fuel ratio/stoichiometric air-fuel ratio), where the efficiency is expected to drop. The efficiency of lean-burn engines with turbocharger is 33~ 39%. The NOx emissions can be reduced, however, by a factor of 4 in comparison to ignition (by compression) oil Diesel engines, and the limiting values can be met without further measures. Since the engines tend to knock with varying gas qualities, a methane content of at least 45% in biogas should be ensured.
In small agricultural plants, ignition oil Diesel engines are frequently installed. These engines are more economical and have a higher efficiency than four-stroke engines in the lower capacity range. However, higher NOx
22
emissions are produced by Diesel engine. Their lifetimes usually are given as 35,000h of operation.
In general, Diesel engines burning gas fuel can be operated by direct injection because pre-chamber engines develop hot places, resulting in uncontrolled spark failures with biogas. Owing to the internal formation of gas mixtures, Diesel engines can be faster controlled. The ignition oil Diesel engine is operated ideally at λ < 1.9. The efficiency is then up to 15% better than that in a four-stroke engine.
2.4.2 Stirling Engine
An alternative to the commonly used four-stroke and the Diesel engines is the Stirling engine. The efficiency of the Stirling process is closest to that of the ideal cycle. The Stirling engine has been recommended for power generation for many years, but is seldom realized on an industrial scale because of technical problems in details. Power generated from biogas in Stirling engines is not known yet in industrial scale installations.
2.4.3 Gas Turbine
Biogas can be converted to current via gas turbines of medium and large capacity (20 MW and more) at a maximum temperature 1200 °C. The tendency is to go to even higher temperatures and pressures, whereby the electrical capacity and thus the efficiency can be increased. The main parts of a gas turbine are the compressor, combustion chamber, and turbine.
Ambient air is sucked and compressed in the compressor and transmitted to the combustion chamber, where biogas is introduced and burnt with the compressed air. The flue gas that is so formed is passed to a turbine, where it expands and transfers its energy to the turbine. The turbine propels the compressor on the one hand and the power generator on the other hand. The
23
exhaust gas leaves the turbine at a temperature of approximately 400~600 °C. The waste heat can be recovered by driving a steam turbine downstream for heating purposes or for preheating the air that is sucked in.
2.4.4 Micro Gas Turbine
Micro gas turbines are small high-speed gas turbines with low combustion chamber pressures and temperatures. They are designed to deliver up to 200 kW electrical powers. For normal operation, the compressor sucks in the combustion air. The fuel is normally supplied to meet the combustion air in the combustion chamber. When biogas with a low calorific value is used, it must be adjusted to a flammable mixture of biogas and air before it is supplied into the combustion chamber.
The electrical efficiency of 15~25% for today’s micro gas turbines is still unsatisfactorily low. An attempt to increase the efficiency has been made by preheating the combustion air in heat exchange with the hot turbine exhaust gases. But great improvements are still necessary before micro gas turbines can be introduced into the market of industrial biogas plants. However, the coupling of a micro gas turbine with a micro steam turbine to form a micro gas-steam turbine seems already interesting and economical today because of its high electrical efficiency.
2.4.5 Fuel Cell
Comparing to combustion engines, the fuel cell converts the chemical energy of hydrogen and oxygen directly into current and heat. Water is formed as the reaction product.
In principle, a fuel cell works with a liquid or solid electrolyte held between two porous electrodes–anode and cathode. The electrolyte lets ions pass only and allow no free electrons from the anode to the cathode side. The electrolyte
24
is thus ―electrically non-conductive.‖ It separates the reaction partners and thereby prevents direct chemical reaction. For some fuel cells, the electrolyte is also permeable to oxygen molecules. In this case the reaction occurs on the anode side. The electrodes are connected by an electrical wire.
Both reaction partners are continuously fed to the two electrodes, respectively. The molecules of the reactants are converted into ions by the catalytic effect of the electrodes. The ions pass through the electrolyte, while the electrons flow through the electric circuit from the anode to the cathode. Taking into account all losses, the voltage per single cell is 0.6 ~ 0.9 V. The desired voltage can be reached by arranging several single cells in series, a so-called stack. In a stack, the voltages of the single cells are added.
Depending on the type of fuel cell, the biogas has to be purified to remove CO and H2S especially before feeding into the fuel cell. Only a small number of fuel cell plants, mostly pilot plants, are in operation for the generation of electricity from biogas.
25
Chapter 3
Experimental Apparatus and Procedures
3.1 Experiment layout
The Experiment layout is shown in Figure 3.1a. When the engine starts, the air and the biogas are sucked into the engine. The flow meters, marked by F1 and F2, measure the air and the biogas flow rates, which are controlled by valves at the engine inlets. The engine gets the power by combustion to drive the generator to produce the electricity. The thermocouple at the engine outlet measures waste gas temperature, and followed by the waste gas analyzer.
Figure 3.1b is the waste heat recovery system. The heat exchanger is installed following the exhaust pipe. The waste gases flow into the exchanger and transfer heat to intake gases (the mixture of biogas and air) in a separated pipe. We can control intake gas temperature by using a valve, located at the exchanger inlet, to regulate the amount of inlet gas into the heat exchanger. Part of inlet gas pass through the heat exchanger, another part of inlet gas flow into the engine directly. There are four thermocouples established at exchanger inlets and outlets. T1 and T2 measure the temperatures of waste gases before and after the heat exchanger. T3 and T4 are for inlet gas temperatures at inlet and outlet.
3.1.1 Engine
The original four-stroke diesel engine was operated with diesel fuel, using compression to ignite the fuel. In order to use biogas gas as fuel, the spark ignition system was installed to the engine. In other words, The ignition way was changed into spark ignition instead of comprssion one. For the original engine, the ideal power cycle is Diesel cycle. When the compression ignition
26
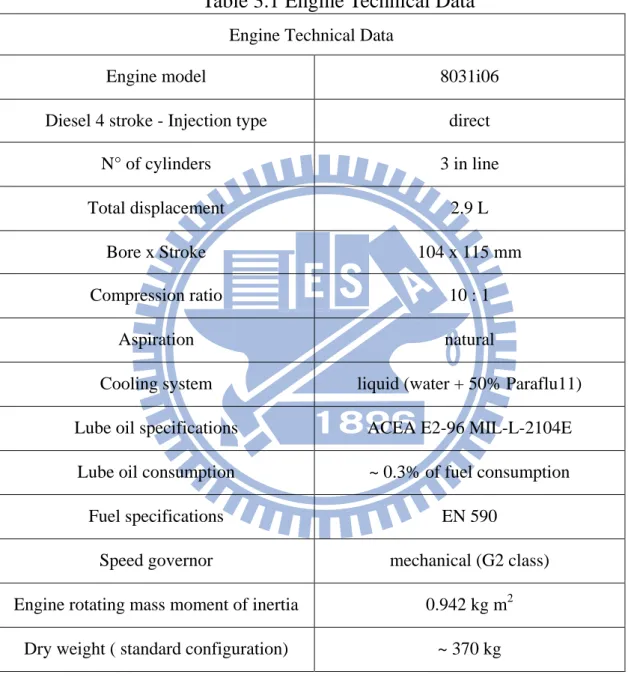
system is converted to spark ignition system, the ideal power cycle of present engine becomes Otto cycle. Figure 3.2 shows the refurnished engine and its detailed data can be referred in the following table.
Table 3.1 Engine Technical Data Engine Technical Data
Engine model 8031i06
Diesel 4 stroke - Injection type direct
N° of cylinders 3 in line
Total displacement 2.9 L
Bore x Stroke 104 x 115 mm
Compression ratio 10 : 1
Aspiration natural
Cooling system liquid (water + 50% Paraflu11)
Lube oil specifications ACEA E2-96 MIL-L-2104E
Lube oil consumption ~ 0.3% of fuel consumption
Fuel specifications EN 590
Speed governor mechanical (G2 class)
Engine rotating mass moment of inertia 0.942 kg m2
Dry weight ( standard configuration) ~ 370 kg
3.1.2 Air Flow Meter (VA-400)
The flow meter at air inlet is insertion type VA-400 flow sensor, whose range varies with the installed pipe diameter. In order to maintain the accuracy stipulated in the data sheets, the sensor must be inserted in the center of a
27
straight pipe section with an undisturbed flow progression. An undisturbed flow progression is achieved if the sections in front of the sensor and behind the sensor are sufficiently long, absolutely straight and without any obstructions such as edges, seams, curves etc. The minimum length ahead the sensor along the pipe should be 10 times of pipe diameter and 5 times behind sensor for the fully developed turbulent flow profile, so the measured flow rate can be accurate enough. Figures 3.3a and 3.3b show the flow meter and its detailed data.
3.1.3 Biogas Flow Meter (TF-4000)
The flow meter at biogas inlet is TF-4000 thermal-mass flow meter. Figure 3.4a and Figure 3.4b show the flow meter and its technical data. Operation principle is following: Two temperature sensors are put on along the flow path of gas. One of them is heated by a controlled power supply, and another one is not heated. The temperature difference between these two sensors should be always kept constant under a fixed mass flow rate. The different mass flow rate will result in different temperature difference. Therefore, it can deduce the mass flow rate of fluid flow by the quantity of power supply to maintain the temperature difference between these two sensors.
3.1.4 Thermocouple
A thermocouple is a sensor for measuring temperature. It consists of two dissimilar metals joined together at one end, which can produce a small unique voltage at a given temperature. This voltage is measured and interpreted by a thermometer. Thermocouples are available in different combinations of metals or calibrations. The four most common calibrations are J, K, T and E. Each calibration has a different temperature range and environment.
28
sensitivity approximately 41 µV/°C. The voltage of Chromel is positive relative to the one of alumel. It is inexpensive and its temperature is wide, ranging from −200 °C to +1350 °C.
In this research,four K-type thermocouples is used for measuring waste gas temperature and inlet gas temperature. Figure 3.5 shows the picture of K-type thermocouple.
3.1.5Gas Analyzer (HM5000)
Figure 3.6 is the gas analyzer, HM5000, used for measuring waste gas component data, which include the concentrations of oxygen, NOx and carbon dioxide.
3.1.6 Methane Concentration Analyzer
Figure 3.7 is guardian plus infra-red gas monitor, which is used for measuring the methane concentration of the inlet biogas.
3.1.7 Heat Exchanger
The heat exchanger (see Figure 3.8) is placed at waste gas outlet to heat the inlet gases. It consists of many small pipes of intake gases to enhance the heat transfer between the hot waste and inlet gases. The void space between the casting and pipes is for the passage of waste gases.
3.1.8 Data Acquisition
Data acquisition system can automatically collect signals from analog and digital measurement sources, such as sensors and devices, under tests. It uses a combination of PC-based measurement hardware and software to provide a flexible and user-defined measurement system. Usually, the researcher must calibrate sensors and signals before a data acquisition device acquires them. The specifications of these modules of National Instruments are shown in Table 3.2.
29
Table 3.2 Specifications of the Data Acquisition Modules
Model Signal Type Channels
Max Sampling
Rate
Resolution Signal Input Ranges
NI 9203 Current 8 500 k/s 16 bits ±20 mA
NI 9211 Thermocouple 4 15 k/s 24 bits ±80 mV
National Instruments, a leader in PC-based data acquisition, offers a complete family of proven data acquisition hardware devices and the powerful and easy-to-use software that can extend to many languages and operating systems. NI CompactDAQ delivers fast and accurate measurements in a small, simple, and affordable system. A CompactDAQ Chassis shown in Figure 3.9a, a product of NI, is adopted because of the following advantages: plug-and-play installation and configuration, AC power supply and USB cable connection, mounting kits available for panel, enclosure, DIN-rail and desktop development, A380 metal construction, more than 5 MS/s streaming analog input per chassis, and Hi-Speed USB-compliant connectivity to PC. Different types of signal process modules are chosen to complete the data acquisition system, including NI 9203 Analog Input Module, NI 9211 Thermocouple Differential Analog Input Module. Both are shown in Figure 3.9b and Figure 3.9c.
3.1.9 Temperature Monitor
Four k-type thermalcouples are installed to the temperature monitor (see Figure 3.10). The temperature variation can be seen and recorded by the monitor.
30
The Center 311 humidity temperature meter is shown in Figure 3.11. It is used to measure the humidity and temperatures of the environment and biogas.
3.2 The Theoretical Calculation
The following calculations include excess air ratio, thermal efficiency, theoretical mole fraction of CO2 in waste gas and theoretical percentage of consumed CH4. These will be used in the analyses of the following experiments.
The air-fuel ratio (AF) is defined as a ratio of the mole of air to the one of fuel in the combustion process. The stoichiometric reaction for combustion of methane with standard air is given as:
(3.1)
where x is the moles of CO2 in the biogas. The stoichiometric air-fuel ratio,
AFstoich, is:
(3.2)
On the other hand, AFact is the air-fuel ratio of the actual mole of air to mole of methane into the engine. Because the mole ratio is equal to the volume flow rate ratio, and the methane flow rate is equal to the biogas flow rate multiplying methane mole fraction in the biogas. AFact can be also expressed as: (3.3)
31
If the methane concentration of biogas is 73%, then the CO2 concentration of biogas is assigned as 27%:
x = 0.369, =
= 6.95
The air flow rate can be measured by air flow meter directly, whereas the methane flow rate is obtained by the measured biogas flow rate multiplied by the mole fraction of methane (both flow meters were demonstrated in sections 3.1.2 and 3.1.3). An example is given as follows: If the air and biogas flow rate were measured as 1400 and 240 liters per minute, respectively, then, the actal air-fuel ratiowith 73% CH4 is:
= 5.83 (3.4)
The Excess Air Ratio (λ) is the ratio of the actual mole of air used to the stoichiometric mole of air, defined as:
λ (3.5)
Note that the actual mole of fuel is equal to stoichiometric mole of fuel because in the engine experiments the fuel supply rate is fixed, whereas the air volume flow rate is changed. As a consequence, the excess air ratio is equal to ratio of AFact to AFstoich. Also remind that λ is reciprocal of equivalence ratio.
From those definitions, the resultant Excess Air Ratio (λ) for the above example is
32
(3.6)
The thermal efficiency is calculated for how much energy converting into electric power, its formulation is as following :
(3.7)
where Energy Input is calculated from the lower heating value (LHV) of methane, whose value is 50020kJ/kg, in the biogas. It is expressed as:
of CH4 (3.8)
The power generation of this study is the power output of biogas generator. When the engine push the generator to work, there are many heat loss between the generator and engine, so the exact power output of engine is impossible to calculate.
Where is the methane mass flow rate in biogas, and it is calculated by:
(3.9)
where is the density of methane, which is 0.717 kg/m3 at STP.
The theoretical consumed percentage of CH4 and the percentage of CO2 in waste gas in the combustion process are calculated as follows:
The balanced reaction is:
λ
33
where the NOx concentration (in an order of ppm) in waste gas can be neglected. x is the moles of CO2 in the biogas, and a and b are the moles of O2 and CH4, respectively, in waste gas. a can be calculated from the percent of O2 in waste gas as follow:
λ (3.11)
where λ is the total moles in waste gas, b is obtained from the atom balance as:
λ (3.12)
The theoretical percent of CO2 in waste gas can be calculated by:
λ (3.13)
The theoretical percent of used CH4 is defined as:
(3.14)
3.3 The Effect of Methane Concentration
The methane concentration of biogas can be affected by the organics concentration in wastewater. The variation of methane concentration will make impact on the generator performance. In order to gain a higher thermal efficiency, it is important to find the optimum excess air ratio under different methane concentration. The collected data are expected to be used for the long-term electricity generation.
34
The experimental parameters include methane concentration of biogas, biogas flow rate and excess air ratio. Before experiment, the methane concentration of biogas is measured. The biogas flow rates are set as 140, 160, 180, 200, 220, 240 and 260L/min, respectively. Under each fixed biogas flow rate, it tests different excess air ratios, ranged from 0.8 to 1.6. The collected data include biogas flow rate, air flow rate, power generation, waste gas temperature, methane concentration, oxygen concentration, carbon dioxide concentration and NOx concentration. The measurement starts when the engine is operating continuously until all conditions are ensured to be steady. Then, all measurements were tested twice and took an average. The experimental procedure is as follows:
1. Measure the methane concentration of biogas.
2. Operate the engine at least 20 minutes so it would be steady. 3. Fix the biogas flow rate at demanded quantity.
4. Control the air flow rate for specific excess air ratio. 5. Collect the corresponding data, mentioned above. 6. Repeat the procedure for different excess air ratio.
7. Repeat the above procedure for different methane concentration.
3.4 The Effect of Intake Gases Temperature
Preheating the inlet gas (the mixture of biogas and air) to different temperatures before the mixture gas enters the engine can increase the combustion efficiency. The measurements and controlling strategy are given previously.
The experimental parameters are inlet gases temperature, biogas flow rate and excess air ratio. The biogas flow rates are 140, 160, and 180 L/min, and
35
the excess air ratios ranged from 0.8 to 1.6. Under each fixed inlet gases temperature, it tests different biogas flow rates and each of it is accompanied with different excess air ratios.
After the engine is operated steadily, and collect the data include inlet gases temperature, waste gas temperature, biogas flow rate, air flow rate and power output. The experimental procedure is as follows:
1. Measure the methane concentration of biogas. 2. Set up heat exchanger at waste gas outlet.
3. Operate the engine at least 20 minutes to achieve steady state. 4. Control the inlet gases temperature to a fixed quantity.
5. Fix the biogas flow rate at demanded quantity. 6. Control the air flow rate for specific excess air ratio. 7. Collect the corresponding data, mentioned above. 8. Repeat the procedure for different excess air ratio.


![Table 4.4a Power Generation Rates as A Function of Excess Air Ratio at Biogas Volume Flow Rate 180L/min with 60% CH 4 [3]](https://thumb-ap.123doks.com/thumbv2/9libinfo/8244499.171458/64.892.112.823.387.978/table-generation-rates-function-excess-ratio-biogas-volume.webp)
