Cite this: RSC Advances, 2013, 3, 6865
A hybrid nanoparticle matrix for mass spectrometry3
Received 21st November 2012, Accepted 19th February 2013 DOI: 10.1039/c3ra22977g www.rsc.org/advances
Po-Han Li,aShin-Yi Huang,aYu-Chie Chen*aband Pawel L. Urban*ab
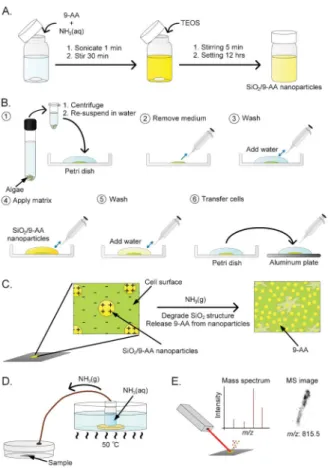
We demonstrate hybrid inorganic–organic nanoparticles —based on silicon dioxide and 9-aminoacri-dine— which can enhance mass spectrometric analysis and imaging in the negative-ion mode. The nanoparticles bind to the surface of cells while still in the liquid phase, which is followed by a controlled release of the organic matrix molecules triggered by alkaline ammonia vapours delivered to the specimen in a closed chamber. First, the method was optimized and tested using standard compounds as analytes. Second, the spatial resolution was verified using a natural fibre (diametery20 mm). Third, the method was used in the imaging of molecules present in the outer layer of large algal cells (Closterium acerosum). An important advantage of this method is that nanoparticles loaded with organic matrix can be applied to the biological cells as aqueous suspensions; hence, the release and spreading of metabolites can be limited during sample preparation for MALDI-MS. In addition, since this method does not involve spraying, exposure of experimenters to toxic aerosols is decreased.
1. Introduction
Matrix-assisted laser desorption/ionization (MALDI) is an analytical technique in which laser light is used to desorb and ionize molecules —previously co-crystallized with a chemical matrix— to enable mass spectrometric (MS) detec-tion of the resulting gas-phase ions.1,2One of the interesting features of this technique is the possibility of mapping chemical distributions of analytes in biological specimens. In fact, MALDI-MS has widely been used for mapping lipids,3–5
proteins,6–8 and small molecules9–11 in the samples such as tissues or single cells.12–17 Examples of powerful chemical matrices used in MALDI include a-cyano-4-hydroxycinnamic acid (CHCA), 2,5-dihydroxybenzoic acid (2,5-DHB), ferulic acid (FA), picolinic acid (PA), sinapic acid (SA), as well as 9-aminoacridine (9-AA), and 3-aminoquinoline (AQ). Before analysis, concentrated solution of a selected chemical matrix is applied onto the surface of the biological sample. One of the existing problems in MALDI imaging is the heterogeneous crystallization of MALDI matrices on the sample surface, which considerably decreases lateral resolution of the result-ing images, and often disables the possibility of performresult-ing single-cell studies. Homogeneous and reproducible applica-tion of MALDI matrices is critical for obtaining high-quality results using this technique. Although inorganic nanoparticle matrices have widely been used to perform so-called
surface-assisted laser desorption ionization (SALDI) MS analyses,18–21
they often cannot provide sensitivity and selectivity equalling that of conventional MALDI-MS using organic matrices. There have also been some attempts to combine nanomaterials with organic matrices.22–24
Here we propose a new type of hybrid inorganic–organic nanomaterial which enables in situ delivery of a chemical matrix for mass spectrometric imaging of microscale speci-mens (Fig. 1).
Application of the hybrid matrix to biological samples poses less threat to the experimenters and the environment since the toxic matrix compound does not need to be sprayed by using a gas-powered sprayer, which could lead to the contamination of the laboratory environment with toxic aerosols. The hybrid nanomaterial binds to the surface of the cells while still in the liquid phase, which is followed by a controlled release of the organic matrix molecules triggered by alkaline vapours delivered to the specimen in a closed chamber.
2. Materials and methods
2.1 Synthesis SiO2/9-AA and SiO2nanoparticles
In order to synthesize SiO2/9-AA nanoparticles, 54.4 mg of 9-AA
and 97 mL of 33% NH3(aq) solution were mixed with 15.25 mL
50% ethanol solution (Fig. 1A). The mixture was sonicated until almost all 9-AA crystals were dissolved, and saturation of the solution with 9-AA was reached. The mixture was further stirred for 30 min, andy117 mL of tetraethoxysilane (TEOS) were subsequently added. Stirring continued for 5 min, and the suspension was then left to settle for 12 h. The colour of the resulting suspension was bright yellow. The as-prepared
aDepartment of Applied Chemistry, National Chiao Tung University, Hsinchu 300, Taiwan. E-mail: yuchie@mail.nctu.edu.tw; plurban@nctu.edu.tw;
Fax: +886-3-5723764
bInstitute of Molecular Science, National Chiao Tung University, Hsinchu 300, Taiwan
3Electronic supplementary information (ESI) available: additional figures. See DOI: 10.1039/c3ra22977g
PAPER
Published on 20 February 2013. Downloaded by National Chiao Tung University on 28/04/2014 02:03:57.
View Article Online
SiO2/9-AA nanoparticle suspension was centrifuged (5500 rpm,
20 min). The SiO2/9-AA nanoparticles were recovered from the
pellet, and they were rinsed with 50% ethanol. After that, they were resuspended in water and stored in the refrigerator at 4 uC.
To synthesize SiO2 nanoparticles (without 9-AA), 3 mL of
30% ammonia solution were mixed with 7.63 mL 99.5% ethanol and 6.13 mL water. The mixture was further stirred for 30 min, andy117 mL of TEOS were added. Stirring continued for 5 min, and the product suspension was left to settle for 12 h. The as-prepared SiO2nanoparticle suspension was
centri-fuged (5500 rpm, 20 min), followed by rinsing the nanopar-ticles with 50% ethanol. The SiO2 nanoparticles were also
resuspended in water and stored in the refrigerator at 4uC. The f potentials of SiO2/9-AA and SiO2nanoparticles were +8
and 231 mV, respectively. Samples were also analyzed using a scanning electron microscope (SEM; JEOL JSM-7401 F, Tokyo, Japan).
2.2 The controlled release of 9-AA from SiO2/9-AA
nanoparticles by alkali
In order to demonstrate the feasibility of the controlled release of the 9-AA MALDI matrix from the SiO2/9-AA nanoparticles,
200 mL (0.5 mg mL21) of SiO2/9-AA nanoparticle suspension in
50% ethanol solution was prepared. Subsequently, an aliquot of 10 mL 33% NH3(aq) was added, and the suspension was
stirred for 5 min, and centrifuged at 10 000 rpm for 10 min. The supernatant was diluted 1006 with 50% ethanol, and used as a sample to obtain the fluorescence spectra by FluoroMax-3 spectrofluorometer (Horiba Jobin Yvon, Edison, USA). The excitation wavelength was set to 400 nm, and the emission spectrum was recorded in the wavelength range of 410–600 nm.
In another experiment —which was designed to demon-strate the controlled release of MALDI matrix— an aliquot of 200 mL 33% NH3(aq) was mixed with 200 mL (5 mg mL21) SiO2/
9-AA suspension, and stirred for 30 min. An aliquot of 200 mL of 95.5% ethanol was subsequently added to solubilize the 9-AA matrix released from the SiO2/9-AA nanoparticles. The
suspension of the residue nanoparticles was then centrifuged at 10 000 rpm for 10 min, and the pellet fraction containing nanoparticles (after 9-AA release) was re-suspended in 100 mL of pure water. The suspension was then spotted onto an SEM target, and imaged by SEM.
2.3 Preparation of algal cells for analysis
The protocol used to prepare single cells of Closterium acerosum (Carolina Biological Supply Company, Burlington, USA) for analysis is outlined in Fig. 1B. Initially, 0.5 mL of the cell suspension was mixed with 1.5 mL of water, and the resulting suspension was centrifuged at 2000 rpm for 5 min. The supernatant was removed, and the pellet was resuspended in 100 mL of water. A droplet of the resulting dilute suspension of cells was placed in a Petri dish, and several (y5) cells were picked up using a micropipette. Cells were washed several times by subsequent transfers into 2 mL droplets of fresh
water. A small amount of the suspension of SiO2/9-AA
nanoparticles (2 mL, 5 mg mL21) was pipetted onto the cells, and the excess suspension of the nanoparticles was quickly removed by pipetting. The unbonded SiO2/9-AA nanoparticles
were subsequently washed away with water. Finally, 2 mL of water were used to re-suspend the cells, and transfer them onto an aluminium plate. The optical and fluorescence images were captured using an upright fluorescence microscope (Eclipse 80i; Nikon, Yokohama, Japan) fitted with a digital camera (DS-Ril; Nikon, Tokyo, Japan). Fluorescence images were obtained using the excitation filters: UV-2A (lex= 330–380
nm) and G-2A (lex= 510–560 nm)
2.4 Controlled release of 9-AA by exposure to ammonia vapours
In order to induce the controlled release of 9-AA from the SiO2/
9-AA nanoparticles by exposure to ammonia vapours, a simple incubation system was constructed (Fig. 1D). A hole was drilled in the lid of a plastic Petri dish; one side of a silicon tube (length, 40 cm; ID, 2 mm, OD, 4 mm) was slid through that hole, and epoxy glue was used to seal the junction. The other side of the silicon tube was passed through the rubber septum mounted on the top of a 20 mL glass vial acting as the ammonia-vapour generator. The vial was filled withy15 mL 33% NH3(aq) solution and placed in a water bath set to 50uC.
The release of ammonia vapours occurred instantly as verified
Fig. 1 Outline of the protocol: (A) synthesis of the hybrid SiO2/9-AA nanoparticles; (B) preparation of cells for mass spectrometric imaging; (C) putative mechanism of the adsorption of SiO2/9-AA nanoparticles on algal cells, followed by the controlled release of 9-AA; (D) setup for the controlled release of 9-AA in the presence of gaseous ammonia; (E) mass spectrometric imaging of single cells.
by inserting a wet pH-indicator strip into the Petri dish used as the incubation chamber. An aluminium target with the sample (algal cells pre-coated with the SiO2/9-AA nanoparticles) was
incubated inside the Petri dish for 30 min. Parafilm was used to seal the slit in between the top and bottom parts of the Petri dish, thus to prevent possible escape of gaseous ammonia from the system. It should be noted that the incubation time with ammonia vapour needs to be adjusted when using different geometries of the release and incubation vessels, lengths of the transfer tubing, and incubation temperatures. 2.5 MALDI-MS and MALDI imaging
For MALDI-MS detection and MALDI imaging experiments (cf. Fig. 1E), we used the Autoflex III Smartbeam instrument (Bruker Daltonics) fitted with a solid-state laser (l = 355 nm). The settings of this instrument were as follows: negative ion mode, ion source 1, 219 kV; ion source 2, 216.7 kV; lens, 29 kV; delay time, 0 ns. Unless noted otherwise, during the MALDI imaging routine, the laser beam was focused to 10 mm, the scan raster was set to 10–15 mm (in different experiments), and 35 laser shots were fired at every raster point at a frequency of 50 Hz. In most experiments, the mass range was set to 300–1100 Da, and a cut-off limit of 300 Da was applied. Data were acquired using the flexControl software (version 3.0; Bruker Daltonics). The MALDI imaging data were collected and viewed using the flexImaging software (version 2.0; Bruker Daltonics).
3. Results and discussion
3.1 Synthesis and initial testing of the hybrid nanoparticles It is known that hybrid inorganic–organic materials can be synthesized using the sol–gel reaction system.25–27 For example, Laperriere et al.27 doped 9-AA into glass produced in the course of a sol–gel process. In the present work, we have made an attempt to synthesize SiO2/9-AA nanoparticles with
the prospect of using them as a matrix suitable for high-spatial-resolution MALDI imaging (Fig. 1A). To achieve this goal, we substituted a fraction of the alkaline component (NH3(aq)) of the sol–gel synthesis process with 9-AA. This
yielded a suspension of hybrid nanoparticles with the inorganic framework of SiO2, and the organic filling of 9-AA.
Fig. S1, ESI
3
presents scanning electron micrographs of the resulting hybrid SiO2/9-AA nanoparticles as well as SiO2nanoparticles (without 9-AA). On the nanoscopic scale, the nanoparticles loaded with 9-AA resemble those without 9-AA; however, on the macroscopic scale, the hybrid nanomaterial has yellow colour due to the presence of the 9-AA ‘‘cargo’’. Since the active MALDI matrix compound (9-AA) is embedded within the inorganic structure of SiO2, at this stage, the
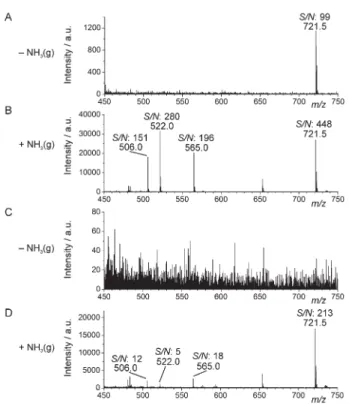
as-prepared hybrid nanomaterial does not yet fulfil the function of MALDI matrix: MALDI-MS detection of four standard compounds mixed with this nanomaterial gave poor results (Fig. 2A and 2C). However, following the release of 9-AA in a chamber saturated with gaseous ammonia (Fig. 1D), the MS signals —corresponding to all the test analytes— were very high (Fig. 2B and 2D). The 9-AA release is triggered by the
degradation of the SiO2 component within the hybrid
nanoparticles (Fig. S1B, ESI
3
) in the presence of alkalineenvironment (ammonia, moisture). The post-incubation
MALDI-MS data show that even the labile molecules, such as ATP, were preserved although the sample was exposed to alkaline environment. We have also noticed that —unlike most conventional MALDI matrices— the SiO2/9-AA
nanopar-ticles form a homogeneous layer on the MALDI target (Fig. S2, ESI
3
). This can facilitate application of the matrix by simple incubation of the hybrid nanoparticles suspended in an aqueous solution, compatible with biological specimens. 3.2 Evaluation of the controlled matrix release process The controlled release process was further studied in a series of experiments: in one of them, we suspended the SiO2/9-AAnanoparticles in 50% ethanol, added 33% NH3(aq), and stirred
the resulting suspension for 5 min, centrifuged, and measured the fluorescence of the supernatant (Fig. S3A, ESI
3
). Fluorescence intensity of the supernatant decreased in the subsequent washing steps using NH3(aq) as the washingsolvent. In another test, pure water was used instead of NH3(aq) as the washing solvent; in this case, fluorescence
intensity of the supernatant did not decrease as much as when
Fig. 2 The effect of ammonia vapours (NH3(g)) on signal intensity and signal-to-noise (S/N) ratio in MALDI-MS analysis of a chemical standard solution (1 mL) containing adenosine triphosphate (ATP), guanosine triphosphate (GTP), uridine diphosphate glucose (UDP-Glc) and 1,2-dipalmitoyl-sn-glycero-3-[phospho-rac-a-glycerol] (PG) sing SiO2/9-AA nanoparticles as matrix. The sample/nanoparticle deposits in (A) and (C) were not incubated with NH3(g) while the sample/nanoparticle deposits in (B) and (D) were incubated with NH3(g). Analyte concentrations in (A and B): ATP, GTP, and UDP-Glc: 2.5 6 1025M; PG–3.6 6 1025M. Analyte concentrations in (C and D): ATP, GTP, and UDP-Glc: 2.5 6 1026M; PG–3.6 6 1026M. Peak identities: ATP, m/z 506.0; GTP m/z 522; UDP-Glc, m/z 565; PG, m/z 721.5.
using NH3(aq) (Fig. S3B, ESI
3
). In addition, after the washingwith NH3(aq), the supernatant had yellow colour (Fig. S3C,
ESI
3
). After three consecutive wash steps with NH3(aq), thesupernatant was clear, and the amount of pellet was less than in the control series without NH3(aq); this is due to the fact
that some of the SiO2material was dissolved in the alkaline
solution (cf. scanning electron micrograph in Fig. S1B, ESI
3
). These results prove that the structure of the hybrid SiO2/9-AAnanoparticles is degraded in the alkaline environment (NH3(aq)), and this degradation process is accompanied by
the release of 9-AA.
3.3 Verification of spatial resolution
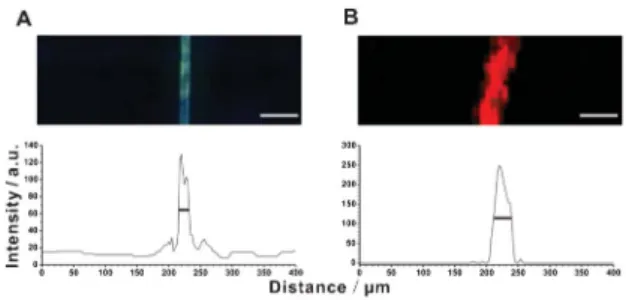
In order to evaluate spatial resolution which can be achieved using this approach, we conducted the following experiment: a natural fibre was incubated with the SiO2/9-AA nanoparticles,
and subsequently imaged using 10 mm UV laser beam with the raster spacing of 8 mm (Fig. 3). Signal intensity along an intersect line (perpendicular to the high-intensity pixel band) was plotted. The full-width-at-half-maximum (FWHM) values of the high-intensity peaks were found to bey20 and 40 mm in the fluorescence and MS images, respectively (Fig. 3). This result shows that using the preset conditions, one can obtain a satisfactory spatial resolution. Further improvement of spatial resolution would require the use of MALDI-MS instruments with narrower laser beams, and implementing denser raster-ing of the sample surface.
3.4 Application in the imaging of cells
Equipped with the controlled release hybrid SiO2/9-AA
nanoparticles, we further aimed to apply this material as a matrix in the mass spectrometric imaging of microscopic specimens such as single cells. As a model sample, we selected unicellular algae C. acerosum. This species has rod-shaped cells (y350 6 40 mm). Since cell wall in algal cells is rich in anion-forming biomolecules (e.g. galacturonic acid, a compo-nent of pectin),28 the SiO2/9-AA nanoparticles can readily
attach onto the outer surface of the cell due to electrostatic interactions (Fig. 1C). Fig. S4, ESI
3
presents optical and fluorescence micrographs of individual C. acerosum cells with/without SiO2/9-AA nanoparticles. Red fluorescenceorigi-nates from the natural dyes present in the cell, while yellow fluorescence originates from SiO2/9-AA nanoparticles attached
onto the cell surface. We also tested the new matrix with another species of algae, Anabaena sp.: also in this case, the SiO2/9-AA nanoparticles readily attached to the outer surface of
the cells (Fig. S5, ESI
3
). We noted that, following the incubation with the SiO2/9-AA nanoparticles, heterocysts ofAnabaena sp. —which normally do not fluoresce at the lex =
330–380 nm— started to fluoresce with blue light.
Following the treatment of C. acerosum cells with SiO2/9-AA
nanoparticles (Fig. S4 and 4A, ESI
3
), and subsequent exposure of the sample to ammonia vapours, we used MALDI-MS to obtain spectra of single cells. Fig. 4B shows a mass spectrum of C. acerosum with three high signals at the m/z 709.4, 779.5, and 815.5. The small number of compounds recorded is due to the fact that the method can mainly see the molecules present in the outer layer of the cell. This is in line with our previous study using free 9-aminoacridine as matrix,4 and contrary toFig. 3 Verification of spatial resolution achievable using SiO2/9-AA nanoparti-cles as matrix and a commercial MALDI-MS instrument. Model sample: natural fibre. (A) Fluorescence image (lex= 330–380 nm); (B) MALDI-MS image for the m/z 193 ¡ 0.3 (9-AA). Graphs show pixel intensities along horizontal intersect lines (not shown). The FWHM values for the peaks in (A) and (B) arey20 and 40 mm, respectively. Laser beam wavelength: 355 nm; frequency: 100 Hz; diameter: 10 mm; raster spacing: 8 mm. Scale bars: 60 mm.
Fig. 4 Single-cell MS imaging with SiO2/9-AA nanoparticles used as matrix. (A) Optical and fluorescence micrographs of a single Closterium acerosum cell with the attached SiO2/9-AA nanoparticles. (B) MALDI mass spectrum of a single cell of Closterium acerosum following the occlusion with SiO2/9-AA nanoparticles, and the release of 9-AA induced by gaseous ammonia. The blank spectrum of SiO2/9-AA nanoparticles shows no peaks overlapping with the three sample-related peaks (Fig. S6, ESI3). (C) Mass spectrometric images of a single cell of Closterium acerosum (same as in (A)). The MS images were obtained in the negative-ion mode by MALDI-time-of-flight (TOF)-MS. Laser beam wavelength: 355 nm; frequency: 50 Hz; diameter: 10 mm; raster spacing: 15 mm. The red-colour dashed line in (A) approximately delimits the MS imaging area in (C). Scale bars: 200 mm.
the more common approaches which involve extraction of molecules from cells, or mechanical slicing of cells and tissues. This is an advantage because we do not observe significant migration of intracellular metabolites in the direction perpendicular to the MALDI plate surface.
We further conducted MS/MS analysis of the detected ions by analyzing their post-source decay products using the laser-induced fragmentation technology (LIFT) cell. The presence of three fragments —PO32 (m/z 97), H2PO42 (m/z 97), and
C3H6O5P2 (m/z 153)— suggests that the three signals are
related to analytes from the group of phospholipids (Fig. S7, ESI
3
). We confirmed the identities of these peaks by perform-ing MALDI-MS analysis with internal calibrants (Table S1, ESI3
). Matching the measured and the predicted m/z values led to a tentative identification of the three metabolites as phosphatidylglycerols. The presence of the signals ing to phospholipids, and the absence of signals correspond-ing to cytoplasmic metabolites, suggests that this method can be applied to studying composition of membrane lipids. This is in line with the fact that the hybrid nanoparticles occlude the cell, and the matrix does not penetrate the interior of the cell, which could possibly lead to dispersion of metabolites and blur the MS images.The three prominent MS signals (m/z 709.5, 779.5, and 815.5) were subsequently monitored in a MALDI imaging sequence (Fig. 4C) using a 10 mm UV laser beam, and a raster with 15 mm spacing. The MS signals follow the contours of single cells as observed in the optical and fluorescence images (Fig. 4A). Although the coverage of the cell with MALDI matrix is highly homogeneous (Fig. 4A, S4 and S8, ESI
3
), the distribution of metabolites within the cell —as visualized by MALDI-MS— is seen to represent some heterogeneity (Fig. 4C): this points out the advantage of performing MALDI-MS imaging with subcellular resolution. For example, the meta-bolite corresponding to the MS signal at the m/z 779.5 seems to be present in the whole cell, while the metabolites correspond-ing to the MS signals at the m/z 709.5 and 815.5 appear to be more concentrated in one of the two semicells of the C. acerosum cell under investigation (Fig. 4C). The method was readily used to image several cells of C. acerosum with satisfactory reproducibility; images were obtained using either 15 or 10 mm laser scan rasters (Fig. 4C and S8, ESI3
, respectively).3.5 Final considerations
Coating specimens with chemical matrices is seen to be a big challenge in MALDI imaging. Common coating methods involve pneumatic spray and electrospray deposition (for reviews, see refs 15,29,30). Since matrix compounds are normally dissolved in organic solvents, spray-based methods cause analytes to spread over the sample surface.15,29Several alternative ways of applying matrix prior to MALDI-MS imaging have been proposed to date: for example, matrix can be deposited on the sample by using inkjet printing, which produces an array of matrix spots, the method which is mainly applicable for imaging at low lateral resolution.31The matrix sublimation/recrystallization method ensures small crystal size, high homogeneity, and minimum dispersion of analytes; however, this method is not suitable for all kinds of samples
and matrices.14,32,33 Here we showed that good lateral resolution can be achieved after replacing conventional matrix application protocols with hybrid nanoparticles used as matrix carriers. Since the nanoparticles are dissolved in water —and the organic matrix release occurs in situ, when triggered by ammonia vapours— this way of preparing samples for MS does not blur the native distributions of the analytes, and the so-called ‘‘sweet spot’’ effect may be reduced. Further improvement of lateral resolution is expected after combining the sample preparation using the SiO2/9-AA nanoparticle
matrix (proposed here) with state-of-the-art MALDI-MS instru-ments which use laser beams with diameters smaller than 10 mm.
It should be noted that the method limits dispersion of metabolites. This feature can be considered an advantage when imaging molecules present near the outer surfaces of biological specimens. However, this comes at the expense of sensitivity, which is lower than that obtained with conven-tional sample preparation methods (using excess of organic matrix).
It is believed that the proposed method can readily be scaled up and adapted for routine use. The hybrid nanoparticles can be synthesized in bulk quantities and refrigerated before use. Although —in the present study— pure water was used as a dispersant in the suspension of SiO2/9-AA nanoparticles, it
should also be possible to use a mixture of nanoparticles and a specially prepared cell medium. This would reduce possible osmosis-related effects during incubation of cells with nanoparticles. The size of the chamber for incubation with ammonia can also be increased (at present it is a Petri dish), so that multiple slides with specimens can be incubated simultaneously (when analyzing many samples).
4. Conclusions
This study demonstrates hybrid inorganic–organic nanoparti-cles designed with the purpose of mapping metabolites in microscale biological specimens by mass spectrometry. The proposed strategy brings about several advantages: (i) applica-tion of the hybrid matrix can be conducted in liquid phase (native environment of the biological cells), (ii) the matrix targets the biological specimen by attaching to its surface due to electrostatic interactions, (iii) application of the organic MALDI matrix compound occurs in situ, following the attachment of nanoparticles, and the controlled-release step (in alkaline vapours), which warrants less dispersion of analytes than using standard matrix application techniques, (iv) the expenditure of chemicals is minimized. Another aspect of this analytical strategy is related to lab work safety: the implementation of many standard chemistry and biochemistry procedures may be hazardous to researchers and pose threat to the environment, for example: carcinogenic ethidium bromide is frequently used as a DNA marker in gel electro-phoresis, solvents such as tetrahydrofuran or chloroform are used in synthetic protocols despite their explosive nature, eventually, toxic matrices (e.g. 9-aminoacridine) are sprayed in order to obtain MALDI images of biological specimens. It is
believed that it is safer to handle small quantities of gaseous ammonia in closed systems than to spray solutions of 9-aminoacridine dissolved in organic solvents. Thus, the proposed imaging strategy, involving hybrid nanoparticles, can mitigate the exposure of the experimenters to toxic chemicals, and at the same time ensure good lateral resolution.
Acknowledgements
We thank the National Science Council of Taiwan for the financial support of this work.
Notes and references
1 M. Karas, D. Bachman, U. Bahr and F. Hillenkamp, Int. J. Mass Spectrom. Ion Processes, 1987, 78, 53.
2 MALDI MS: A Practical Guide to Instrumentation, Methods and Applications, ed. F. Hillenkamp and J. Peter-Katalinic, Wiley, 2007.
3 S. R. Shanta, L.-H. Zhou, Y. S. Park, Y. H. Kim, Y. Kim and K. P. Kim, Anal. Chem., 2011, 83, 1252.
4 P. L. Urban, C.-H. Chang, J.-T. Wu and Y.-C. Chen, Anal. Chem., 2011, 83, 3918.
5 C. D. Cerruti, F. Benabdellah, O. Laprevote, D. Touboul and A. Brunelle, Anal. Chem., 2012, 84, 2164.
6 R. M. Caprioli, T. B. Farmer and J. Gile, Anal. Chem., 1997, 69, 4751.
7 M. Stoeckli, P. Chaurand, D. E. Hallahan and R. M. Caprioli, Nat. Med., 2001, 7, 493.
8 L. S. Eberlin, X. H. Liu, C. R. Ferreira, S. Santagata, N. Y. R. Agar and R. G. Cooks, Anal. Chem., 2011, 83, 8366. 9 D. S. Cornett, S. L. Frappier and R. M. Caprioli, Anal. Chem.,
2008, 80, 5648.
10 K. A. Lunsford, G. F. Peter and R. A. Yost, Anal. Chem., 2011, 83, 6722.
11 T. Porta, C. Grivet, T. Kraemer, E. Varesio and G. Hopfgartner, Anal. Chem., 2011, 83, 4266.
12 S. Khatib-Shahidi, M. Andersson, J. L. Herman, T. A. Gillespie and R. M. Caprioli, Anal. Chem., 2006, 78, 6448.
13 T. A. Zimmerman, S. S. Rubakhin, E. V. Romanova, K. R. Tucker and J. V. Sweedler, Anal. Chem., 2009, 81, 9402. 14 W. Bouschen, O. Schulz, D. Eikel and B. Spengler, Rapid
Commun. Mass Spectrom., 2010, 24, 355.
15 K. Chughtai and R. M. Heeren, Chem. Rev., 2010, 110, 3237. 16 V. Vrkoslav, A. Muck, J. Cvacˇka and A. Svatosˇ, J. Am. Soc.
Mass Spectrom., 2010, 21, 220.
17 E. H. Seeley and R. M. Caprioli, Trends Biotechnol., 2011, 29, 136.
18 C.-T. Chen and Y.-C. Chen, Anal. Chem., 2005, 77, 5912–5919.
19 C.-Y. Lo, J.-Y. Lin, W.-Y. Chen, C.-T. Chen and Y.-C. Chen, J. Am. Soc. Mass Spectrom., 2008, 19, 1014–1020.
20 H. Kawasaki, T. Sugitani, T. Watanabe, T. Yonezawa, H. Moriwaki and R. Arakawa, Anal. Chem., 2008, 80, 7524–7533.
21 H. Kawasaki, T. Yao, T. Suganuma, K. Okumura, Y. Iwaki, T. Yonezawa, T. Kikuchi and R. Arakawa, Chem.–Eur. J., 2010, 16, 10832–10843.
22 Y.-S. Lin and Y.-C. Chen, Anal. Chem., 2002, 74, 5793–5798. 23 J. Duan, M. J. Linman, C. Y. Chen and Q. J. Cheng, J. Am.
Soc. Mass Spectrom., 2009, 20, 1530–1539.
24 M.-C. Tseng, R. Obena, W. Lu, P.-C. Lin, P.-Y. Lin, Y.-S. Yen, J.-T. Lin, L.-D. Huang, K.-L. Lu, L.-L. Lai, C.-C. Lin and Y.-J. Chen, J. Am. Soc. Mass Spectrom., 2010, 21, 1930–1939.
25 J. Trepte and H. Bottcher, J. Sol-Gel Sci. Technol., 2000, 19, 691.
26 B. Unger, K. Rurack, R. Mu¨ller, U. Resch-Genger and K. Buttke, J. Sol-Gel Sci. Technol., 2000, 19, 799.
27 S. C. Laperriere, J. W. Mullens, D. Lesperance and E. L. Chronister, Chem. Phys. Lett., 1995, 243, 114.
28 F. A. Baylson, B. W. Stevens and D. S. Domozych, J. Phycol., 2001, 37, 796.
29 R. J. Goodwin, J. Proteomics, 2012, 75, 4893. 30 A. Svatosˇ, Trends Biotechnol., 2010, 28, 425.
31 D. L. Baluya, T. J. Garrett and R. A. Yost, Anal. Chem., 2007, 79, 6862.
32 J. A. Hankin, R. M. Barkley and R. C. Murphy, J. Am. Soc. Mass Spectrom., 2007, 18, 1646.
33 J. H. Yang and R. M. Caprioli, Anal. Chem., 2011, 83, 5728.