Effect of Hydrolysis on the Strength of Hydrogen Bonds and T
gof
Poly(vinylphenol-co-acetoxystyrene)
Shiao-Wei Kuo, Wen-Pin Liu, and Feng-Chih Chang*
Institute of Applied Chemistry, National Chiao-Tung University, Hsin-Chu, Taiwan Received February 12, 2003; Revised Manuscript Received May 14, 2003
ABSTRACT: A series of poly(vinylphenol-co-acetoxystyrene) (PVPh-co-PAS) copolymers were prepared by partial hydrolyses of poly(acetoxystyrene) (PAS) in acidic and basic solutions. Higher glass transition temperature, higher fraction of hydrogen-bonded carbonyl group, and higher interassociation equilibrium constant were observed for copolymers with same composition prepared from the acidic hydrolysis than from the basic hydrolysis because the sequence distribution of the former is relatively more random than the latter. Infrared spectra provide positive evidence in terms of sequence distribution, glass transition temperature, and hydrogen-bonding strength in poly(vinylphenol-co-acetoxystyrene) by prepared these two hydrolysis methods.
Introduction
The preparation of linear polymers containing phe-nolic groups has attracted great attention due to its potential applications in the areas of photoresists, adhesives, metal treatment, plastics additives, stabiliz-ers in emulsion polymerizations, and compatibilizstabiliz-ers in polymer blends.1-6 Polymers selected for deep UV
wavelengths (220-260 nm) application are those linear phenolic polymers possessing great absorption charac-teristics within the deep-UV region such as poly-(vinylphenol) (PVPh). The PVPh is usually produced from the polymerization of acetoxystyrene followed by hydrolysis from either basic or acidic solution. However, based on our knowledge, no research has been reported to compare the sequence distribution and its related hydrogen-bonding strength of the poly(vinylphenol-co-acetoxystyrene) (PVPh-co-PAS) prepared by partially acidic and basic hydrolyses of the poly(acetoxystyrene) (PAS) homopolymer. Properties of copolymers such as degree of crystallinity, melting point, glass transition temperature, solubility, and viscosity depend on the composition of copolymers. However, the structure is also strongly influenced by the method of preparation on these copolymers, resulting in different monomeric sequence distributions.
Earlier studies7-13have found that the copolymers of
vinyl alcohol and vinyl acetate (PVA-co-PVAc) prepared from the acidic hydrolysis tend to be more randomly distributed than those obtained from basic solution, suggesting that kinetics of basic hydrolysis of the PVAc is a neighboring group catalytic process superimposed on a general electrostatic effect. Therefore, the prob-ability of hydrolyzing neighboring acetyl groups in basic conditions is significantly higher. The NMR technique has been employed in quantitative characterization of sequence distribution and chemical composition of this type of copolymer.7-10In this study, infrared
spectros-copy was employed to characterize the relative sequence distribution qualitatively. In addition, infrared spec-troscopy is able to measure the strength of the hydrogen-bonding interaction and determines fractions of free and
hydrogen-bonded groups to calculate the interassocia-tion equilibrium constant between the carbonyl and the hydroxyl groups.
The glass transition temperature of a polymer is an important intrinsic property that influences the mate-rial properties and its potential applications of a given polymer. Copolymer glass transition temperatures are usually predicted by the Fox equation.14However, for
many copolymers this simple equation fails, and it becomes necessary to account for the sequence distribu-tion of A and B monomer units,15-20 dilute solution
properties of repulsive intramolecular interactions,21
and intermolecular specific interaction such as hydrogen bonding.22-23Over the years, many equations have been
proposed to extend the Fox equation for Tgcomposition
dependence of miscible polymer blends or copolymers such as Gordon-Taylor,24Couchman,25-26and Karasz.27
Couchman and Karasz27equations based on
thermody-namic arguments have the advantage of being formu-lated in terms of pure components. Although these equations have been successfully applied to certain blends and copolymers, there are still certain systems with significant deviations. Systems with the most severe deviations are those blend systems containing specific interactions such as those mentioned in our previous studies.30-32 The most suitable equation
ap-plicable for these hydrogen-bonded polymer blends or copolymers is the Kwei equation28as follows:
where W1and W2are weight fractions of the
composi-tions, Tg1 and Tg2 represent the corresponding glass
transition temperatures, and k and q are fitting con-stants. The first term on the right-hand side of eq 1 is identical with the widely used Gordon-Taylor equation, and the second term corresponds to the strength of hydrogen bonding in the blend or copolymer, reflecting a balance between the breaking of the self-association and the forming of the interassociation hydrogen bond-ing. In this study, we will compare the sequence distributions of PVPh-co-PAS copolymers prepared by different methods and the glass transition temperature predicted by the Kwei equation.
* To whom corresponding should be addressed: e-mail [email protected]; Tel 5727077; FAX 886-3-5719507.
Tg)
W1Tg1+ kW2Tg2
W1+ kW2 + qW1W2 (1)
10.1021/ma0341824 CCC: $25.00 © 2003 American Chemical Society Published on Web 06/10/2003
Another interesting result from our previous study33
revealed that the polymer blend of PVPh and PAS is immiscible because the intramolecular association of the PVPh component is more favorable than the intermo-lecular interaction between PVPh and PAS segments. From the infrared spectrum analysis, the hydrogen-bonded fraction of the carbonyl group approaches a maximum value for the blend containing 50 wt % PVPh content and then decreases gradually as the PVPh content is increased further, indicating that the self-association equilibrium constant of the PVPh component is greater than the interassociation equilibrium constant between the carbonyl group of PAS and the hydroxyl group of PVPh. In this study, we compare the hydrogen-bonding behavior difference between the PVPh/PAS blend system and two different types of PVPh-co-PAS copolymers prepared by different hydrolysis conditions (acidic and basic). Differential scanning calorimetry (DSC) and Fourier transform infrared spectroscopy (FT-IR) were employed to determine their respective Tg’s, fractions of hydrogen-bonded carbonyl group,
sequence distributions, and interassociation equilibrium constants based on the Painter-Coleman association model (PCAM).
Experimental Section
Preparation of Poly(acetoxystyrene). The synthesis of
poly(acetoxystyrene) was carried out by free radical polymer-ization in benzene at 80 °C under a nitrogen atmosphere by using the azobis(isobutyronitrile) (AIBN) initiator. The product was purified by dissolution in benzene and reprecipitation into cyclohexane. The product was dried in a vacuum oven at 80 °C for 12 h. Molar mass and polydispersity were determined at room temperature by GPC using THF as the mobile phase with Mn) 21 500 g/mol and Mw) 28 000 g/mol.
Preparation of Basic Hydrolyzed Samples.
Poly(ac-etoxystyrene) was dissolved in stirred 1,4-dioxane. The degree of hydrolysis was quantitatively controlled by adding desired amount of NaOH solution in water (1 M). Complete reaction was carried out at 90 °C for 12 h. The product was recovered by precipitating in 1% hydrochloric acid solution and followed by dissolution in 1,4-dioxane and reprecipitated in water.
Preparation of Acidic Hydrolyzed Samples.
Poly(ac-etoxystyrene) (PAS) was dissolved in stirred 1,4-dioxane. Then, concentrated hydrochloric acid was added to achieve an acid concentration of 0.23 M in the solution to give equal equivalent concentration of the carbonyl group in PAS and the hydro-chloric acid. The degree of hydrolysis was controlled by varying the time of reaction. Reaction products were precipitated in water and followed by dissolution in 1,4-dioxane and repre-cipitated in water. The chemical structure of PVPh-co-PAS copolymer and their atom numbering schemes are shown in Scheme 1:
Characterizations. Nuclear Magnetic Resonance.1H and 13C NMR spectra were recorded on a Bruker ARX300
spec-trometer using CDCl3and DMSO solvent for the pure PAS and PVPh-co-PAS copolymers, respectively.
Gel Permeation Chromatography (GPC). Weight-average (Mw) and number-average molecular weights (Mn) and poly-dispersity index (Mw/Mn) were determined by a Waters 510 gel permeation chromatograph (GPC).
Differential Scanning Calorimetry (DSC). Thermal analysis was carried out on a DSC instrument from Du-Pont(DSC-9000) with a scan rate of 20 °C/min ranging from 20 to 250 °C. Approximately 5-10 mg of each sample was weighted and sealed in an aluminum pan for DSC analysis. The sample was quenched to 20 °C from the melt state for the first scan and then scanned between 20 and 250 °C at 20 °C/min. The glass transition temperature was obtained at the inflection point of the jump heat capacity.
Fourier Transform Infrared Spectroscopy (FTIR). The sample was dissolved in tetrahydrofuran (THF) and was cast directly on KBr pellets. All films were vacuum-dried and thin enough to be within the absorbance range where the Beer-Lambert law is obeyed. All infrared spectra were obtained at a resolu-tion of 1 cm-1on a Nicolet AVATAR 320 FTIR spectrometer at 25 °C and degassed with nitrogen.
Results and Discussion
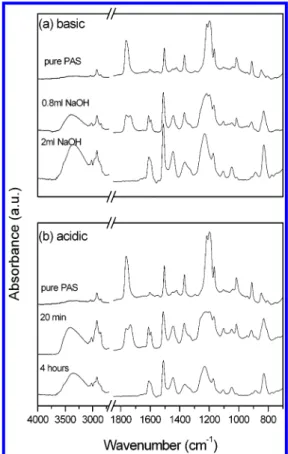
Copolymer Composition Analyses. Figure 1 shows the infrared spectra for pure PAS, pure PVPh, and PVPh-co-PAS copolymers prepared from basic (a) and acidic (b) hydrolyses at room temperature. The pure PAS shows a carbonyl absorption at 1763 cm-1, which is totally disappeared after both basic (2 mL of NaOH) and acidic hydrolyses (4 h). The corresponding hydroxyl group of a broad absorbance between 3100 and 3700 cm-1can be clearly observed following these two meth-ods. In addition, these partially hydrolyzed PVPh-co-PAS copolymers from basic (0.8 mL of NaOH) and acidic (20 min) solutions shown in Figure 1a,b give the two bands at 1763 and 1735 cm-1, corresponding to the free and the hydrogen-bonded carbonyl groups. Further-Scheme 1. Chemical Structure of PVPh-co-PAS
Copolymer and Their Atom Numbering Schemes
Figure 1. Comparison of FTIR spectra of PVPh-co-PAS
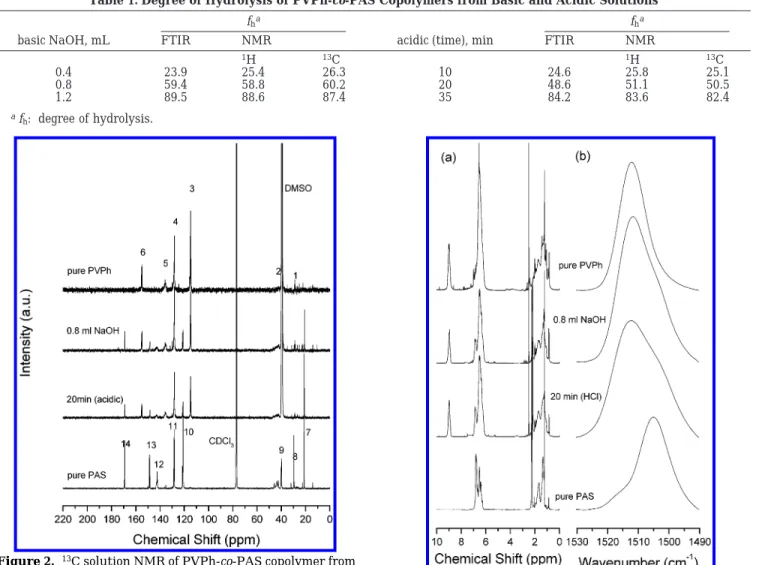
more, the13C solution spectra of pure PAS, pure PVPh,
and their PVPh-co-PAS copolymers from basic and acidic solutions are shown in Figure 2. The pure PAS has eight resonance peaks and the carbonyl-substituted carbon (C-14) is at 169.1 ppm. The pure PVPh has six resonance peaks, and the hydroxyl-substituted carbon in the phenolic ring (C-6) is located at 154.9 ppm. All other peak assignments assigned in Figure 2 are shown in Scheme 1. Similarly, these partially hydrolyzed PVPh-co-PAS copolymers from basic and acidic solutions show all corresponding peaks from the PVPh and the PAS, indicating that these two different copolymers can be obtained from both basic and acidic conditions. To determine the vinylphenol content in the PVPh-co-PAS copolymer system, the absorptions between 1490 and 1530 cm-1in FTIR can be used to determine copolymer compositions in PVPh-co-PAS copolymers that have been discussed in our previous study.34In addition, the
areas of the phenol proton at 9.0 ppm and aromatic protons at 6.9 ppm of the PVPh-co-PAS copolymers from basic and acidic solutions were also employed to char-acterize their compositions in 1H NMR as shown in
Figure 3. The degrees of hydrolysis from basic and acidic solution are calculated from FTIR and 1H NMR as
summarized in Table 1. Good correlation was found between FTIR and NMR data, and the various degrees of hydrolyzed PVPh-co-PAS copolymers can be obtained by acidic and basic solutions.
FT-IR Analyses. Figure 4 shows the carbonyl stretch-ing band for PVPh-co-PAS copolymers obtained from
basic (a) and acidic (b) hydrolyses and the PVPh/PAS blend (c) measured at room temperature in the region 1680-1800 cm-1. Again, the peak at 1765 cm-1 corre-sponds to the free carbonyl while the peak at 1735 cm-1 corresponds to the hydrogen-bonded carbonyl. To obtain the fraction of the hydrogen-bonded carbonyl, the known absorptivity ratio for hydrogen-bonded and free carbonyl contributions is required. We have employed a value of RHB/RF ) 1.5, which was previously calculated by
Moskala et al.35Fractions of hydrogen-bonded carbonyl
through curve fitting from basic hydrolysis, acidic hydrolysis, and blending are summarized in Table 2. The hydrogen-bonded fraction of the carbonyl group increases with the increase of PVPh content on both two PVPh-co-PAS copolymers, which is different with the PVPh/PAS blend system. The hydrogen-bonded fraction of the carbonyl group approaches a maximum value for the blend containing 50 wt % PVPh content and then decreases gradually as the PVPh content is increased further. This observation can be explained in terms of difference in degrees of rotational freedom between polymer blend and copolymer. The polymer chain ar-chitecture of a homopolymer is significantly different to a copolymer due to intramolecular screening and functional group accessibility36-41caused by the chain
connectivity. The PVPh in the PVPh/PAS blend has more contacts with segments of its own type than the corresponding copolymer due to chain connectivity and Table 1. Degree of Hydrolysis of PVPh-co-PAS Copolymers from Basic and Acidic Solutions
fha fha
basic NaOH, mL FTIR NMR acidic (time), min FTIR NMR
1H 13C 1H 13C
0.4 23.9 25.4 26.3 10 24.6 25.8 25.1
0.8 59.4 58.8 60.2 20 48.6 51.1 50.5
1.2 89.5 88.6 87.4 35 84.2 83.6 82.4
afh: degree of hydrolysis.
Figure 2. 13C solution NMR of PVPh-co-PAS copolymer from
basic and acidic hydrolysis.
Figure 3. 1H NMR (a) and FTIR (b) in 1530-1490 cm-1region
intramolecular screening effect. These two effects tend to increase numbers of contacts by the same polymer chain due to polymer chain self-bending back. Thus, the interassociation hydrogen bond density of a polymer blend is relatively less than that of a corresponding copolymer. Moreover, the spacing between functional groups along a homopolymer chain and the presence of bulky side group are also responsible for less interas-sociation hydrogen bond density in terms of the so-called functional group accessibility effect. This effect is at-tributed to the steric crowding and shielding.39 As a
result, the hydrogen-bonded carbonyl group in the PVPh/PAS blend is lower than the corresponding PVPh-co-PAS copolymer with same composition as would be expected.
Now we turn our attention to PVPh-co-PAS copoly-mers prepared from basic and acidic hydrolyses. The fraction of hydrogen-bonded carbonyl of the PVPh-co-PAS copolymer prepared from acidic solution is higher than that from the basic solution over the entire compositions because the copolymer sequence from acidic hydrolysis tends to be more randomly distributed. A more randomly distributed PVPh-co-PAS copolymer
provides greater opportunity for hydrogen-bonding for-mation between the hydroxyl group of PVPh and the carbonyl group of PAS than that from a blocky distrib-uted copolymer.
Here, the interassociation equilibrium constants of PVPh-co-PAS copolymers prepared from basic and acidic hydrolyses were determined on the basis of the Painter-Coleman association model. In our previous study,33we
have reported that the interassociation equilibrium constant is 43.1 for PVPh/PAS ) 50/50 blend system. The numerical method to determine KAaccording to the
PCAM was based on the fraction of the hydrogen-bonded carbonyl group. The approximate equations42are Figure 4. FT-IR spectra in the 1680-1800 cm-1region for (a) block copolymer and (b) random copolymer.
Table 2. Curve-Fitting Result of Fraction of Hydrogen-Bonded Carbonyl of PVPh-co-PAS from Basic and Acidic Hydrolysis at 25°C
H-bonded free CdO CdO
base, wt % ν, cm-1 W1/2, cm-1 Ab, % ν, cm-1 W1/2, cm-1 Af, % fba
23.9 1734.9 33.9 34.0 1764.1 17.3 66.0 25.6
59.4 1736.5 39.7 54.7 1764.9 17.2 45.3 44.6
97.7
H-bonded CdO free CdO
acid, wt % ν, cm-1 W1/2, cm-1 Ab, % ν, cm-1 W1/2, cm-1 Af, % fba
24.6 1740.7 29.5 43.2 1766.8 15.5 56.8 33.6
48.6 1735.1 30.5 64.9 1765.6 19.4 35.1 58.6
84.2 1732.9 27.6 82.1 1765.8 21.1 17.9 75.4
free CdO H-bonded CdO
PVPh/PAS ν, cm-1 W1/2, cm-1 Af, % ν, cm-1 W1/2, cm-1 Ab, % fba 25/25 1763.7 18.37 79.51 1746.7 30.25 20.49 14.66 40/60 1762.2 18.82 69.07 1744.4 31.46 30.93 22.99 50/50 1763.6 17.10 51.94 1740.7 30.95 48.06 38.15 60/40 1763.5 16.92 57.05 1743.0 32.21 42.95 33.41 75/25 1763.8 17.49 68.90 1743.9 30.74 31.10 23.13 af
b: fraction of hydrogen-bonded carbonyl group.
ΦB) ΦB1
[
(
1 -K2 KB)
+K2 KB[
1 (1 - KBΦB1) 2]
][
1 + KAΦ0A r]
(2) ΦA) Φ0A+ KAΦ0AΦB1[
(
1 -K2 KB)
+K2 KB[
1 (1 - KBΦB1)]
]
(3)where ΦAand ΦBdenote volume fractions of
non-self-associated species A (PAS) and self-associating species B (PVPh), respectively. Φ0Aand ΦB1are the
correspond-ing volume fractions of the isolated PAS and PVPh segments, respectively. r is the ratio of molar volume, VA/VB. Self-association equilibrium constants, KBand K2, describe the formation of multimers and dimers,
respectively. Finally, the KAis the equilibrium constant
describing the association of A with B. In addition, KB
and K2are 66.8 and 21.0 at 25 °C of the pure PVPh.42
To calculate the interassociation constants (KA), the
methodology of a least-squares method has been de-scribed in the previous study.43 The interassociation
constant of 86.3 is obtained from the more randomly distributed PVPh-co-PAS copolymer, and 45.1 is ob-tained from the more blocky distributed PVPh-co-PAS copolymer.
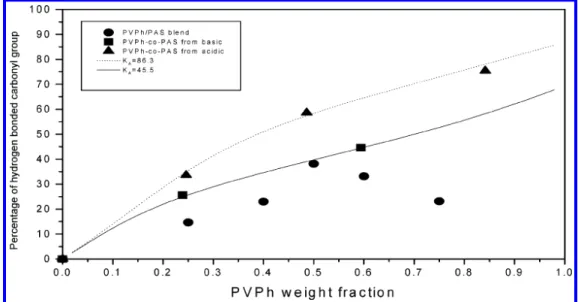
Table 3 lists all the thermodynamic parameters in these copolymer systems. Using these value of KA
together with the PVPh self-association equilibrium constants (K2and KB), we can calculate the theoretical
fraction of hydrogen-bonded carbonyl at 25 °C as a function of the weight fraction of PVPh content, and the results are displayed in Figure 5. Interestingly, the interassociation constant of the polymer blend system is close to that of the copolymer from the block copoly-mer system at 50/50 composition. However, we need to emphasize here that the interassociation constant from the polymer blend is calculated from the highest fraction of hydrogen-bonded carbonyl group at the PVPh/PAS ) 50/50 blend. In general, we believe that the interas-sociation constants from polymer blends is lower than this value, as shown in Figure 5, due to the strong intramolecular screening effect in a polymer blend system. The observed interassociation constant from the more random copolymer is nearly double that of the more blocky copolymer (86.3 vs 45.5). Most importantly, the interassociation equilibrium constant of the more
random PVPh-co-PAS copolymer is even greater than the self-association equilibrium constant of the PVPh homopolymer (86.3 vs 66.8), implying that the tendency toward forming intermolecular hydrogen bonding be-tween PVPh and PAS segments (hydroxyl-carbonyl) in the more random copolymer dominates over the self-association forming the intra-hydrogen-bonding (hy-droxyl-hydroxyl) of the PVPh homopolymer. However, the interassociation equilibrium constant of the more blocky PVPh-co-PAS copolymer is still smaller than the self-association equilibrium constant of the pure PVPh (45.5 vs 66.8), indicating that the hydroxyl-hydroxyl self-association is preferred. A similar observation was also observed in the PVA-co-PVAc block copolymer.16In
the random copolymer system, the hydroxyl groups have better opportunity to interact with carbonyl groups than the blocky copolymer. Therefore, the random copolymer has the higher fraction of hydrogen-bonded carbonyl group; for example, at 50 wt % of PVPh, the fraction of hydrogen-bonded carbonyl groups in the PVPh-co-PAS random copolymer is about 20% higher than the blocky copolymer and the polymer blend due to the composi-tional heterogeneities in the hydrogen-bonded polymer system.22
We turn our attention to the hydroxyl stretching spectra of these two copolymer systems. Figure 6 shows the infrared spectra in the 2700-4000 cm-1range for different PVPh-co-PAS copolymers prepared from basic (c) and acidic (b) hydrolyses and the PVPh/PAS blend system (a). Clearly, the hydroxyl stretching intensities of both copolymers and polymer blend increase and shift to lower wavenumber with the increase of vinylphenol content. In the meantime, the hydroxyl stretching band becomes broader. These data suggest that there are many different types of hydroxyl groups in PVPh-co-PAS copolymers and PVPh/PVPh-co-PAS blends. The free hy-droxyl locates at the highest wavenumber (3525 cm-1). The interassociation hydrogen bonding between hy-Figure 5. Fraction of hydrogen-bonded carbonyl group vs the PVPh fraction for random, block copolymer, and polymer blend.
Table 3. Summary of the Self-Association and Interassociation Parameters of PVPh/PAS Blend and PVPh-co-PAS Copolymer Systems interassociation equilibrium constant KA self-association equilibrium constant polymer molar volume (mL/mol) molecular weight (g/mol) solubility parameter (cal/mL)0.5 K 2 KB polymer blend block copolymer random copolymer PVPh 100.0 120.0 10.60 21.0 66.8 PAS 128.6 162.2 10.29 <43.1 45.5 86.3
droxyl and carbonyl groups is at the middle wavenum-ber (depending on the sequence distribution and com-positions in copolymer and comcom-positions in polymer blend). The self-association of hydrogen-bonded hy-droxyl-hydroxyl such as dimers, trimers, and multi-mers is at the lowest wavenumber (3350 cm-1).
Taking into account the effect of composition, the interassociation hydroxyl-carbonyl becomes dominant at lower vinylphenol content because the small numbers of the hydroxyl groups tend to interact completely with carbonyl groups. Therefore, essentially the majority of only one type of hydroxyl group from the hydrogen-carbonyl interassociation is expected, and thus the
hydroxyl stretching band is relatively narrower. On the contrary, at higher vinylphenol content, the self-associa-tion hydrogen bonding of hydroxyl group is dominant. Therefore, the free, dimer, trimer, or multimer hydrogen-bonded hydroxyl groups will exist at higher vinylphenol content and thus give a broader absorption. At the same time, the free hydroxyl stretching intensity is increased with the increase of vinylphenol content, as would be expected.
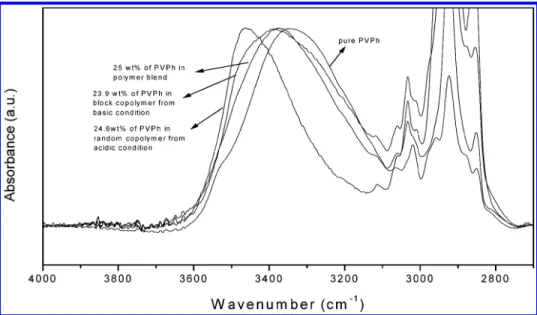
Figure 7 compared IR spectra of the pure PVPh, two PVPh-co-PAS prepared from acidic and basic hydroly-ses, and the polymer blends with close compositions. There is a clear difference between spectra of these two copolymers with close vinylphenol contents but different sequence distributions. The more randomly copolymer from acidic hydrolysis gives the hydroxyl stretching shifting to higher wavenumber. On the contrary, the hydroxyl environment in a blocky copolymer is closer to the pure PVPh. The hydroxyl groups of a more blocky copolymer are surrounded mostly by other hydroxyl groups, and thus multiple self-associations are favored. The multiple hydrogen bonding of hydroxyl-hydroxyl interaction tends to lower its wavenumber, as men-tioned previously. From the thermodynamic viewpoint, the self-association equilibrium constant of hydroxyl-hydroxyl is greater than the interassociation equilibri-um constant of hydroxyl-carbonyl in the blocky PVPh-co-PAS copolymer, and good correlations between these two systems are expected. In addition, for the more random PVPh-co-PAS copolymer, the absorption peak of the self-associated hydroxyl-hydroxyl broad band shifts to higher wavenumber with increasing PAS content (Figure 6b). This result reflects a new distribu-tion of hydrogen bonds resulting from the competidistribu-tion between hydroxyl-hydroxyl and hydroxyl-carbonyl interactions. It also reveals that the hydroxyl-carbonyl interaction predominates in those PAS-rich blends. Therefore, it is reasonable to assign the band at 3440 cm-1 as the hydroxyl group bonded to the carbonyl group. For the more random PVPh-co-PAS copolymer, the higher interassociation equilibrium constant of the hydroxyl-carbonyl results in higher wavenumber at 3440 cm-1. In addition, the hydroxyl band becomes narrower due to the existence of nearly only one type of interassociation of hydroxyl-carbonyl in the random Figure 6. FT-IR spectra in the 2700-4000 cm-1region for
(a) polymer blend, (b) random copolymer, and (c) block copolymer.
Figure 7. Comparison of FT-IR spectra in the 3000-3600 cm-1region for samples with similar hydrolysis degree but prepared
copolymer. These data suggest that the PVPh-co-PAS copolymer from basic hydrolysis tends to be a blocky copolymer while the copolymers obtained from acidic hydrolysis is a more randomly distributed copolymer. Thermal Analyses. Differential scanning calorime-try (DSC) is a convenient method to observe thermal characters from different interactions of copolymers and polymer blends. Figure 8 shows the DSC thermograms of PVPh-co-PAS copolymers with different degrees of hydrolyses. Here, we need to emphasize that the pure PVPh employed in this study shows a slightly higher glass transition temperature (192 °C with Mw) 28 000)
than our previous study30,33(150 °C with M
w)
9000-11 000) due to different molecular weights that has been widely discussed.44The glass transition temperatures
in both basic and acidic conditions increase with the increase of vinylphenol content in PVPh-co-PAS copoly-mers. This phenomenon can be attributed to the hydro-gen-bonding interactions between the hydroxyl group of PVPh segment and the carbonyl group of PAS segment and the self-association between the hydroxyl groups of the pure PVPh. The intensity of free hydroxyl group of PVPh increases with the increasing hydrolysis of the PVPh-co-PAS copolymer, as shown in Figure 6. Even though the pure PVPh polymer shows the greatest intensity of the free hydroxyl group, the glass transition temperature of the pure PVPh polymer is still higher than those of the PVPh-co-PAS copolymers. The fre-quency difference (∆ν) between the hydrogen-bonded hydroxyl absorption and the free hydroxyl absorption in the infrared spectrum can be used to evaluate the average strength of the hydrogen bonding.45The
result-ing hydrogen-bondresult-ing strength dictates the glass transi-tion temperature of the PVPh-co-PAS copolymer that can be deduced from frequency difference between the free and the hydrogen-bonded hydroxyl groups.
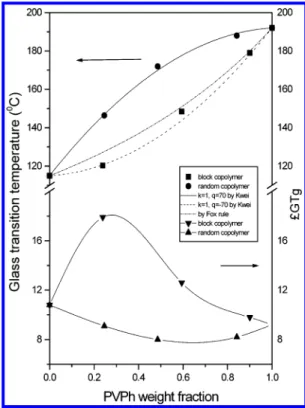
Figure 9 shows glass transition temperatures and Tg
breadths of PVPh-co-PAS copolymers prepared from basic and acidic hydrolyses. Clearly, Tg’s of
PVPh-co-PAS copolymers from acidic hydrolysis are substantially higher than those from basic hydrolysis over the entire compositions. It is worthy to note that the Tg
composi-tion dependence of PVPh-co-PAS blocky copolymers is lower than that predicted by the Fox rule, while the randomly copolymers are significantly higher than the Fox rule. Fortunately, these data can be fitted well by the Kwei equation with q ) -70 and k ) 1 for these PVPh-co-PAS blocky copolymers and with q ) 70 and k ) 1 for these PVPh-co-PAS random copolymers, respec-tively, where q is a parameter corresponding to the strength of hydrogen bonding in a copolymer, reflecting a balance between the breaking of the self-association and the forming of the interassociation hydrogen bond-ing. Generally speaking, in most systems, if the inter-association equilibrium constant is greater than the self-association equilibrium constant, a positive q value is usually obtained. On the contrary, it gives a negative q value. In this study, we found good relationship between the Tg behavior and thermodynamic equilibrium
con-stants. In these random copolymers, a positive deviation (q > 0) of Tgcomposition dependence is due to KA> KB,
while the KA< KBresults in negative deviation for those
blocky copolymers.
To recheck the q value of physical meaning, we simply use the qualitative analysis based on the free volume change in these copolymer systems by following the Kovacs’ free volume theory.29 From a thermodynamic
viewpoint, the glass transition temperature is consid-ered as a second-order thermodynamic transition that can be detected in properties such as heat capacity and specific volume. One of the most common approaches in analyzing polymer glass transition is the concept of free volume. According to the free volume theory of Kovacs, the free volume term can be expressed by the following equation
Figure 8. DSC traces with various degree of hydrolysis of
PVPh-co-PAS copolymer from (a) basic conditions and (b) acidic conditions.
Figure 9. Tg vs the PVPh content of both PVPh-co-PAS copolymer from basic conditions and acidic conditions.
where f is the free volume of the blend and fi and Φi are the free volume and the volume fraction of compo-nent i. V is the total volume of the blend, Veis the excess
volume (eq 4), and the Ve/V term is usually related to
an interaction term g by means of
According to Kovacs’ free volume theory, if the Tg
difference (Tg1- Tg2) between blend components 1 and
2 is higher than 50 °C, there is a critical temperature (Tc) at which the free volume of the polymer with higher
glass transition temperature becomes zero, and the corresponding critical volume fraction (Φc) calculated
by Kovacs is
The composition dependence of Tgabove Tcis given by
Below Tc, Kovacs has shown that the Tgof the blend is
given by
where fg1is the fractional free volume of component 1
at Tg1 and ∆Ri is the difference between the volume
expansion coefficients in the liquid and glassy state. To analyze the experimental data in terms of eq 9, it can be rearranged to
Therefore, the fg1/∆R2 can be calculated by a plot of
(Tg- Tg2)/Φ1vs 1/Φ2from its slope and the g/∆R2from
its intercept. Analysis of the experimental data for the blocky copolymer for T < Tccan be made following this
theory by using eq 10. ∆R2 and g can be obtained by
using the classical value of 0.025 for fg1, so that ∆R2and g are obtained as 8.4× 10⁻⁴and -0.014, respectively. As a result, a negative value of the Kovacs g parameter (-0.014) is obtained, implying that the free volume in blocky copolymer system is increased. In the random copolymer with Tg above Tc, we can use the eq 10 to
determine the g value. For convenience, we assume the K ) 1 that is equal to the Kwei equation fitting constant (K ) 1, q ) 70). Then eq 10 becomes the same as the Kwei equation, so that g is obtained as 0.059, implying that a decrease of the free volume in the random copolymer. In summary, the KAof the randomly
copoly-mer is greater than KB that tend to decrease the free
volume, so the Tgcomposition dependence shows
posi-tive deviation predicted by Kwei equation (q > 0). On the contrary, the free volume increase in blocky
copoly-mer due to the KA< KBthat gives a negative q value in
the Kwei equation.
In a miscible blend of polymer A and polymer B, Lodge et al.46have proposed the effective local
concen-tration (φeff) as
where φs is the self-concentration of the considered
polymer segments; the value of φsis determined from
the volume actually occupied by a Kuhn length worth of monomers divided by V
where M0is the repeat unit molar mass, k is the number
of backbone bonds per repeat unit, Navis the Avogadro
number, F is the density, and C∞is the characteristic ratio. They proposed the effective glass transition tem-perature Tg,eff(φ) of each blend component as a function
of concentration Tg(φ) from the calorimetric glass
transi-tion temperature using the following equatransi-tion:
Tgbreadths of pure PVPh, pure PAS, and PVPh-co-PAS
random and block copolymer are shown in Figure 9. As shown in Figure 9, the pure PAS shows a greater Tg
breadth than the pure PVPh since the lower Tg
compo-nent (PAS) tends to be more flexible the larger the self-concentration value and the more average dynamic than the PVPh. In the blocky copolymer system, the Tg
breadth shows positive deviation due to larger self-concentration and length scale as would be expected. In general, a miscible polymer blend generally gives a broader DSC transition. On the contrary, the random copolymer shows a narrower Tgbreadth due to the more
adjacent unit of segment A and B. Therefore, a random copolymer shows better homogeneity at a molecular scale than a blocky copolymer.
Furthermore, it is well-known that the Tgcomposition
dependence not only obeys the thermodynamics of interaction enthalpy but also needs to take into account the chain conformation entropy of the polymer chain. In a randomly copolymer, the hydroxyl and carbonyl groups are more neighboring, and the intramolecular hydrogen bonding generally can be formed in a cyclic structure. Therefore, the higher thermal stability of a random copolymer is expected because of the strong interassociation of hydroxyl-carbonyl with eight-mem-bered rings.
Conclusions
Two copolymers with same polymer segment and same compositions, but different sequence distributions, possess different properties. The PVPh-co-PAS random copolymer shows a higher glass transition temperature than the corresponding blocky copolymer. The interas-sociation equilibrium constant of the hydroxyl-carbonyl interaction of the random copolymer is greater than the self-association equilibrium constant of the hydroxyl-hydroxyl interaction based on PCAM. In addition, the random copolymer has larger positive q value based on the Kwei equation and the smaller free volume based on Kovoc’s theory than the corresponding blocky copoly-mer. The hydrogen-bonding distribution is strongly f ) Φ1f1+ Φ2f2- Ve/V (4) Ve V ) gΦ1Φ2 (5) Tcrit) Tg1 -fg1 ∆R1 (6) Φc) fg1
[
∆R2(Tg1- Tg2) + fg1(
1 -∆R1 ∆R2)]
(7) Tg)Φ2Tg2+ KΦ1Tg1+ (g/∆R2)Φ1Φ2 Φ2+ KΦ1 (8) Tg) Tg2+ Φ1fg1+ gΦ1Φ2 Φ2∆R2 (9) Tg- Tg2 Φ1 ) g ∆R2 + fg1 ∆R2 1 Φ2 (10) φeff) φs+ (1 - φs)φ (11) φs) C∞M0 kFNavV (12) Tg,eff(φ) ) Tg(φeff) (13)dependent on monomer sequence distribution based on IR analyses. The IR spectrum of the blocky copolymer prepared from basic conditions is closer to that of the PVPh homopolymer, which prefers to form multiple self-associations. On the contrary, a strong competition between hydroxyl-hydroxyl and hydroxyl-carbonyl as-sociation is observed for the more randomly distributed copolymer prepared by acidic solution. In summary, the glass transition temperature, fraction of hydrogen-bonded carbonyl group, and interassociation equilibrium constant of the randomly copolymer prepared from acidic conditions are greater than those of the blocky copolymer prepared from basic conditions.
Acknowledgment. This research was financially supported by the National Science Council, Taiwan, Republic of China, under Contract NSC-91-2216-E-009-018.
References and Notes
(1) Ito, H.; Willson, C. G.; Frechet, J. M. J.; Farrall, M. J.; Eichler, E. Macromolecules 1983, 16, 510.
(2) Xu, Y.; Graf, J.; Painter, P. C.; Coleman, M. M. Polymer 1991, 32, 3103.
(3) Xiang, M.; Jiang, M.; Zhang, Y.; Wu, C.; Feng, L. Macromol-ecules 1997, 30, 2313.
(4) Zhao, J. Q.; Pearce, E. M.; Kwei, T. K. Macromolecules 1997, 30, 7119.
(5) Barclay, G. G.; Hawker, C. J.; Ito, H.; Orellana, A.; Malent-fant, P. R. L.; Sinta, R. F. Macromolecules 1998, 31, 1024. (6) Barclay, G. G.; King, M.; Sinta, R.; Malmstrom, E.; Ito, H.;
Hawker, C. J. Polym. Prepr. 1997, 38, 902.
(7) Isasi, J. R.; Cesteros, L. C.; Katime, I. Macromolecules 1994, 27, 2200.
(8) Tubbs, R. K. J. Polym. Sci. 1966, A4, 623.
(9) Finch, C. A., Ed. Polyvinyl Alcohol; Wiley: New York, 1973. (10) Pritchard, J. G. Poly(vinyl alcohol), Basic Properties and Uses; Polymer Monographs; Gordon and Breach: London, 1970; Vol. 4.
(11) Moritani, T.; Fujiwara, Y. Macromolecules 1977, 10, 532. (12) Van der Velden, G.; Beulen, J. Macromolecules 1982, 15,
1071.
(13) Garnaik, B.; Thombre, S. M. Macromolecules 1999, 72, 123. (14) Fox, T. G. J. Appl. Bull. Am. Phys. Soc. 1956, 1, 123. (15) Mori, Y.; Sumi, H.; Hirabayashi, T.; Inai, Y.; Yokota, K.
Macromolecules 1994, 27, 1051.
(16) Fernandez-Garcia, M.; Cuervo-Rodriguez, R.; Madruca, E. L. J. Appl. Polym. Sci. 1999, 37, 2512.
(17) Yokota, K.; Miwa, M.; Hirabayashi, T.; Inai, Y. Macromol-ecules 1992, 25, 5821.
(18) Staubli, A.; Mathiowitz, E.; Langer, R. Macromolecules 1991, 24, 2291.
(19) Tonelli, A. E. Macromolecules 1975, 8, 544. (20) Tonelli, A. E. Macromolecules 1974, 7, 644. (21) Tonelli, A. E. Macromolecules 1977, 10, 633.
(22) Coleman, M. M.; Xu, Y.; Painter, P. C. Macromolecules 1994, 27, 127.
(23) Xu, Y.; Painter, P. C.; Coleman, M. M. Macromolecules 1992, 25, 7076.
(24) Gordon, M.; Taylor, J. S. J. Appl. Chem. 1952, 2, 493. (25) Couchman, P. R. Macromolecules 1991, 24, 5772. (26) Couchman, P. R. Polym. Eng. Sci. 1984, 24, 135.
(27) Couchman, P. R.; Karasz, F. E. Macromolecules 1978, 11, 1156.
(28) Kwei, T. J. Polym. Sci., Polym. Lett. Ed. 1984, 22, 307. (29) Kovacs, A. J. Adv. Polym. Sci. 1963, 3, 394.
(30) Kuo, S. W.; Chang, F. C. Macromolecules 2001, 34, 5224. (31) Kuo, S. W.; Chang, F. C. Macromol. Chem. Phys. 2002, 203,
868.
(32) Huang, M. W.; Kuo, S. W.; Wu, H. D.; Chang, F. C.; Fang, S. Y. Polymer 2002, 43, 2479.
(33) Kuo, S. W.; Chang, F. C. J. Polym. Sci., Polym. Phys. 2002, 40, 1661.
(34) Kuo, S. W.; Chang, F. C. Polymer 2003, 44, 3021.
(35) Moskala, E. J.; Howe, S. E.; Painter, P. C.; Coleman, M. M. Macromolecules 1984, 17, 1671.
(36) Painter, P. C.; Veytsman, B.; Kumar, S.; Shenoy, S.; Graf, J. F.; Xu, Y.; Coleman, M. M. Macromolecules 1997, 30, 932. (37) Coleman, M. M.; Pehlert, G. J.; Painter, P. C. Macromolecules
1996, 29, 6820.
(38) Pehlert, G. J.; Painter, P. C.; Veytsman, B.; Coleman, M. M. Macromolecules 1997, 30, 3671.
(39) Pehlert, G. J.; Painter, P. C.; Coleman, M. M. Macromolecules 1998, 31, 8423.
(40) Coleman, M. M.; Guigley, K. S.; Painter, P. C. Macromol. Chem. Phys. 1999, 200, 1167.
(41) Painter, P. C.; Coleman, M. M. Polymer Blends; Paul, D. R., Ed.; John Wiley & Sons: New York, 2000; Vol. 1.
(42) Coleman, M. M.; Graf, J. F.; Painter, P. C. Specific Interac-tions and the Miscibility of Polymer Blends; Technomic Publishing: Lancaster, PA, 1991.
(43) Kuo, S. W.; Chang, F. C. Macromol. Chem. Phys. 2001, 202, 3112.
(44) O’Driscoll, K.; Sanayei, R. A. Macromolecules 1991, 24, 4479. (45) Moskala, E. J.; Varnell, D. F.; Coleman, M. M. Polymer 1985,
26, 228.
(46) Lodge, T. P.; Mcleish, T. C. B. Macromolecules 2000, 33, 5278. MA0341824