Analyzing heterogeneous accident data from
the perspective of accident occurrence
Jinn-Tsai Wong
a,∗, Yi-Shih Chung
b,1aInstitute of Traffic and Transportation, National Chiao Tung University, 4F, 114 Chung Hsiao W. Rd., Sec. 1, Taipei 100, Taiwan bInstitute of Traffic and Transportation, National Chiao Tung University, 3F, 114 Chung Hsiao W. Rd., Sec. 1, Taipei 100, Taiwan
Received 12 February 2007; received in revised form 14 June 2007; accepted 1 July 2007
Abstract
Clustering and classification approaches have been commonly applied in reducing the heterogeneity in accident data. As part of an effort to understand the features of the heterogeneity, this study assessed accident data from the perspective of accident occurrences. Using the rule-based classification method, rough set theory, rules were derived which consisted of indispensable factors to certain accident outcomes and reflected the process of accident occurrences. The occurring frequency of each derived rule was then adopted as the basis for grouping accidents for further analyses. Empirical results showed that rules with high occurring frequencies were largely related to drivers with high-risk characteristics. On the other hand, road facilities played a key role in rules with low-occurring frequencies. The distinctive features indicated the essential differences between the frequently repeated and the sparsely unique processes of accident occurrences. This suggests that the heterogeneity of accident data is not limited to one single factor, such as age, gender or area. Thus, the proposed approach, which takes the process of accident occurrences into consideration, can be a potential alternative to more comprehensively analyze the heterogeneity in accident data.
© 2007 Elsevier Ltd. All rights reserved.
Keywords: Heterogeneity; Accident characteristic; Rough set; Logistic regression
1. Introduction
The issue of heterogeneity in accident analysis and road safety modeling is critical and has been noticed by many researchers. If not carefully taken into account, heterogeneity may lead to erroneous data interpretations or biased coeffi-cient estimates. Heterogeneity can be roughly divided into two kinds: the observed and the unobserved (Washington et al., 2003; Cameron and Trivedi, 2005). Observed heterogeneity refers to inter-individual differences that are controlled or mea-sured by explanatory variables; on the other hand, unobserved heterogeneity refers to all other differences. While unobserved heterogeneity is difficult to deal with due mostly to data limita-tions, researchers have put a lot of effort into reducing possible heterogeneity in on-hand data.
∗Corresponding author. Tel.: +886 2 2349 4959; fax: +886 2 2349 4953.
E-mail addresses:jtwong@mail.nctu.edu.tw(J.-T. Wong),
yschung.tt93g@nctu.edu.tw(Y.-S. Chung). 1 Tel.: +886 2 2349 4995; fax: +886 2 2349 4953.
One of the many approaches to reducing heterogeneity is to select relatively homogeneous data; for example, grouping accident cases (or partitioning an accident dataset) by the age or alcoholic status of the driver or by crash site. It is clear that research interest and professional knowledge play important roles in accident data processing of safety research. In other words, the heterogeneity was presumably specified rather than revealed by the data itself. Those targeted groups are specifi-cally analyzed because of the presence of their persistent but unobserved age-specific, gender-specific or area-specific fac-tors. Although some particular groups, such as male and female drivers, have long been associated with having essentially dif-ferent accident patterns, those significant differences may not stand universally because of various factors like national or regional cultures. To more objectively deal with the heterogene-ity problem, some systematic approaches have been proposed. In particular, clustering methods have been considered as a useful tool to partition accident data so that the modeled or interpreted data are relatively homogeneous (Karlaftis and Tarko, 1998).
Recognizing contributions from past studies, this research aims to group accident data from the perspective of accident chains; that is, grouping accident data by using the concept of
0001-4575/$ – see front matter © 2007 Elsevier Ltd. All rights reserved. doi:10.1016/j.aap.2007.07.003
accident chains—combining accident-contributing factors. This approach more thoroughly examines the causality between fac-tors and accident outcomes. Furthermore, it is also helpful in uncovering the effects of confounding factors (Elvik, 2003) and in gaining new insights (Juarez et al., 2007; Wong and Chung, 2007). Accordingly, this research will aim to explore the char-acteristics of each sub-dataset formed from the perspective of accident chains.
The purposes of this study were two-fold. One was to compare the characteristics of accidents belonging to different groups; the other was to examine the observed heterogeneity among accident groups. A two-stage approach was then pro-posed for the purposes. Rough set theory and statistical tests were adopted at the first stage to derive rules for grouping acci-dents. A multinomial logistic regression model was applied at the second stage to evaluate the effects of factors in accident outcomes for various accident groups.
Other elements in the paper are organized as follows: The two-stage approach is described in Section 2. A real dataset was adopted to demonstrate the approach. Rules as well as their characteristics are explored in Section3. Discussions follow in Section4and conclusions are drawn in Section5.
2. Methodology
Tree- or rule-based methodologies have been shown as useful tools to obtain homogeneous datasets in accident anal-yses. Recent applications included classification trees or CART (Abdel-Aty et al., 2005; Chang and Wang, 2006; Karlaftis and Golias, 2002; Magazz`u et al., 2006; Park and Saccomanno, 2005; Stewart, 1996), generic algorithms (Clarke et al., 1998, 2005), and rough set theory (Wong and Chung, 2007). Of which, the rule-based methodology, rough set theory (Pawlak, 1982), has been shown as a useful tool to express the accident chain idea. By comparing the differences among accident cases, rule sets are generated to represent accident chains. Each rule can be treated as a pseudo-causal chain which usually consists of driver charac-teristics, trip characcharac-teristics, weather conditions, road conditions and accident outcomes. Interested readers can refer toPawlak (1991)andPawlak and Skowron (2007)for a thorough intro-duction to rough set theory. A nice tutorial about rough set theory was presented byWalczak and Massart (1999), andWong and Chung (2007)explained the connections between rules and accident chains.
For the purpose of accident analyses and prevention, people have been interested in causality and have tried to find the gen-erating processes of accidents, especially for those that occur repeatedly. The occurring frequency of a rule is termed as rule strength in rough set theory. A rule with high frequency of accident occurrence indicates that many accidents repeatedly occur under identical conditions for some critical factors. Con-sequently, strong causality between factors and outcomes may exist for such rules. On the other hand, a low-frequency rule refers to only a few accidents, occurring under the associated conditions. Accidents belonging to the same rule are treated as identical; however, it should be noted that accidents belonging to slightly different rules are not essentially different since some of
the considered critical attributes could be partially overlapping in terms of the effect on accident occurrence. For example, trip time and illumination of roads both affect drivers’ sight distance and consequently the occurrence of accidents. Therefore, to avoid over-strictly classifying accidents, instead of rules, the classifi-cation of accidents will be based on rule strength which stands for the occurring frequency of such accident conditions. Acci-dents associated with the rules with low-occurring frequency could be considered as by-chance accidents. On the other hand, accidents under rules with high-occurring frequency may imply that they did not occur by chance but for some reason or sys-tem error such as poor road design. These accidents should be paid more attention by both policy makers and traffic engineers. Therefore, the rule strength is considered as a helpful indicator to cluster accidents for further analyses.
As stated, the proposed approach consisted of two stages. In the first stage, accidents were grouped with respect to rule strength; accordingly, accident characteristics were extracted with multinomial logistic regression in the second stage. In the following, the proposed approach is explained step by step. The first four steps describe how to apply rough set theory and sta-tistical tests to group accidents while the last step describes a way to use a multinomial logistic regression model in extract-ing accident characteristics. The whole process is depicted as in
Fig. 1.
• Step 1: Learning rules from accident datasets. A whole accident dataset was first analyzed with rough set theory. Condition attributes were filtered so that the attributes unable to distinguish accident cases were excluded. Thereafter, by learning from past accident cases, a minimum number of rules
was generated to represent all distinct accident patterns. Each rule was represented by three elements: variable
combina-tion of condicombina-tion attributes, strength and belonging accidents. Combination of variables describes the process of accident
occurrence for a specific accident pattern. Strength repre-sents the accident counts belonging to a rule, and belonging
accidents refers to the accident cases under the rule.
• Step 2: Grouping accident cases based on rule strength. Acci-dent cases were then grouped according to the associated rule strength. In other words, accident cases were grouped if their belonging rules were of equivalent strength. Consequently, two accident cases were put under the same group if and only if their belonging rule had equivalent strength. Accidents referring to distinct rules could belong to the same group as long as their strength was equivalent.
• Step 3: Ranking the aforementioned groups by the order of rule strength. Rules and the corresponding accidents were then arranged in the order of strength.
• Step 4: Grouping the ordered accident groups. The next step was to group the ordered accidents. For the convenience of interpretations, the number of the groups was set small. Meanwhile, the accident characteristics among groups were expected to be significantly different from one another where
aχ2test was adopted for large sample sizes and a Fisher’s exact test for small sample sizes in the significance test. • Step 5: Exploring accident characteristics with multinomial
logistic regression. Finally, multinomial logistic regression was applied to explore the accident characteristics for the whole dataset as well as for each accident group. The charac-teristics of each accident group were then compared.
3. Empirical study
In order to demonstrate the effectiveness of the proposed approach, an empirical study is presented. The data and soft-ware (Grzymala-Busse, 1992; Grzymala-Busse and Werbrouck, 1998) used inWong and Chung (2007)were adopted to demon-strate the feasibility and usefulness of the proposed framework. Single auto-vehicle (SAV) accidents were chosen as subjects; since no other vehicles or pedestrians were involved in such accidents, the problem can be more accurately defined. Mean-while, far more information is required to explore the accident patterns of multi-vehicle accidents. Consequently, studying SAV accidents makes a good start for the research. The attributes and their corresponding categories coded in the accident database are summarized inTable 1.
Table 1
Attribute and category
Dimensions Attributes Categories
Driver characteristics (condition attributes)
Ages Under (<18), young (18–35), middle-aged (36–55), elderly (>55)
Genders Male, female
License types Regular, occupational, military, other License conditions Valid, invalid, unknown
Occupations Student, working people, no job, unknown
Trip characteristics (condition attributes) Trip purposes Work, school, social, shop, sightseeing, business, other, unknown Trip time Morning peak (07:00–09:00 h), day off-peak (09:00–16:00 h),
afternoon peak (16:00–19:00 h), night off-peak (19:00–23:00 h), midnight to daybreak (23:00–07:00 h)
Behavior and environmental factors (condition attributes)
Protect equipment use Use, no use, unknown Cell phone use Use, no use, unknown Drinking condition Drinking, not drinking, other Road type Highway, other
Speed limit 50−, 51–79, 80+
Road shape Intersection, segment, ramp or other Pavement material Asphalt, other, no pavement
Surface deficiency Normal, other (e.g. holes, soft, and so on) Surface status Dry, wet, other
Obstruction Yes, No (within 15 meters)
Sight distance Good, poor (based on road design speed) Signal type Regular, flash, no signal
Signal condition Normal, abnormal, no signal Median Island, marking, none Roadside marking Yes, no
Weather Sunny or cloudy, rainy, other Light condition With light, no light
Accident (decision attribute)
Accident types Collision with structure Collision with road facility Collision with non-fixed object Collision with work zone Off-road
Rollover Other
Table 2
Strength and the corresponding number of rules
Strength 1 2 3 4 5 6 7 8 9 10 Number of rules 285 167 76 47 28 23 31 24 20 13 Rule percentage (%) 35.27 20.67 9.41 5.82 3.47 2.85 3.84 2.97 2.48 1.61 Strength 11 12 13 14 15 16 17 18 19 20 Number of rules 11 19 7 10 4 8 6 2 1 7 Rule percentage (%) 1.36 2.35 0.87 1.24 0.50 0.99 0.74 0.25 0.12 0.87 Strength 21 22 23 25 26 27 29 35 Number of rules 5 2 3 4 1 1 2 1 Rule percentage (%) 0.62 0.25 0.37 0.50 0.12 0.12 0.25 0.12
3.1. Strength of accident pattern
With 23 condition attributes (pavement material is redun-dant and excluded), 808 rules were generated as the minimum requirement to cover 2316 accident cases, i.e. one rule stood on average for three accident cases. As shown inTable 2, the fre-quencies of some rules were high while some were low. The maximum strength was 35 for one rule while the minimum strength was 1 for 285 rules. More than half of the rules were of strength equivalent to 1 or 2. This demonstrates the uniqueness of most accident patterns for Taiwan’s SAV accidents in 2003; that is, most accidents occurred with different driver character-istics, different trip characteristics and/or different behavior and environmental factors. Nevertheless, for those rules with high strength, they represent a large portion of accidents occurring repeatedly with identical patterns.
The differences of accident characteristics between rules with high frequencies and those of low frequencies are the pri-mary concerns in this research. This study adopted 23 condition attributes to describe the occurrence of accidents, which made the analysis at a very microscopic level. As a consequence, each accident may follow its exclusive pattern rather than identical
patterns. Nevertheless, in addition to the rules with low frequen-cies, the rules with high frequencies were also derived. This shows that stereotype accidents do exist.
3.2. Accident grouping
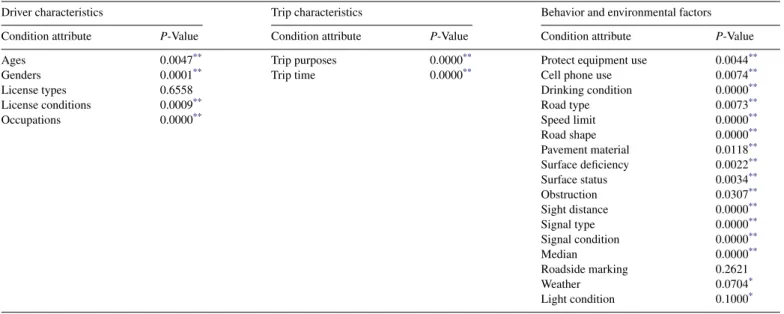
For the convenience of interpretations, two to six groups were preferred, in which the more significantly different condition attributes existed among groups, the more desired they were. In this research, a bottom-up procedure was implemented to deter-mine the boundaries of accident groups. Statistical tests were employed to determine the appropriateness of cluster bound-aries. Theχ2test was adopted for large sample sizes while the Fisher’s exact test for small sample sizes. The significance level was set at 0.10, and three clusters were then determined after thorough analysis. The corresponding rule strength intervals for the clustered groups were 1–2, 3–23 and 25–35 with the num-ber of accidents being 619, 1451 and 246, respectively. Seen in
Table 3, the license type and roadside marking attributes were the only two non-significant condition attributes among clusters. All other condition attributes were significantly different among groups.
Table 3
Test results of condition attributes for the final partition
Driver characteristics Trip characteristics Behavior and environmental factors Condition attribute P-Value Condition attribute P-Value Condition attribute P-Value
Ages 0.0047** Trip purposes 0.0000** Protect equipment use 0.0044**
Genders 0.0001** Trip time 0.0000** Cell phone use 0.0074**
License types 0.6558 Drinking condition 0.0000**
License conditions 0.0009** Road type 0.0073**
Occupations 0.0000** Speed limit 0.0000**
Road shape 0.0000** Pavement material 0.0118** Surface deficiency 0.0022** Surface status 0.0034** Obstruction 0.0307** Sight distance 0.0000** Signal type 0.0000** Signal condition 0.0000** Median 0.0000** Roadside marking 0.2621 Weather 0.0704* Light condition 0.1000* * 0.10 significance level. **0.05 significance level.
Table 4
Accident characteristics for whole and partitioned accident groups
Condition attribute Category Whole dataset (%) Weak pattern (strength = 1–2) (%) Medium pattern (strength = 3–23) (%) Strong pattern (strength = 25–35) (%) Age Under 0.3 0.5 0.2 0.0 Young 60.3 59.9 60.9 67.4 Middle-aged 32.2 29.7 33.1 26.5 Elderly 6.5 8.8 5.4 5.7 Other 0.7 1.1 0.4 0.4 Gender Male 86.0 84.3 86.3 95.1 Female 14.0 15.7 13.7 4.9
License type Regular 81.6 80.8 80.6 80.8
Occupational 6.9 7.2 7.4 4.9
Military 0.4 0.7 0.3 0.4
Other 11.1 11.3 11.7 13.9
License condition Valid 86.7 87.3 85.4 84.5
Invalid 8.0 8.0 8.7 14.3 Unknown 5.3 4.7 5.9 1.2 Occupation Student 4.0 6.5 2.8 3.3 Working people 69.1 51.1 55.7 67.3 No job 8.1 8.2 7.9 5.7 Unknown 18.8 34.2 33.6 23.7
Trip purpose Work 7.3 6.0 8.7 6.1
School 0.4 1.3 0.0 0.0 Social 9.0 9.1 8.9 8.2 Shop 1.9 2.8 1.5 1.6 Sightseeing 4.8 4.7 4.8 2.4 Business 2.1 2.1 2.0 2.4 Other 52.5 50.8 51.6 67.9 Unknown 22.0 23.2 22.5 11.4
Trip time Morning peak 5.8 5.2 6.8 1.6
Day off-peak 21.5 22.3 19.0 18.0
Afternoon peak 10.7 13.7 9.0 13.1
Night off-peak 15.8 15.9 16.0 12.2
Midnight to daybreak 46.2 42.9 49.2 55.1
Protect equipment use Use 83.8 85.8 82.0 90.2
No use 3.8 4.1 4.3 2.9
Unknown 12.4 10.1 13.7 6.9
Cell phone use Use 0.9 0.5 1.1 0.8
No use 87.1 88.7 86.1 93.5
Unknown 12.0 10.8 12.8 5.7
Drinking condition Drinking 28.2 26.8 27.3 26.1
Not drinking 61.5 62.6 60.5 72.2
Unknown 10.3 10.6 12.2 1.7
Road type Highway 7.7 5.5 9.5 9.0
Other 92.3 94.5 90.5 91.0
Speed limit 50− 55.4 59.9 55.2 29.8
51–79 37.0 34.1 35.8 60.4
80+ 7.6 6.0 9.0 9.8
Road shape Intersection 20.6 19.6 22.4 31.0
Segment 79.0 79.4 77.5 69.0
Ramp or other 0.4 1.0 0.1 0.0
Surface deficiency Normal 98.7 97.4 99.1 99.2
Other 1.3 2.6 0.9 0.8
Surface status Dry 86.6 87.3 84.3 77.6
Wet 13.0 12.2 15.5 22.4
Other 0.4 0.5 0.2 0.0
Obstruction Yes 94.6 93.0 94.8 97.6
Table 4 (Continued )
Condition attribute Category Whole dataset (%) Weak pattern (strength = 1–2) (%)
Medium pattern (strength = 3–23) (%)
Strong pattern (strength = 25–35) (%)
Sight distance Good 89.6 87.9 89.7 93.9
Bad 8.3 7.7 9.1 4.1
Unknown 2.1 4.4 1.2 2.0
Signal type Regular 9.8 6.9 12.0 14.3
Flash 7.0 6.9 7.5 25.3
No signal 83.2 86.2 80.5 60.4
Signal condition Normal 15.9 12.1 18.6 39.6
Abnormal 0.2 0.3 0.2 0.0
No signal 83.9 87.6 81.2 60.4
Median Island 34.0 27.2 38.0 59.2
Marking 45.9 49.9 42.2 15.1
None 20.1 22.9 19.8 25.7
Roadside marking Yes 57.3 54.6 58.1 56.3
No 42.7 45.4 41.9 43.7
Weather Sunny or cloudy 88.8 88.7 86.9 84.1
Rainy 10.3 10.1 11.9 15.9
Other 0.9 1.2 1.2 0.0
Light condition With light 86.8 85.6 86.5 81.6
No light 13.2 14.4 13.5 18.4
The characteristics of the accident groups as well as the whole data are shown in Table 4. This shows that the accident char-acteristics of the whole dataset were relatively close to those clustered in the weak and medium rule strength. However, the accident characteristics of the high rule strength group appeared substantially different from the others and showed relatively high percentages of the following attributes: drivers were male and
young; drivers’ licenses were invalid; trips occurred between midnight and dawn; trip purposes were not specified; speed limit
was medium (51–79 kph); median was an island; crash positions were at intersections, signals were under flash operation; road surfaces were wet; roads had no obstructions; sight distances were good; and drivers were under the conditions of wearing
seatbelts, not talking on their cell phones and not drinking.
These results may suggest that the accidents with strong pat-terns, i.e. high rule strength, are most likely related to high-risk drivers. Young and male drivers, compared with elderly and female drivers, respectively, have been identified as high-risk drivers in many studies (Massie et al., 1995, 1997; Murray, 1997; Kim et al., 1998; Laapotti and Keskinen, 1998; Shinar and Compton, 2004). Drivers on road without a valid driver license have explicitly exhibited risky behavior. The road environment between midnight and dawn has been associated with a more risky driving environment compared with driving during day-time (Lin and Fearn, 2003; Keall et al., 2005). Although drivers who drive between midnight and dawn cannot be automatically considered as high-risk drivers, there is a high possibility that more high-risk drivers are among them since a relatively high percentage of these drivers are driving for no specific purpose. In other words, they are probably enjoying the night lifestyle and not driving for school, business or other necessary purposes.
In addition, accidents associated with strong patterns occur under conditions that may not appear for average or conservative
drivers. No obvious causes from the road or natural environ-ment were found in these patterns—neither obstructions on the road nor poor sight distance. Interestingly, these drivers were not using cell phones, had not drunk alcohol and were wear-ing seatbelts. This shows that they were rational drivers and were following the law. In particular, it might reflect the culture differences in drinking—drinking is probably not as common for the young males in Taiwan as those in Western countries. As to the accident location, the findings met our expectations: single vehicle accidents occur more likely on road segments than at intersections. This may result from the fact that traffic flows at intersections are more complicated and subject to more conflicts; consequently, multi-vehicle accidents are more likely to happen at intersections. However, since most SAV accidents with strong patterns at intersections turned out to be collisions with road facilities, this implies that facilities near intersections may be the critical contributing factor for high-risk drivers, espe-cially during the night when traffic is low, which encourages fast driving for some. Moreover, a wet road surface increases the difficulty of maneuvering a vehicle. The relatively high percent-age of wet surfaces as a factor in the occurrence of accidents with strong accident patterns may imply that the drivers have immature skills or that they are overconfident.
3.3. Results of multinomial logistic regression
To further explore the characteristics for each sub-dataset, we conducted multinomial logistic regressions for a variety of clustered accidents. Five models were devised and tested, including base model (whole dataset), weak strength model, medium strength model, weak plus medium model and medium plus strong model. For fair comparisons, all models were esti-mated with an identical specification which was developed based
Table 5
Estimating results of MNL models
Accident typea Whole (base) Weak strength Medium strength W + M M + S
Coefficient Odds ratio Coefficient Odds ratio Coefficient Odds ratio Coefficient Odds ratio Coefficient Odds ratio Structure Intercept −2.456**b 0.952* −3.433** −2.304** −3.574** Age Middle-aged 0.060 1.061 0.292 1.339 0.376 1.457 0.021 1.021 0.420 1.521 Elderly −0.236 0.790 −0.840 0.432 −0.159 0.853 −0.263 0.769 −0.140 0.869 Trip time Peak period −0.430* 0.651 −0.429 0.651 −1.449** 0.235 −0.454* 0.635 −1.443** 0.236 Off-peak period −0.063 0.939 −0.031 0.969 −0.431 0.650 −0.096 0.909 −0.408 0.665 Drinking Drinking 0.579** 1.785 0.292 1.340 0.766** 2.151 0.549** 1.732 0.801** 2.228 Road shape Intersection −0.204 0.815 0.889** 2.433 −0.758* 0.469 −0.151 0.860 −0.825* 0.438 Median Island −1.222** 0.295 −1.120** 0.326 −2.005** 0.135 −1.194** 0.303 −2.061** 0.127 Marking 0.316 1.372 −0.769* 0.463 0.559 1.749 0.238 1.269 0.630* 1.877 Non-fixed object Intercept −4.724** −1.654* −22.207** −4.614** −22.256**
Age Middle-aged 0.168 1.182 0.935 2.548 –c – 0.151 1.163 – –
Elderly 0.925 2.523 0.770 2.160 – – 0.949 2.583 – –
Trip time Peak period −0.951 0.387 −0.802 0.448 – – −0.974 0.378 – –
Off-peak period 0.391 1.479 0.545 1.724 −0.411 0.663 0.374 1.454 −0.408 0.665
Drinking Drinking −0.452 0.636 −0.254 0.776 – – −0.477 0.621 – –
Road shape Intersection −0.858 0.424 0.231 1.260 – – −0.827 0.437 – –
Median Island −0.804 0.448 −0.848 0.428 16.728** 1.8E+07 −0.726 0.484 16.650** 1.7E+07 Marking 0.031 1.032 −0.922 0.398 17.507** 4.0E+07 −0.021 0.979 17.490 3.9E+07
Work zone Intercept −4.091** −0.913 −4.984** −3.941** −5.156**
Age Middle-aged 0.784 2.191 1.139* 3.123 0.892 2.441 0.723 2.061 0.977 2.657
Elderly 0.973 2.646 0.761 2.140 – – 0.927 2.526 – –
Trip time Peak period −0.327 0.721 −0.376 0.686 −0.802 0.449 −0.379 0.685 −0.771 0.463 Off-peak period −0.209 0.811 −0.036 0.964 −1.382 0.251 −0.250 0.779 −1.358 0.257
Drinking Drinking −0.889 0.411 −0.427 0.653 – – −0.913 0.401 – –
Road shape Intersection −0.174 0.840 0.713 2.041 0.225 1.253 −0.125 0.882 0.157 1.170 Median Island −1.729** 0.177 −2.537** 0.079 −0.485 0.616 −1.670** 0.188 −0.482 0.617 Marking −0.619 0.538 −1.550** 0.212 −0.416 0.660 −0.673 0.510 −0.340 0.712
Off-road Intercept −1.770** 1.468** −2.596** −1.654** −2.703**
Age Middle-aged −0.121 0.886 0.144 1.155 0.071 1.074 −0.147 0.863 0.095 1.099
Elderly 0.214 1.239 −0.336 0.714 0.233 1.263 0.203 1.225 0.237 1.267
Trip time Peak period 0.391** 1.479 0.005 1.005 0.360 1.433 0.377** 1.458 0.363 1.438 Off-peak period 0.464** 1.590 0.105 1.110 0.587** 1.799 0.443** 1.558 0.603** 1.827 Drinking Drinking 0.333** 1.395 −0.293 0.746 0.655** 1.926 0.303** 1.354 0.687** 1.988 Road shape Intersection −1.124** 0.325 0.166 1.180 −1.587** 0.204 −1.075** 0.341 −1.634** 0.195 Median Island −1.350** 0.259 −1.148** 0.317 −1.471** 0.230 −1.284** 0.277 −1.561** 0.210 Marking −0.167 0.847 −1.125** 0.325 0.011 1.011 −0.216 0.806 0.054 1.056
Rollover Intercept −3.198** 0.337 −6.386** −3.088** −6.529**
Age Middle-aged −0.604** 0.547 −0.077 0.926 −0.751 0.472 −0.615** 0.541 −0.719 0.487 Elderly −0.235 0.791 −0.758 0.469 −0.400 0.670 −0.198 0.821 −0.468 0.626 Trip time Peak period 0.352 1.422 −0.038 0.963 0.872 2.393 0.355 1.427 0.851 2.343 Off-peak period 1.078** 2.937 0.874** 2.396 1.853** 6.378 1.067** 2.908 1.870** 6.490 Drinking Drinking −0.574* 0.563 −0.508 0.602 −19.701 0.000 −0.606** 0.546 −19.670 0.000 Road shape Intersection −0.889** 0.411 −0.131 0.878 −0.213 0.808 −0.875** 0.417 −0.155 0.856
Median Island −0.289 0.749 −0.293 0.746 0.832 2.298 −0.228 0.796 0.779 2.180
Marking −0.121 0.886 −0.948* 0.387 1.158 3.185 −0.177 0.837 1.237 3.447
Other Intercept −3.373** 0.253 −5.367** −3.218** −5.523**
Age Middle-aged 0.237 1.267 0.602* 1.825 0.941* 2.563 0.205 1.227 0.991* 2.693
Elderly 0.924** 2.520 0.562 1.754 – – 0.902** 2.464 – –
Trip time Peak period 0.272 1.313 0.036 1.036 −0.508 0.602 0.236 1.266 −0.484 0.617 Off-peak period −0.122 0.886 −0.285 0.752 −0.105 0.900 −0.147 0.863 −0.077 0.926
Table 5 (Continued )
Accident typea Whole (base) Weak strength Medium strength W + M M + S
Coefficient Odds ratio Coefficient Odds ratio Coefficient Odds ratio Coefficient Odds ratio Coefficient Odds ratio Drinking Drinking 0.162 1.176 −0.037 0.963 −0.066 0.936 0.134 1.143 −0.043 0.958
Road shape Intersection 0.170 1.185 1.104** 3.016 0.170 1.186 0.188 1.207 0.144 1.155
Median Island −0.233 0.792 −0.216 0.806 −0.920 0.398 −0.202 0.817 −0.968 0.380
Marking 0.363 1.437 −0.655 0.519 0.870 2.386 0.286 1.331 0.945 2.574
aThe reference category for accident type is collision with road facility, for age is young, for trip time is midnight, for drinking is not drinking, for road shape is segment, and for median is no median.
b *Significance level for Waldχ2statistic at 0.10;**significance level for Waldχ2statistic at 0.05. c(–) Cell with zero accident count.
on the whole dataset. Based on concerns about sample size and the limitation of logistic regression, only those attributes showing up in over 35% of the rules were considered, which included age, trip time, drinking condition, speed limit, road shape, median and roadside marking. Moreover, to avoid empty cells, some small categories which represented unclear condi-tions, such as unknown or other, were excluded (413 cases were excluded). The likelihood ratio test at the significance level of 0.10 was adopted to select the variables. This resulted in five variables being included in the final specification. They were, age (young, middle-aged, elderly), trip time (peak, off-peak, midnight), drinking (not drinking, drinking), road shape (intersection, segment) and median (island, marking, none). The estimation results for the proposed models are shown inTable 5, where the reference accident type was set to the collision with
road facility. All models were shown to be well fitted based on
theχ2goodness of fit tests at the significance level of 0.10. Over-all, we were able to see that some significant differences existed among the models.
From the results of the base model inTable 5, we could clearly identify several factors contributing significantly to a variety of accident types. They were interpreted, based on the comparison to collisions with road facilities, in detail as follows:
(1) Young drivers, compared to collisions with road facilities, were more likely to be involved in rollover accidents. The odds of a middle-aged driver involved in rollover crashes was 0.547 times that of a young driver. This is consistent with past studies that young drivers exhibit higher percent-ages of rollover accidents (Farmer and Lund, 2002) than other age groups.
(2) The odds ratios show that midnight accidents were more likely to be related to collisions with structures, and day-time accidents were more likely to be off-road and rollover accidents. These findings can be related to visibility of struc-tures which are not as easily identified during the night time compared to regular road safety facilities. On the other hand, since fixed facilities can be better spotted and avoided dur-ing daytime, both off-road and rollover accidents are more likely to occur than collisions with road facilities. This may suggest that during daytime, drivers themselves, not road facilities, play a key role in the occurrence of single auto-vehicle accidents.
(3) Drunk drivers tend to lose situational awareness and are much likely to lose control of their vehicles and hit structures or generate off-road accidents compared with crashing into road facilities. The odds of a drinking driver involved in collisions with structures and in off-road crashes compared to collisions with road facilities were 1.785 and 1.395 times, respectively, the odds a not-drinking driver would.
(4) Intersections, where more road facilities (such as traffic lights) are expected and where vehicles tend to slow down, are more likely to have collisions with road facilities. On the other hand, off-road and rollover accidents are more likely to occur on road segments. These results were clearly shown in odds ratio values.
(5) Referring to collisions with road facilities, the low odds ratios (0.295, 0.177 and 0.259) clearly suggest that roads with median islands could significantly reduce collisions with structures, work zones and off-road accidents. This result reflects the fact that higher road standards with bet-ter safety facilities help reduce some accidents, but will also create pitfalls if the safety facilities are not properly provided.
Additionally, results from models with different rule strengths show some very interesting characteristics of accidents and were also observed and are worth noting.
(1) The results from the weak strength model showed many differences. This may imply that the characteristics of acci-dents occurring uniquely are highly different from acciacci-dents with medium or strong rule strength. The age, trip time and drinking attributes played insignificant roles in differentiat-ing the accident types, except work zone accidents, under the weak strength model. On the other hand, road-facility-related attributes (including road shape, median island and median marking) contributed significantly in differentiat-ing the accident types under weak strength accidents. This is consistent with the fact that the occurrence of weak rule strength accidents is rather stochastic on poorly constructed roads.
(2) In comparing the medium plus strong model with the medium strength one, the differences were slight. It may be because of the fact that the sample size of accidents with strong strength was relatively small (7.86% of the total
accidents). The only difference was the occurrence of col-lisions with structures on the roads with median marking. The significantly high possibility of drivers associated with the strong rule strength being involved in collisions with structures suggests that there is a small portion of high-risk drivers who may easily ignore the unfavorable road attributes.
(3) The median island attribute showed very consistent estima-tion results among all models. Almost all coefficients under this category were negative and significant. This may sug-gest that the relatively higher safety standards of roads with median islands reduce the occurrence of facility-irrelevant accidents.
(4) Except for the weak strength model, the intersection area which is equipped with more facilities than road segments is consistently prone to the occurrence of facility-related accidents.
(5) Except for the weak strength model, the drinking attribute showed positive signs towards the structure and off-road types under all models. This may result from the fact that drunk drivers usually drive faster, have lower capability of handling their vehicles and are in lower awareness of traffic and road conditions.
(6) As for the trip time attributes, the coefficients of off-road and rollover types were consistently and positively signifi-cant among most models during off-peak periods. This may suggest that drivers themselves, rather than the road envi-ronment (structure, work zone, facility, etc.), play the key role in the occurrence of single auto-vehicle accidents. In summary, the findings from MNL analyses indicate that drivers involved in accidents with strong rule strength are at somewhat high-risk, although the sample size compared to gen-eral drivers is limited and only part of their associated attributes can be specifically identified. Therefore, corresponding coun-termeasures may be focused on enhancing drivers’ awareness of potential threats on roads and on their dangerous driving behaviors. On the other hand, it was found that rather than the driver and trip characteristics, road facilities – such as median and roadside marking – play the key role in acci-dents associated with weak rules. Thus, improvement in the quality of road maintenance may prevent such accidents. It is clear that countermeasures designed to target accidents with strong and with weak rules should focus on different preventive aspects.
4. Discussion
This paper grouped accidents from the chain perspective in order to analyze the heterogeneity in accident data. A comparison of the characteristics of sub-datasets with vari-ous occurring frequencies was also made. A non-parametric clustering method – rough set theory supplemented with sta-tistical tests and logistic regression models – was primarily used. The empirical results have shown that the accident characteristics of filtered and unfiltered dataset are somewhat different.
4.1. Heterogeneity
The heterogeneity discussed in this paper is different from past studies. It is based neither on driver characteristics (such as age or gender) nor on environmental characteristics (such as urban or rural roads). Instead, the heterogeneity discussed here originated from a hypothesis in which the features of frequently repeated accident processes and that of sparsely unique ones may be essentially different. The distinct features of accident groups uncovered in this empirical study did show the possible existence of such heterogeneity. The accidents associated with weak rules occur rather uniquely. Since they occur by chance and tend not to lead to similar consequences under similar processes and conditions, it is intuitively expected that it would be rela-tively inefficient to devise the corresponding countermeasures for them. Surprisingly, it is observed that those accidents are heavily related to the road environment and could be possibly improved by providing adequate road facilities.
Countermeasures for traffic accidents have previously focused either on the drivers who break laws, such as drunk drivers or speed offenders, or on road design, like building better roads. Although these measures are generally known and effec-tive, less attention is put on identifying the risky but rational drivers associated with the strong pattern accidents. This indi-cates more research is needed to identify such drivers and to set up the specific measures to prevent such accidents. It should be noted that preventing accidents associated with weak patterns is as crucial as preventing those with strong patterns. However, the efficiency of specifically designed countermeasures to prevent accidents related to strong patterns will be heightened since acci-dents associated with the weak patterns are highly diverse. Thus, when detailed heterogeneous accident information is taken into account, countermeasures, such as on-board warning messages and smart roadside safety facilities which try to provide accu-rate safety information to right drivers at right statuses (FHWA, 2006), are expected to be effective against the occurrence of strong pattern accidents and are worth being studied.
4.2. Aggregation bias
The issue of aggregation biases has been noticed and studied by many researchers (Davis, 2004; Hewson, 2005; Vlahogianni et al., 2004; Walker and Catrambone, 1993), of whichDavis (2004) presented a thorough discussion using simulated data. He argued that since accident data have no independent status, the statistical regularities are simply the result of aggregating particular types and frequencies of mechanisms. The process implemented in this study could run into similar issues. Despite the difficulty, the proposed procedure does lay a concrete basis for understanding accident scenarios and paves a way for further study with detailed design experiments, which is being examined in our other research project.
Analyzing each rule instead of accident groups provides a possible way to alleviate such problems. Each rule herein is treated as an individual mechanism since rules are derived under the condition controlled by many critical factors. By examining the characteristics of each rule classified as strong patterns, we
find that most rules do support the findings from crosstab analy-sis (Table 4) and MNL models (Table 5), wherein accidents with strong patterns indicate that the drivers involved are in some-what high-risk danger. Although the features of individual rules do not completely agree with the results from MNL models, the result, nevertheless, suggests that the proposed approach can be effective in processing the heterogeneous accident data and that understanding the contributing factors of those large member rules can be advantageous.
It is unfortunately far more difficult to interpret individual rules under the weak and medium strength model since the num-ber of rules runs into hundreds. An alternative way is to relax a little on the pattern requirements after the most (and least) impor-tant attributes have been identified. This can be achieved by using an index called significance of attributes (Pawlak, 1991). This index evaluates the number of objects that cannot be distin-guished with the elementary sets when one condition attribute is dropped from the model. In doing so, the number of rules is expected to decrease. However, the thoroughness of the accident processes described by the rules will also decrease at the same time. The issue of overwhelming number of rules derived from rough set theory has also been noticed by researchers (Løken and Komorowski, 2001) and requires further study.
5. Conclusions
Seeing that the heterogeneity of accident data in conventional approaches was usually pre-specified or determined with only a few factors, this study proposed an objective approach and has pioneered in exploring the heterogeneity from the perspective of accident chains. The empirical results showed significantly different features between frequently repeated and unique rules for Taiwan’s single auto-vehicle accidents. This confirmed our initial speculation. Moreover, the drivers involved in accidents with frequently repeated rules reflected the characteristics of high-risk drivers shown in various studies. These characteris-tics were not limited to driver characterischaracteris-tics and included all critical factors related to accident occurrences. The result sug-gests that the proposed approach has the potential to precisely identify high-risk drivers. On the other hand, it is road condi-tions that played the key role in accidents associated with unique rules. That is to say, certain road conditions are safe under aver-age circumstances. However, when combined with other risk factors, though it rarely happened, the safe road conditions may still become dangerous. This suggests that road design, road fur-niture, road maintenance, traffic control and work zone set-up should be considered in a more comprehensive perspective; and as a consequence, there may be fewer accidents corresponding to unexpected circumstances.
This study has taken a step forward in the direction of explor-ing the heterogeneity in accident data. The proposed approach can be adopted in other datasets or be used to analyze differ-ent acciddiffer-ent outcomes. However, the results may vary due to the differentiation in local factors, such as regional culture and safety policies. In addition, it is important to emphasize that issues including possible aggregation biases and the overwhelm-ing number of rules have limited our analysis. The derived rules
could help reveal the aggregation bias in the process of retriev-ing contributretriev-ing factors. To resolve the issue of aggregation bias and shed light on the whole features of accidents by using the rule-based approach, however, needs further research. An exper-imental design where the environmental settings are based on the strong rules and the contributing factors under MNL would be helpful. In addition, it is worth exploring and understand-ing drivunderstand-ing behaviors associated with accidents for settunderstand-ing up possible interventions.
Acknowledgments
The authors would like to thank the anonymous referees for their helpful suggestions and comments, and the National Sci-ence Council of Taiwan for providing the research grant (NSC 95-2221-E-009-317).
References
Abdel-Aty, M., Keller, J., Brady, P., 2005. Analysis of types of crashes at signal-ized intersections by using complete crash data and tree-based regression. Transport. Res. Rec. 1908, 37–45.
Cameron, C., Trivedi, P., 2005. Microeconometrics: Methods and Applications. Cambridge University Press, New York.
Chang, L.Y., Wang, H.W., 2006. Analysis of traffic injury severity: an application of non-parametric classification tree techniques. Accident. Anal. Prev. 38 (5), 1019–1027.
Clarke, D.D., Forsyth, R., Wright, R., 1998. Behavioural factors in accidents at road junctions: the use of a genetic algorithm to extract descriptive rules from police case files. Accident. Anal. Prev. 30 (2), 223–234.
Clarke, D.D., Forsyth, R., Wright, R., 2005. A statistical profile of road accidents during cross-flow turns. Accident. Anal. Prev. 37 (4), 721–730.
Davis, G., 2004. Possible aggregation biases in road safety research and a mechanism approach to accident modeling. Accident. Anal. Prev. 36 (6), 1119–1127.
Elvik, R., 2003. Assessing the validity of road safety evaluation studies by analyzing causal chains. Accident. Anal. Prev. 35 (5), 741–748.
Farmer, C., Lund, A., 2002. Rollover risks of cars and light trucks after account-ing for driver and environmental factors. Accident. Anal. Prev. 34 (2), 163–173.
FHWA, 2006. Safety Applications of Intelligent Transportation Systems in Europe and Japan. FHWA-PL-06-001. Federal Highway Administration, Department of Transportation, Washington, DC.
Grzymala-Busse, J.W., 1992. LERS—A system for Learning from Examples Based on Rough Sets. Handbook of Applications and Advances of the Rough Sets Theory. Kluwer Academic Publisher, Dordrecht.
Grzymala-Busse, J.W., Werbrouck, P., 1998. On the best search method in the LEM1 and LEM2 Algorithms. In: Orlowska, E. (Ed.), Incomplete Infor-mation: Rough Set Analysis. Physica-Verlag, Heidelberg, New York, pp. 75–91.
Hewson, P., 2005. Epidemiology of child pedestrian casualty rates: can we assume spatial dependence? Accident. Anal. Prev. 37 (4), 651–659. Juarez, P., Schlundt, D.G., Goldzweig, I., Stinson N.Jr., 2007. A conceptual
framework for reducing risky driving behaviors among minority youth. Injury Prevent. 12, 49–55.
Karlaftis, M., Golias, I., 2002. Effects of road geometry and traffic volumes on rural roadway accident rates. Accident. Anal. Prev. 34 (3), 357–365. Karlaftis, M., Tarko, A., 1998. Heterogeneity considerations in accident
model-ing. Accident. Anal. Prev. 30 (4), 425–433.
Keall, M., Frith, W., Patterson, T., 2005. The contribution of alcohol to night time crash risk and other risks of night driving. Accident. Anal. Prev. 37 (5), 816–824.
Kim, K., Li, L., Richardson, J., Nitz, L., 1998. Drivers at fault: influences of age, sex, and vehicle type. J. Saf. Res. 29 (3), 171–179.
Laapotti, S., Keskinen, E., 1998. Differences in fatal loss-of-control accidents between young male and female drivers. Accident. Anal. Prev. 30 (4), 435–442.
Lin, M., Fearn, K.T., 2003. The provisional license: nighttime and passenger restrictions—a literature review. J. Saf. Res. 34 (1), 51–61.
Løken, T., Komorowski, J., 2001. Rough modelling—a bottom-up approach to model construction. Int. J. Appl. Math. Comput. Sci. 11 (3), 675–690. Magazz`u, D., Cornelli, M., Marinoni, A., 2006. Are car drivers holding a
motorcycle license less responsible for motorcycle-car crash occurrence? A non-parametric approach. Accident. Anal. Prev. 38 (2), 365–370. Massie, D., Campbell, K., Williams, A., 1995. Traffic accidents involvement
rates by driver age and gender. Accident. Anal. Prev. 27 (1), 73–87. Massie, D., Green, P., Campbell, K., 1997. Crash involvement rates by driver
gender and the role of average annual mileage. Accident. Anal. Prev. 29 (5), 675–685.
Murray, A., 1997. The home and school background of young drivers involved in traffic accidents. Accident. Anal. Prev. 30 (2), 169–182.
Park, Y.J., Saccomanno, F., 2005. Collision frequency analysis using tree-based stratification. Transport. Res. Rec. 1908, 121–129.
Pawlak, Z., 1982. Rough sets. Int. J. Comput. Inf. Sci. 11 (5), 341–356.
Pawlak, Z., 1991. Rough Sets: Theoretical Aspects of Reasoning about Data. Kluwer Academic Publishers Group, The Netherlands.
Pawlak, Z., Skowron, A., 2007. Rudiments of rough sets. Inf. Sci. 177 (1), 3–27.
Shinar, D., Compton, R., 2004. Aggressive driving: an observational study of driver, vehicle and situational variables. Accident. Anal. Prev. 36 (3), 429–437.
Stewart, J., 1996. Applications of classification and regression tree methods in roadway safety studies. Transport. Res. Rec. 1542, 1–5.
Vlahogianni, E., Golias, J., Karlaftis, M., 2004. Short-term traffic forecasting: overview of objectives and methods. Transport Rev. 24 (5), 533–557. Walczak, B., Massart, D.L., 1999. Rough sets theory. Chemom. Intell. Lab. Syst.
47 (1), 1–16.
Walker, N., Catrambone, R., 1993. Aggregation bias and the use of regression in evaluating models of human performance. Hum. Factors 35 (3), 397–411. Washington, S., Karlaftis, M., Mannering, F., 2003. Statistical and Econometric Methods for Transportation Data Analysis. Chapman & Hall/CRC Press, Boca Raton, FL.
Wong, J.T., Chung, Y.S., 2007. Rough set approach for accident chains explo-ration. Accident. Anal. Prev. 39 (3), 629–637.