Systems Engineering Society of China and Springer-Verlag Berlin Heidelberg 2014
DATA DRIVEN MODELING FOR POWER TRANSFORMER LIFESPAN
EVALUATION
Charles V. TRAPPEY1 Amy J.C. TRAPPEY2 Lin MA3 Wan-Ting TSAO4
1Department of Management Science, National Chiao Tung University, Taiwan, China
2Department of Industrial Engineering and Engineering Management, National Tsing Hua University, Taiwan, China
3School of Chemistry, Physics and Mechanical Engineering, Queensland University of Technology, Australia
4Department of Industrial Engineering and Engineering Management, National Tsing Hua University, Taiwan, China
[email protected] Abstract
Large sized power transformers are important parts of the power supply chain. These very critical networks of engineering assets are an essential base of a nation’s energy resource infrastructure. This research identifies the key factors influencing transformer normal operating conditions and predicts the asset management lifespan. Engineering asset research has developed few lifespan forecasting methods combining real-time monitoring solutions for transformer maintenance and replacement. Utilizing the rich data source from a remote terminal unit (RTU) system for sensor-data driven analysis, this research develops an innovative real-time lifespan forecasting approach applying logistic regression based on the Weibull distribution. The methodology and the implementation prototype are verified using a data series from 161 kV transformers to evaluate the efficiency and accuracy for energy sector applications. The asset stakeholders and suppliers significantly benefit from the real-time power transformer lifespan evaluation for maintenance and replacement decision support.
Keywords: Condition based maintenance (CBM), prognostics and health management (PHM), logistic
regression, remaining life prediction, sustainable engineering asset management
1. Introduction
The asset condition data collected often fail to prevent emergency shutdowns and costly interruptions of services. Especially for the electrical power supply industry, electrical outages cause great dissatisfaction with both residential and industrial users and potentially
devastating losses to society. Thus, the means to ensure a sustainable and reliable power supply is crucial to both public and private sectors. Arshad et al. (2004) and Jardine et al. (2006) indicate that a condition-based maintenance (CBM) approach improves transformer’s performance, reliability and technical life. Further, a transformer’s timely
replacement and retirement is better planned based on its real time condition. Abu-Elanien & Salama (2010) present a comprehensive illustration of the transformer asset management activities which use condition monitoring techniques to design maintenance plans, investigate lower cost maintenance methods, assess transformer health, classify transformer lifetime type, and define the end of asset life criteria. Bangemann et al. (2006) proposed an integrated platform to constitute the framework of systems implementing remote maintenance and other applications related to asset management. Chen et al. (2011) use vector machines to analyze the failures of turbines in thermal power facilities. These models are useful tools for developing and implementing asset management systems and strategies. However, there is little research combining advanced asset lifespan prediction with real-time remote transformer condition monitoring data.
In this research, we study power transformers as an asset with a critical role in the power supply network. Large transformers are often placed in remote areas, so the operating health status might not be detected immediately even though scheduled maintenance and repairs are conducted. Many current transformer asset management systems lack intelligent and effective processes to prevent sudden power shut downs through improved forecasting capabilities to predict the remaining useful life (RUL) of the components and systems. This research uses real time condition monitoring data of power transformers to predict transformer RUL as well as operating conditions. The real time remote data collected include the amounts of combustible dissolved gas and furfural chemicals generated in the
transformer oil reservoir and other parameters associated with the transformer operating conditions. These condition data are used to evaluate the health status of the transformer and predict operating health and remaining life, similar to general machineries CBM and PHM practices (Wang et al. 2002, Lee et al. 2006). Using this outcome, decision makers are more informed when making critical operation and maintenance decisions. This expected result prevents unexpected failures and extends the life of a transformer towards optimal usage and life-cycle benefits.
2. Literature Review
In this section, the research literature related to transformer insulation deterioration and diagnosis methods of oil-immersed transformers are discussed.
2.1 Insulation Deterioration of Oil-Immersed Transformers for Lifespan Evaluation
Oil-immersed transformers are made of materials including copper, aluminum and other conductive materials such as steel-based core silicon materials, steel, stainless steel, insulating oil, insulating paper, pressed cardboard, and other structural and insulating materials. Among these materials, the insulating paper and oil will undergo significant electrical and mechanical degradation over time and, therefore, are viewed as good indicators for predicting a transformer’s remaining life. The causes of deterioration and their classifications are described as follows. (1) Deterioration of solid insulation paper: When there are abnormalities during transformer operations, the solid insulation discharges gases
such as CO, CO2, H2 and C2H4. When the
insulation paper is heated under low temperature for long periods of time, CO and CO2 are the
primary gases discharged. Further, the insulation paper will produce H2, C2H4 and other harmful
gases while operating under high temperatures. Because these gases are flammable, they can cause the transformer to malfunction and even explode. The rapid increase of these gases is a definite indicator of the degradation of transformer performance and remaining life. (2) Deterioration of insulating oil: The insulating oil decomposes and releases various types of gases, including CH4 at low temperatures and H2
at high temperatures. If the insulating oil has an electrical current, then C2H2 and C2H4, in
addition to H2 and CH4, may also be produced
(Zheng 1993).
Since the insulating oil can be replaced during the years of operation, the life of the insulating paper can be extended and better predict the life of transformer. Further, the degree of polymerization and tensile strength of insulation paper may indicate that the remaining life of a transformer has already been reduced. Based on the degree of polymerization of the insulating paper, many researchers have established a baseline for estimating the remaining life of a transformer (Wouters et al. 2011, Stebbins et al. 2003). Liao et al. (2009) experimentally verified that the furfural contents and carbon oxides influence the aging rate of insulating paper. Pradhan & Ramu (2005) used carbon monoxide, carbon dioxide, 2-Furaldehyde, total Furan contents, 2-Acetylefuran and 5-Methyle-2-Furfural to calculate the aging of insulating paper to estimate transformer life.
2.2 Diagnostic Methods for Transformers
Dissolved gas-in-oil analysis is considered the most effective health diagnostic approach for transformers (Mosinski & Piotrowski 2003). At present, popular references for calculating the content ratio and type of gas-in-oil are based on IEEE and IEC standards (Institute of Electrical and Electronics Engineers 2009, International Electrotechnical Commission 2007). The IEEE Standard C57.104 (Institute of Electrical and Electronics Engineers 2009) describes the Doernenburg ratio method and Rogers ratio method used to evaluate the possible fault type by analyzing separate combustible gases generated. The Doernenburg diagnosis uses five different oil gases including H2, CH4, C2H2,
C2H4, and C2H6. These key gases are useful to
calculate four ratios: R1=CH4/H2, R2=
C2H2/C2H4, R3=C2H2/CH4 and R4=C2H6/C2H4,
which determine failure modes such as thermal decomposition, low-intensity partial discharge, and high-intensity partial discharge. Rogers diagnosis uses five gases, H2, CH4, C2H2, C2H4,
and C2H6, to compute three gas ratios, i.e., R1,
R2 and R5= C2H4/C2H6, as the fault diagnosis
parameters. The diagnostic results are classified into six potential fault types. The diagnostic types are normal (no fault), low-energy density arcing, arcing with high-energy discharge, low temperature thermal, thermal lower than 700℃, and thermal higher than 700℃. Using the IEC 60599 specifications (International Electro technical Commission 2007), the Duval Triangle method was derived to determine whether hydrocarbon gases or hydrogen exceeds the safety limits and whether the gas generation levels are within a given limit. If the limit is reached, then the engineer calculates the total
accumulated amount of CH4, C2H2 and C2H4 and
divides each gas by their total summation amount (in terms of percentage). The plot of these gas’ percentages in the Duval Triangle help diagnose the fault types of the given transformer (International Electrotechnical Commission 2007), e.g., discharge of low or high energy, thermal faults, etc.
2.3 Applications of Logistic Regression
Logistic regression (LR) is known as a generalized linear regression model for fitting a model to a data set which may contain continuous, discrete, or mixed variables. Trappey et al. (2011a) applied logistic regression to predict RFID technology maturity based on the cumulative numbers of RFID patents filed over a period of years. The cumulative numbers of patents are plotted to fit an S-curve, which is used to explore RFID technology lifecycle trends. Since the S-curve has symmetry at the inflection point, the inflection point may be used to identify and predict the maturity of research and development strategies. Duda et al. (2001) applied logistic regression as a pattern classification approach to solve automatic dual-categorization problems and to interpret the relationships between independent and dependent variables of given patterns. Further, Liao et al. (2006) also use a logistic regression model to predict remaining life of bearings in rotating part machinery. However, there is little research which forecasts remaining asset life using logistic regression. In this study, we apply logistic regression, combined with the Weibull distribution, to predict the remaining life of a transformer in service.
2.4 Applications of the Weibull Distribution
Asset maintenance is necessary to keep assets (e.g., equipment, machinery) operating within normal parameters and healthy conditions. Assets include long-life structures such as bridges, dams, and skyscrapers which are important targets in CBM and PHM. Some literature report Structure Health Monitoring (SHM) solutions using remote sensor technologies to collect health or damage data for prognostic and analytical model prediction (Balageas et al. 2006, Farrari & Lieven 2007). Further, Markov Chains are commonly applied for structural asset remaining life prediction (Yu et al. 2010).
For transformer health management, conventionally pre-scheduled maintenance is effective, although the cost is high. In order to reduce costs, Suwanasri & Suwanasri (2009) use an engineering asset management system to systematically record failure statistics, the equipment condition data, the environment information, operational status, fault details, and other related information to build predictive models. Researchers apply the Weibull distribution for engineering asset life forecasting (Abernethy 2006). The Weibull distribution is adopted to compute the failure probabilities of different components for a given transformer. By identifying the most important components, operating efficiencies, and by calculating the transformer’s remaining life, maintenance personnel are better enabled to improve strategies for maintenance and management.
Jahromi et al. (2009) use a set of transformer data to calculate a Health index (HI) value including dissolved gas, oil condition, furfural
contents, historical load conditions, maintenance data, and objective and quantitative indicators of transformer on-site inspections. The HI values are used to calculate the transformer failure probability and are fitted to the Weibull distribution to estimate the remaining life. This approach demonstrates that the Weibull distribution is useful for formulating strategic transformer maintenance programs for extensive lifetime usage.
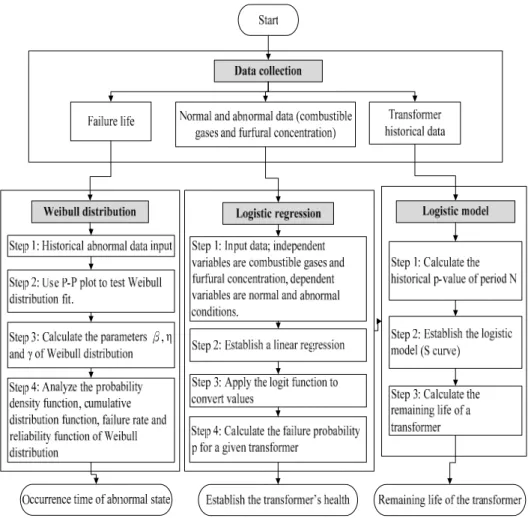
3. Lifespan Evaluation Methodology
The normal and abnormal field data collectedfrom a transformer, both historically and in real time are used to create a logistic regression model. The logistic regression model calculates the failure probability value P. By computing the P value for a given transformer, the logistic model is used to calculate the expected life. In combination, the Weibull distribution is used to calculate the failure mean time and estimate the time of occurrence of different abnormal conditions. The data-driven lifespan evaluation modeling process is developed and implemented as an analytical module in Figure 1.
Logistic regression as proposed by Berkson (1944) is similar to regression analysis and treats the dependent variable as a binary variable. Many scholars note the advantages of logistic regression for dependent variables with two categories of nominal variables. This method can also be used to predict the odds ratio of events. The logistic regression curve yields an S-function for the analysis of data as a probability model. By classifying output variables as 0 or 1 (“normal” and “abnormal”), the odds ratio is defined as the probability that one thing will happen divided by the probability that it will not happen. If the probability P(Y) = 0.5 is set as the cut off value, then values above 0.5 are identified as 1. When the dependent variable is a binary variable, then the results are either normal (Y = 0) or abnormal (Y = 1), and the general linear regression model Y is expressed as Equation (1):
0 1 1 2 2 k k
Y X X X (1) where Xk represents the kth value of the input variable. However, using the general linear regression model to predict binary dependent variables, the dependent variable estimates may fall outside (0, 1). Therefore, a logistic regression transfer function known as the logit function, ln(p/1p), is used to convert the results to linear form, as shown in Equations (2) and (3):
0 1 , ln k i i i p g x p
i=1,,k (2) or 1 1 g p e (3)where p is the failure probability. The failure probability divided by normal probability p/(1p)
is called the odds ratio, and ln(p/(1p)) is called the odds logarithm. In other words, let
x x1, , ,2 xk
,
and assume p
is thefailure probability which belongs to the logistic distribution. Then,
1|
1 1 g p p Y F g e (4)where g
and p has a positive relationshipand the logit function converts the output p-value to (0, 1).
4. Building a Sustainable Engineering
Asset Management Network
A sustainable network system for remote terminal units (RTU) engineering asset management (EAM) is developed in this research for the power industry which can also be configured and generalized for other asset intensive industries. The framework of the RTU-based EAM system includes real-time condition parameters and historical data monitoring, real-time fault diagnosis, and remaining life estimation for decision support. The case study in Sections 4.2, 4.3, and 4.4 describes the application of the logistic regression model with the Weibull distribution for establishing the transformers’ lifespan evaluation. Accordingly, the historical and real-time data are collected and organized empirically to build the RTU-based EAM network system. Logistic regression calculates the historical p-value of period N, and the resulting model is used to estimate the remaining life of a transformer. Further, the Weibull distribution analyzes the likely failure conditions of the transformer.
4.1 The RTU System Design
As shown in Figure 2, there are three data sources feeding condition data to the engineering asset data warehouse. Users collect real time data, manage historical test data, diagnose transformer conditions, and calculate the transformer lifespan using the RTU system network platform.
Data sources are divided into three categories including real time data, historical data, and general equipment information, to build the engineering asset database. Remote sensors are installed on transformers to measure and record voltage, current, temperature and dissolved gases. These data are transferred to the database continuously over the information network. Periodic test reports are generated and the data records, such as combustible gases and furfural concentrations, are updated in the database. The real time data are systematically integrated with the historical data. Further, the identification data of the transformers (i.e., equipment information), including equipment number, equipment series, and the installation records, are used as relational database keys. All data are consolidated and organized into an engineering asset data warehouse to support system modules for monitoring and diagnosing transformer conditions and evaluating their life spans.
The system modules are divided into condition monitoring and diagnosis and lifespan evaluation. The condition monitoring and diagnosis includes parameter tracking and faults diagnosis, which have been studied previously (Trappey et al. 2011b). The parameter tracking displays the load condition of voltage, current, temperature and dissolved gas. The transformer condition is diagnosed using the IEEE Doernenbur ratio, IEEE Rogers ratio, and IEC
Duval triangle approaches. If alarm levels are reached, the website notifies equipment engineers by sending a mobile phone short message to request an emergency response. There are two lifespan evaluations, using logistic regression and the Weibull distribution, for accurate maintenance and replacement decisions. Therefore, by using the intelligent system modules, asset stakeholders, managers, engineers, and asset maintenance providers can monitor, control, and improve the transformer lifetime usage conditions.
4.2 Logistic Regression Model – Case Example
For the case study, 679 data points obtained from a series of 161 kV transformers were collected. The data set contained 623 normal data sets and 56 abnormal data sets, which were fitted to the logistic regression (LG) model. The independent variables include 9 combustible gases, the sum of combustible gases, and 5 furfural concentrations. These variables are oxygen (O2), nitrogen (N2),
carbon dioxide (CO2), carbon monoxide (CO),
hydrogen (H2), methane (CH4), ethane (C2H6),
ethylene (C2H4), acetylene (C2H2), total
combustible gases (TCG), 5-Hydroxymethyl- 2-Furaldehyde (5-HMF), 2-Furaldehyde (2-FAL), 2-Furfuryl Alcohol (2-FOL), 2-Acetylfuran (2-ACF), and 5-Hydroxymethyl-2-Furaldehyde (5-MEF). The dependent variable is a binary variable of 0 (normal) or 1 (abnormal). Using Predictive Analytics Software statistics (IBM 2011), six condition variables are used to build the backward conditional linear regression (LR) model as shown in Equation (5). Further, Equation (5) uses a logit function to convert outputs to the (0, 1) range. The probability
Data Sources Real Time Data from Sensors Historical Data from Off-line Tests Users System Administrator Asset Stakeholder, Manager and Engineers Engineering Asset Data Warehouse General Data (Equipment Information) System Modules Condition Monitoring and Diagnosis Parameters Tracking Faults Diagnosis - IEEE Doernenburg - IEEE Rogers - IEC Duval Triangle
Lifespan Evaluation Logistic regression Weibull distribution Power Transformer with Sensors Asset Maintenance Providers
Figure 2 A conceptual framework for a remote terminal unit (RTU) intelligent system network
p 0.5 indicates a normal operating mode, and p
0.5 indicates an abnormal mode. After comparing the 679 real observations with the corresponding prediction outputs, as shown in Table 1, the accuracy of the LR prediction achieves 94%. Table 2 shows the partial data sets of independent variables (columns A to P) and a dependent variable (column Q) applied to build the logistic regression model. The original data (from column A to column P) are inputs for Equation (5), which calculates the p-values (column Y). The lifespan predictions are determined (column X) by comparing values to the 0.5 threshold. The p-values of new data set are calculated and the health modes of corresponding transformers are derived using Equation (5).
g =4.4970.016[C2H4]+0.685[C2H2]
0.008[CO]+0.01[TCG]+0.244[2-ACF] 0.564[5-MEF] where = (C2H4, C2H2, CO,
TCG, 2-ACF, 5-MEF), the condition variables (5)
4.3 Lifespan Evaluation for a Specific Transformer
For the case study, four transformers, T1, T2, T3 and T4, are used to calculate the failure probabilities (p-values) using field data. Using the p-values (p) and the corresponding year (t) as inputs to the logistic model shown in Equation (6), Predictive Analytics Software statistics (IBM 2011) are applied to derive the coefficients a and b. For the case study, inputting values in columns A to P of Table 2 into Equation (5), the p-values (column Y) for a given transformer are
Table 1 The results of the LR model applied to the 161
kV transformer series
Predictions
Observations
Normal Abnormal (Total)
Normal 614 9 623 Abnormal 33 23 56
calculated. Using the p-values (column Y) and the current operating age as model inputs (6), the curve estimation logistic model is derived.
1 1 t p a b (6)
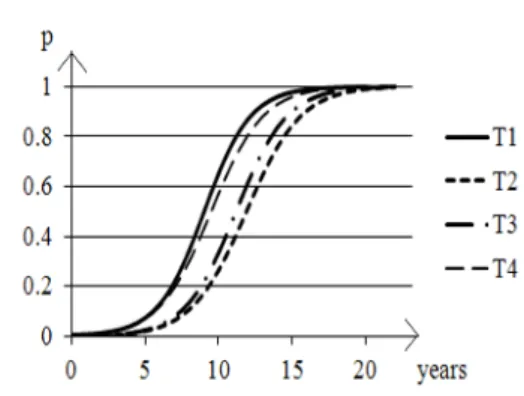
Figure 3 shows the transformer years and their corresponding failure probabilities when plotted (using symbol “。”) against the predicted life logistic models. By comparing the four transformers’ life models in one figure (Figure 4),
Table 2 Partial dataset from a series of 161 kV transformers including combustible gases (ppm), furfural
concentrations (ppb), transformer’s condition, operational years, p-value, and condition of prediction
Unit1 (A) O2 (B) N2 (C) CO2 (D) CO (E) H2 (F) CH4 (G) C2H6 (H) C2H4 (I) C2H2 (J) TCG (K) 5-HMF … (P) TFC (Q)2 (X)3 (Y) p T1 37 2262 13638 1182 6 27 0 25 78 173 0 0 0 0 0.0302 T2 3566 12602 531 39.6 11.7 20.7 12.6 2.52 0 87.1 0 0 0 0 0.0184 T2 3959 20874 1159 41.4 2.2 46.2 93.4 32.2 0 215 0 0 0 0 0.0393 T2 7285 37932 750 19.2 1.2 35.2 52.6 28.9 0 137 0 0 0 0 0.0229 T2 5871 32426 430 32.1 48.2 53.5 36 23.6 0 193 0 0 0 0 0.0390 T2 3318 41782 1189 45.4 4.4 94.4 80.3 32.2 0 257 0 0 0 0 0.0566 T2 2228 18660 1677 34.2 23.5 72.6 94.4 6.4 0 231 0 0 0 0 0.0718 T2 3088 21712 324 26.2 1.7 71.9 53.9 8.2 0 162 0 0 0 0 0.0385 T2 4096 27565 3715 68 15.2 184 247 22.5 0 537 0 0 1 0 0.4909 T2 5211 26990 2217 50.1 5.5 97.1 143 16.2 0 312 0 0 0 0 0.1156 T2 2216 17141 2873 46 30 114 206 28 0 424 0 0 0 0 0.2533 T3 2546 19296 5148 106 71 142 242 71 0 632 0.9 18.9 0 0 0.3184 T4 3492 11988 694 7 21 10 48 5 0 91 2.6 40.8 0 0 0.0014 T5 3576 7939 37 2.6 0 0.1 0 0 0 2.6 0.8 31.8 1 1 0.8654 T6 3519 30939 1610 425 18.5 318 96 228 6.1 1092 0.9 19.8 1 1 0.9758 T7 2626 75962 2788 178 57 245 388 35.1 0.5 907 0 0 1 1 0.9484 T8 4137 21237 546 16.6 23.5 42.4 31 7.4 0 121 0.1 8 0 0 0.0188 T9 2898 30682 2488 49 42.6 101 131 16.2 0 340 0.4 5.3 0 0 0.1499 T10 2695 27405 2247 64.5 30.9 54 59.9 22.4 0 232 4.7 48.6 0 0 0.2274 T11 2228 7373 1220 21 46 65 52 72 0 256 0 0 0 0 0.0360 T12 11539 48270 1547 28 63 78 141 14 0 324 0 0 0 0 0.1532 T13 42.6 2898 30682 2488 16.2 131 0 101 49 340 0.4 5.3 0 0 0.1499
1 Ti represents transformer unit i of the 161 kV series. 2 Transformer’s condition may be normal (0) or abnormal (1).
T1 has the steepest curve among four transformers, indicating a shorter remaining life than the other 3 transformers. On the other hand, T2 shows the greatest operational stability so its life expectancy is expected to be longer than the other transformers. By referring to Figure 4’s transformer life curves and considering the years of operation (ages), T1’s remaining lifespan is approximately 16 years, T2 is 20 years, T3 is 19 years, and T4 is almost 18 years.
4.4 Predicting the Transformer’s State Using the Weibull Distribution
There are 11 abnormal data points from the gas-in-oil readings in the case study. Using Minitab statistical software (Minitab Inc. 2011),
the P-P plot is shown in Figure 5. This figure indicates data compliance with the Weibull distribution (β=3.141, η=11.67 years, γ=2.589 years). The value of η (=11.67) means that when approaching 12 years of service, the transformer will likely enter an abnormal state with greater likelihood of failure. Figure 6 also shows that the Weibull distribution’s cumulative distribution function fits the logistic transformer life model with good results. Since the sampling data accurately fit the Weibull distribution using the derived parameter values, the research concludes that the transformer life span can be properly represented using the logistic regression model.
(a) The logistic model of T1: 1
1 309.246 0.529t
p
(b) The logistic model of T2: 1
1 599.57 0.584t
p
(c) The logistic model of T3: 1
1 639.28 0.561t
p
(d) The logistic model of T4:
1
1 214.799 0.568t
p
Figure 4 The logistic model of four transformers y - Threshold Percent 20 15 10 9 8 7 6 5 99 90 80 70 60 50 40 30 20 10 5 3 2 1 Shape 0.344 P-Value 0.440 3.141 Scale 11.67 Thresh -2.589 N 11 AD Probability Plot of y 3-Parameter Weibull - 95% CI
Figure 5 The data fitness test using a Weibull
distribution
Figure 6 Cumulative distribution function of the
Weibull distribution represented as an S-curve
5. Conclusion
Using real time condition monitoring, a sustainable and intelligent RTU engineering asset management network is developed for the oil-immersed transformer lifespan evaluation. This system integrates real time and historical data, diagnoses fault types using IEEE and IEC standards, and evaluates the transformer lifespan using both logistic regression and the Weibull distribution. The methodology is verified with a case study using data collected from a series of 161 kV transformers. A total of 679 data sets from 121 transformers of 161 kV type are used for the empirical study. The logistic regression models of four transformers serve as examples to evaluate health status and compare remaining life expectances. The Weibull distribution is applied to identify the abnormal distribution of the 161 kV transformer series for general life prediction. This research emphasizes the development of analytical capabilities for a sustainable RTU engineering asset management network. The system integrates features by linking real-time and historical transformer condition data, updated health and fault status information, and reliable estimates of transformer lifespans for engineers and decision makers.
Acknowledgments
We are grateful to the research support granted by Taiwan’s National Science Council and the Australian Government’s Cooperative Research Centers Program. We also thank the reviewers for their constructive comments.
References
Handbook. Gulf Publishing Co., Houston [2] Abu-Elanien, A.E.B. & Salama, M.M.A.
(2010). Asset management techniques for transformers. Electric Power Systems Research, 80 (4): 456-464
[3] Arshad, M., Islam, S.M. & Khaliq, A. (2004). Power transformer asset management. In: Proceedings of International Conference on Power System Technology (PowerCon 2004), 2: 1395-1398, Singapore, November 21-24, 2004
[4] Balageas, D., Fritzen, C.-P. & Güemes, A. (eds.) (2006). Structural Health Monitoring. John Wiley & Sons, NY
[5] Bangemann, T., Rebeuf, X., Reboul, D., Schulze, A. & Szymanski, J. (2006). PROTEUS - creating distributed maintenance systems through an integration platform. Computers in Industry, 57 (6): 539-551
[6] Berkson, J. (1944). Application of the logistic function to bio-assay. Journal of the American Statistical Association, 39 (227): 357-365
[7] Chen, K.Y., Chen, L.S., Chen, M.C. & Lee, C.L. (2011). Using SVM based method for equipment fault detection in a thermal power plant. Computers in Industry, 62 (1): 42-50
[8] Duda, R.O., Hart, P.E. & Stork, D.G. (2001). Pattern Classification. John Wiley & Sons, New York, USA
[9] Farrari, C.R. & Lieven, N.A.J. (2007). Damage prognosis: the future of structural health monitoring. Philosophical Transactions of the Royal Society, 365: 623-632
[10] IBM (2011). Predictive Analytics Software statistics. Available via DIALOG. http://www-01.ibm.com/software/analytics/s pss/. Cited December 25, 2011
[11] Institute of Electrical and Electronics Engineers (2009). C57.104-2008 IEEE Guide for the Interpretation of Gases Generated in Oil-Immersed Transformers, IEEE, New York, USA
[12] International Electrotechnical Commission (2007). IEC 60599 Ed. 2.1 Mineral Oil-Impregnated Electrical Equipment in Aervice - Guide to the Interpretation of Dissolved and Free Gases Analysis, IEC, Geneva, Switzerland
[13] Jahromi, A., Piercy, R., Cress, S., Service, J. & Fan, W. (2009). An approach to power transformer asset management using health index. IEEE Electrical Insulation Magazine, 25: 20-34
[14] Jardine, A.K.S., Lin, D. & Banjevic, D. (2006). A review on machinery diagnostics and prognostics implementing condition-based maintenance. Mechanical Systems and Signal Processing, 20 (7): 1483-1510
[15] Lee, J., Ni, J., Djurdjanovic, D., Qiu, H. & Liao, H. (2006). Intelligent prognostics tools and e-maintenance. Computers in Industry, 57: 476-489
[16] Liao, H., Zhao, W. & Guo, H. (2006). Predicting remaining useful life of an individual unit using proportional hazards model and logistic regression model. In: Proceedings of Reliability and Maintainability Symposium (RAMS 2006): 127-132, Newport Beach, USA, January 23-26, 2006
[17] Liao, R.J., Tang, C., Yang, L.J., Feng, Y. & Sun, C.X. (2009). Influence of the copper ion on aging rate of oil-paper insulation in a power transformer. IET Electric Power Applications, 3 (5): 407-412
[18] Minitab Inc. Minitab 16. Available via DIALOG.
http://www.minitab.com/en-TW/products/m initab/default.aspx. Cited December 25, 2011
[19] Mosinski, F. & Piotrowski, T. (2003). New statistical methods for evaluation of DGA data. Dielectrics and Electrical Insulation, IEEE Transactions on, 10 (2): 260-265 [20] Pradhan, M.K. & Ramu, T.S. (2005). On the
estimation of elapsed life of oil-immersed power transformers. IEEE Transactions on Power Delivery, 20 (3): 1962-1969
[21] Stebbins, R.D., Myers, D.S. & Shkolnik, A.B. (2003). Furanic compounds in dielectric liquid samples: review and update of diagnostic interpretation and estimation of insulation ageing. In: Proceedings of the 7th International Conference on Properties and Applications of Dielectric Materials, Nagoya, June 1-5, 2003
[22] Suwanasri, C. & Suwanasri, T. (2009). Statistical method with efficient IT support for power transformer asset management. In: Proceedings of 6th International Conference
on Electrical Engineering/Electronics, Computer, Telecommunications and Information Technology (ECTI-CON 2009): 88-91, Pattaya, May 6-9, 2009
[23] Trappey, A.J.C., Sun, Y., Trappey, C.V. & Ma, L. (2011). Re-engineering transformer maintenance processes to improve customized service delivery. Journal of
Systems Science and Systems Engineering, 20 (3): 323-345
[24] Trappey, C.V., Wu, H.-Y., Taghaboni-Dutta, F. & Trappey, A.J.C. (2011). Using patent data for technology forecasting: China RFID patent analysis. Advanced Engineering Informatics, 25: 53-64
[25] Wang, M., Vandermaar A. & Srivastava K. (2002). Review of condition assessment of power transformers in service. Electrical Insulation Magazine, IEEE, 18 (6): 12-25 [26] Wouters, P.A.A.F., Schijndel, A.V. &
Wetzer, J.M. (2011). Remaining lifetime modeling of power transformers: individual assets and fleets. IEEE Electrical Insulation Magazine, 27 (1): 45-51
[27] Yu, Y., Ma, L., Sun, Y. & Gu, Y.T. (2010). Remaining useful life prediction using elliptical basis function network and Markov chain. In: World Academy of Science, Engineering and Technology, Venice, November 24-26, 2010
[28] Zheng, Y.C. (1993). The temperature inhibition and life diagnosis of oil-immersed transformers. Fortune Electric Magazine, 2: 34-40
Charles Trappey is a full professor of marketing in the Department of Management Science at the National Chiao Tung University, Taiwan and a visiting research fellow at the Queensland University of Technology, Australia.
Amy J.C. Trappey is the Distinguished University Professor of Industrial Engineering and Engineering Management at the National Tsing Hua University, Taiwan , China. Dr. Trappey is an ASME and ISEAM Fellow.
Lin Ma is a full professor for the Science and Engineering Faculty, Queensland University of Technology. She leads a major research program in the Cooperative Research Centre for Infrastructure and Engineering Asset Management (CIEAM), Australia.
Wan-Ting Tsao received her M.S. degree from the Department of Industrial Engineering and Engineering Management, National Tsing Hua University, Taiwan, China.