地理研究 第 71 期 民國 108 年 11 月
Journal of Geographical Research No.71, November 2019 DOI: 10.6234/JGR.201911_(71).0005
亞熱帶地區高山溪流溶解性有機碳的輸出量
以及在全球氣候變遷下的意涵
Dissolved Organic Carbon Flux from Three Subtropical Mountainous
Rivers in Taiwan and the Implications in the Era of Climate Change
李宗祐
a李俐槿
b黃誌川
cFranz Zehetner
dTsung-Yu Lee Li-Chin Lee Jr-Chuan Huang Franz Zehetner
摘 要
臺灣高山溪流在陸地輸送有機碳至海洋的過程中扮演重要的角色,但大部分的研究把重點放在顆 粒性有機碳的輸出而鮮少探討溶解性有機碳的輸出。本研究以三條鄰近的臺灣高山溪流為例,計算其 近十年溶解性有機碳輸出量,強調臺灣高山溪流在溶解性有機碳輸出的重要性及在全球暖化下可能的 後果。結果顯示,儘管研究溪流的平均溶解性有機碳濃度(<1.0 mg L-1)排名在世界所有觀測河川的 後1%,但其單面積的產出量(~30 kg ha-1 y-1)排名於前 30%;溼季的平均濃度比乾季濃度高 30%與 溫度呈正相關,且溶解性有機碳的濃度在颱風時期達最高,最高可達平均濃度的5 倍。全年約有 60% 的有機碳輸出發生於溼季,但儘管每年受颱風影響的時間很短(約3%的觀測時間),颱風期間的貢獻 達全年輸出量的29.5±13.8%。我們發現,高溫及颱風事件為臺灣高山溪流溶解性有機碳輸出的重要驅 動力,全球暖化的影響下的增溫及增強的颱風,將提高河水中溶解性有機碳的濃度及陸地輸出溶解性 有機碳至海洋的速度。 關鍵詞:碳循環、氣候變遷、水資源管理Abstract
Small mountainous rivers (SMRs) are important conveyors of the land-to-ocean organic carbon export.
a
國立臺灣師範大學地理學系助理教授,通訊作者(email: [email protected])
Assistant professor, Department of Geography, National Taiwan Normal University. Corresponding author.
b
國立臺灣大學地理環境資源學系博士候選人
Ph.D. candidate, Department of Geography, National Taiwan University
c
國立臺灣大學地理環境資源學系教授
Professor, Department of Geography, National Taiwan University
d
自然資源與生命科學大學土壤研究所副教授,奧地利維也納
However, relatively few studies have focused on dissolved organic carbon (DOC) compared to particulate organic carbon. In a long-term project (2002 to 2014), stream DOC was monitored in three neighboring subtropical small mountainous rivers of Taiwan. The objective was to highlight the high DOC yield in SMRs and reveal the implications for global warming. The mean DOC concentration of the studied systems (<1.0 mg L-1) is ranked in the lowest 1% world’s rivers. However, mean DOC yield (~30 kg ha-1 y-1) is ranked in the top 30%. A positive relationship exists between temperature and DOC concentration which is 30% higher in wet season than in dry season. And typhoon-induced discharge boosted the DOC concentration by 5 times. More than 60% of annual DOC export was flushed off in the wet (warm) season. Moreover, up to 29.5±13.8% of the annual DOC export was accounted for by typhoon events, which the invasion time occupied ~3% of the monitoring period. We conclude that higher temperature and typhoon events are important drivers of the land-to-ocean export of dissolved organic matter. Predicted future increases in temperature and frequency/magnitude of typhoon events will likely elevate streamwater DOC concentration and accelerate the transport of terrestrial carbon to the ocean.
Keywords: carbon cycle, climate change, water resource management
Introduction
Small mountainous rivers (SMRs) have been shown to be important conveyors of terrestrial organic carbon to the ocean, contributing approx. 20- 40% of the global land-to-ocean export of organic carbon (Lyons et al., 2002; Schlünz and Schneider, 2000). Most of the studies on SMRs focus on the fluvial export of particulate organic carbon (POC), while the export of dissolved organic carbon (DOC) has received much less attention. DOC yield in SMRs, normalized to the watershed area, is comparable to that observed the large rivers (Lloret et al., 2013). Unlike POC, which is thought to be buried in marine sediments and influences the carbon cycle in geological time scales (Hilton et al., 2012; Kao et al., 2014), the dynamics of DOC, which can be less recalcitrant than POC, could be more important to the contemporary carbon cycle (Lefèvre et al., 1996). The global significance of freshwater on carbon cycle has been highlighted, particularly for the small streams (Biddanda, 2017; Hotchkiss et al., 2015). The DOC dynamics are influenced by the rates of microbial respiration and organic matter decomposition, which may be increased by global warming (Freeman et al., 2001; Tian et al., 2013; Huntington et al., 2016).
Hydrology exerts strong control on the nutrient export in subtropical SMRs (Huang et al., 2012; Kao et
al., 2004; Lee et al., 2013). The rainfall-driven mixture of water from various flow pathways determines
streamwater chemistry (Lee et al., 2015). The DOC from organic soil layers infiltrates into the mineral soil and contributes to the soil carbon pool in deeper soil horizons (Kalbitz and Kaiser, 2008; Michalzik et al., 2001). Upper soil horizons have been shown to be the primary source of DOC in streamwater (Boyer et al., 1997), consequently affecting carbon export through riverine transport (Huang et al., 2013; Liu et al., 2014). Increased DOC concentrations along with stormflow and snowmelt have been observed in different
forest-dominated catchments (Boyer et al., 1997; Brown et al., 1999; Buffam et al., 2001; Inamdar et al., 2004; Zhang et al., 2007). However, the relationship, magnitude and timing vary worldwide because of varying geographic characteristics and climatic conditions (Buffam et al., 2001).
Both DOC production and carbon mineralization increase exponentially with rising temperatures when soil moisture is not limiting the microbial processes (Christ and David, 1996; Rey et al., 2005). In a laboratory experiment increasing temperature increased the leaching of DOC in humic layers (Andersson et
al., 2000). A positive correlation between stream DOC concentration and temperature has been observed in
peatlands (Billett et al., 2006), (sub)boreal regions (Worrall and Burt, 2007) and subtropical forests (Huang et
al., 2013). Nevertheless, the dynamics of stream DOC in subtropical regions has received less attention due
to the relatively low DOC concentrations (Huang et al., 2013; Schmidt et al., 2010) compared to the temperate region (Borken et al., 2011; Fröberg et al., 2006; van den Berg et al., 2012; Yano et al., 2004).
In this study, we investigated the dynamics and export of DOC from three neighboring subtropical SMRs during typhoon and non-typhoon periods. Taiwan is one of the Pacific Ocean's high-standing islands which are characterized with many SMRs that are known to disproportionately deliver terrestrial materials to the ocean. Our objectives were 1) to calculate the contributions of typhoons to the annual DOC fluxes off the watershed of the three subtropical SMRs; 2) to highlight the significance of subtropical SMR on delivering DOC by comparing the DOC yields with rivers worldwide; 3) to understand the effects of temperature and discharge on the riverine DOC concentration and implications of DOC export under global warming.
Materials and Methods
1. Study area
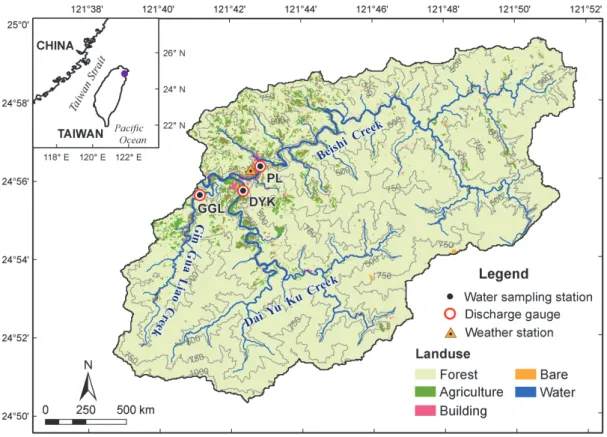
The study area is located in Beishi Creek watershed, Northern Taiwan (121°42' E, 24°56' N), which is dammed up by the Feitsui Reservoir supplying water to 5.7 million people living in Taipei, the capital of Taiwan (Lee et al., 2014). In this study, three neighboring watersheds in the upstream of the Feitsui Reservoir were investigated, i.e. Pin-Lin (PL), Dai-Yu-Ku (DYK) and Gin-Gua-Liao (GGL) watersheds (Fig. 1). PL station is located in the main stream of Beishi Creek before the convergence of DYK Creek and GGL Creek, covering a drainage area of 110 km2. DYK and GGL stations are located at the outlet of DYK Creek (drainage area = 78 km2) and GGL Creek (22 km2), respectively. All the sampling stations have discharge gauges maintained by the Feitsui Reservoir Administration. The average daily discharge for PL, DYK and GGL stations during 2002-2014 is 14.16, 9.55 and 2.15 m3 s-1, respectively (Table 1). The average daily discharge during the wet/dry season is 15.11/13.19 10.33/8.72 and 2.80/1.50 m3 s-1, respectively. Air temperature records were obtained from a weather station near PL station, maintained by Central Weather Bureau. The mean daily air temperature is ~20 °C with an average of ~24 °C in the wet season (May to October) and ~16 °C in the dry season (November to April). The annual rainfall is ~2,000 – 4,000 mm, and ~65 % of the rainfall occurs during the wet season, with a substantial proportion contributed by typhoon
storms. The three watersheds have similar land use patterns with more than 90% forest area. Tea is the major crop, which receives large quantities of synthetic nitrogen fertilizers. Tea farms occupy 5.0%, 2.2% and 5.4% of the watershed area in PL, DYK and GGL watershed, respectively.
2. Streamwater sampling and chemistry
Discrete streamwater samples were collected from Jan 2002 to Dec 2014 (missing data during 2006-2011 owing to no grant support). During the non-typhoon periods, samples were taken twice per week. During the sampled typhoon periods, samples were taken every three hours. There were on average ~4 typhoons per year during the observation period. Our sampling crew started off when Central Weather Bureau issued the typhoon warning. Ideally, the sampling work did not stop until the hydrograph receded to the pre-event level. However, sampling work sometimes ended earlier owing to some uncertain factors, e.g. road destruction. Typhoon samples were taken from four typhoons, i.e. typhoons Saola (Jul 31 – Aug 3, 2012), Soulik (Jul 12 – Jul 13, 2013), Trami (Aug 21 – Aug 23, 2013), and Matmo (Jul 22 – Jul 24, 2014). Depth-integrated water samples were obtained using a vertically mounted 1 L bottle attached to a weighted metal frame that was gradually lowered from a bridge. After collection, water samples were immediately filtered through 0.7 μm pore-size GF/F filter and the filtrate was transported in a cooler to the laboratory. The filtrate for DOC analysis was preserved by addition of 0.5 ml 85% ortho-phosphoric acid and stored at room temperature. DOC concentration was determined by wet chemical oxidation using an auto TOC analyzer with detection limit of 4 μg L-1 (Multi N/C 3100, Analytik Jena AG).
3. Flux calculation
The DOC flux is the total amount of DOC export from a watershed within a given period. The DOC flux was calculated by multiplying the DOC concentrations by the corresponding discharge. A flux estimator is needed when there is a lack of continuous measurement (e.g., daily) of a constituent’s concentration. The rating curve method is one of the most appropriate flux estimation methods and has been widely applied to rivers in Taiwan because the strongly fluctuating discharge usually dominates the fluvial material export (Kao
et al., 2004; Lee et al., 2013; 2014). This method presumes that a power function (i.e., F = aQb) exists
between the observed DOC flux (F) and discharge (Q). The coefficients of the power function, a and b, can be derived from the observed DOC fluxes and the water discharge rates by the log-linear least-square method (Kao et al., 2005). It is well known that the rating curve method inherently underestimates the summation of the sampled fluxes within a concerned period, especially during high flow periods. Therefore, bias correction method has been evolved for such underestimation (Ferguson, 1986). However, the underestimation is particularly problematic while estimating the fluxes of sediment or particulate-associated solutes (Kao et al., 2005). For the dissolved solutes, it is relatively minor. Besides, the residuals of the log-log linear regression in this study did not follow normal distribution which is the requirement for the bias correction proposed by Ferguson (1986); therefore, we did not apply the bias correction in this study. The rating curve method should be the best one when water samples from full range of river discharge are taken, as suggested by Cooper and
Watts (2002) and supported by our previous studies regarding the solutes’ fluxes from Taiwan rivers (Kao
et al., 2004; Lee et al., 2009; 2013; 2014; Huang et al., 2012). The sampling frequency in this study is
favorable for the rating curve method. In this study, two rating curves were developed, one for non-typhoon period (i.e. the product of sampled DOC concentration and the daily discharge rate on a sampling day against the daily discharge rate), and one for typhoon period (i.e. the product of sampled DOC concentration and the hourly discharge rate at a sampling hour against the hourly discharge rate) at each sampling station, respectively. The water discharge data were provided by the Taipei Feitsui Reservoir Administration. Hourly discharge is recorded every exact hour.
The Central Weather Bureau records the invading duration of every typhoon. The entire typhoon-induced hydrograph, from the rise till the recession to the pre-event level, was determined on a daily basis. For the typhoon periods, hourly discharge is used to fill in hourly DOC flux. For the non-typhoon periods, daily discharge is used to derive the daily DOC flux. Nevertheless, during the non-typhoon periods, the summation of hourly DOC fluxes (substituting hourly discharge to the rating curve) would derive a very similar value with the daily flux (substituting daily discharge to the rating curve), given the condition that hourly discharge fluctuates little within a day. But it is not the case during typhoon periods (Kao et al., 2005). Therefore, hourly discharge is recommended to derive hourly DOC flux before summing them up to get the daily flux. Overall speaking, the consecutive daily discharge and hourly discharge (for all the typhoon events in a year) were substituted into the non-typhoon and typhoon rating curves, respectively, to calculate DOC fluxes. The sum of the DOC fluxes within a year is the annual DOC flux, which can be converted to DOC yield by normalizing to watershed area.
Results
1. Time series of the observations
Air temperature in Taiwan shows a distinct seasonality. During the observation period, daily air temperature in the dry (November – April) and wet seasons (May – October) varied from 5.0 to 25.8 ℃ (with a mean of 16.3±4.0 ℃) and from 14.0 to 29.5 ℃ (with a mean of 24.2±2.8 ℃), respectively (Fig. 2). Water discharge showed spiky patterns resulting from rapid rainfall-runoff response and fluctuated by 3-orders of magnitude mostly during the invasion of typhoons in summer and autumn. The measured maximum water discharge in the dry/wet seasons was 168/280, 70/363 and 24/84 m3 s-1 at PL, DYK and GGL station, respectively, with means of 11.8/13.6, 5.9/9.5 and 1.4/2.6 m3 s-1. The measured minimum water discharge was below 0.1 m3 s-1 at all stations.
During the observation period, the running mean DOC concentration (of 5 adjacent samples, grey curve in Fig. 2) more or less followed the annual air temperature cycle, peaking in the wet season and low in the dry season. The observed DOC concentrations ranged from 0.23 to 2.91 mg L-1, 0.22 to 4.11 mg L-1, and 0.20 to 2.89 mg L-1, respectively, at PL, DYK, and GGL station. Most of the DOC concentrations in the wet
season were significantly higher than those in the dry season (Table 1) and the typhoon samples generally had extremely high DOC concentrations (Table 2). The variation in DOC concentration could be linked to the water discharge variation. The DOC concentration dropped coincidentally with increasing water discharge (Fig. 2). Simultaneous increase of both, DOC concentration and water discharge, was only observed during the typhoon periods.
2. DOC fluxes during typhoon and non-typhoon periods
The relation of DOC flux to water discharge generally followed a power function with R2 ≥0.92 for typhoon samples and R2 ≥0.83 for non-typhoon samples (Fig. 3 and Table 3). At each sampling station, all the typhoon and non-typhoon samples, respectively, were pooled to derive two rating curves that allow predicting DOC flux from water discharge. We presumed that the two rating curves for each station remained unchanged during the observation period. Larger a and b in the power function were found for the typhoon period than for the non-typhoon period, indicating disproportionately higher DOC fluxes during typhoon events. If the bias correction proposed by Ferguson (1986) is applied, the corrected DOC fluxes will increase 7-8% and 9-12% compared to our current estimations for the non-typhoon and typhoon periods, respectively, for the three studied watersheds. We do not think it is essential to implement the correction owing to the violation of the assumption regarding the normal distribution of the residuals and meager influence on our stories in this study.
Table 4 shows the DOC yields during the typhoon and non-typhoon periods. As for the mean annual DOC yield, the highest value of 26.1 kg ha-1 y-1 was found at PL station, followed by 23.5 kg ha-1 y-1 at DYK and 21.8 kg ha-1 y-1 at GGL station. Dry/wet seasons yield 10.1/16, 7.74/15.8, 6.64/15.2 kg ha-1 y-1 at PL, DYK and GGL, respectively; hence, approx. 61 – 72% of the total annual DOC export was flushed out in the wet season. However, the contribution of typhoons to the wet season was approx. 50%; therefore, approx. 28 – 31% of the total annual DOC export was flushed out during typhoon events, which lasted for only 3 – 23 days (i.e. 0.8 – 6.3% of the observation time). Typhoons contributed on average 16 – 23% of the total annual water discharge. Depending on the number of typhoon invasions in every observation year, typhoon events transported 6.8 – 50.3% of the total annual DOC export.
3. The variation of DOC concentration
Figure 4 illustrates the variation of DOC concentration against water discharge. The DOC concentration-water discharge (C-Q) relation showed a clear dilution effect on DOC concentration with increasing water discharge for the non-typhoon samples in both the wet and dry season. Conversely, the C-Q relation for the typhoon samples did not show any obvious trends. Yet, during typhoon events, elevated DOC concentrations were observed; the mean DOC concentration during the typhoon period (>1.0 mg L-1 for all typhoon events, Table 2) was much higher compared to the non-typhoon period (Table 1). At a given discharge, higher DOC concentrations were generally observed in the wet season (warm season) than in the dry season (cool season).
To demonstrate the influence of temperature and water discharge on the DOC concentration variations, the DOC concentrations were separated into five categories based on typhoon or non-typhoon, dry or wet season, and larger or less than the median (Q50) of the sampled discharge (grey dashed lines in Fig. 4). Figure 5 illustrates the box-and-whisker plots of the sampled DOC concentration, water temperature, and discharge for each category. Typhoon DOC concentrations were significantly higher than non-typhoon ones (Fig. 5a, except for DYK data) when typhoon discharges were significantly higher (Fig. 5c) and water temperatures were similar to those in the wet season (Fig. 5b). DOC concentrations in the wet season were significantly higher than in the dry season in both <Q50 and ≥Q50 categories (Fig 5a) when water temperatures in wet seasons were significantly higher than in the dry season (Fig. 5b). However, water discharges in the wet season were not necessarily higher than those in the dry season (Fig. 5c). Some cases were even lower in the wet season (in the <Q50 category for PL and DYK).
4. DOC concentration during typhoon periods
Fig. 6 illustrates the time series of DOC concentrations along the hydrograph of the sampled typhoon events and Table 2 shows characteristics of water discharge and DOC concentration during the typhoons. For typhoon Saola, two peaks were observed in the hydrograph at PL, DYK and GGL station (Fig. 6a-1, 6b-1, 6c-1). This event also produced the highest peak discharge among the 4 sampled typhoons, reaching 641, 592 and 135 m3 s-1, respectively, at PL, DYK and GGL station. Although the DOC concentrations along the hydrograph showed some variability, two descending trends could be observed, which start before each discharge peak. The DOC concentration responded rapidly to variations in water discharge with pronounced rises at the beginning of the typhoon (compared to the last pre-typhoon sample) and rose again before the 2nd peak of the hydrograph (Fig. 6a-1, 6b-1, 6c-1).
For typhoon Soulik (Fig. 6a-2, 6b-2, 6c-2), the hydrograph showed the highest fluctuations among the four sampled typhoons, spanning three orders of magnitude. The peak DOC concentration during this typhoon was also the highest concentration among all the samples, reaching 2.79, 4.11, and 2.89 mg L-1 at PL, DYK, and GGL station, respectively. The DOC concentration again peaked 3 - 9 hours before the peak discharge. Additionally, at a given water discharge, higher DOC concentrations were observed for the rising limb of the hydrograph than for the recessing limb.
For typhoon Trami (Fig. 6a-3, 6b-3, 6c-3), the hydrograph and DOC concentrations showed similar patterns as for typhoon Saola, i.e. two peaks for water discharge and DOC concentration (and two hysteresis loops for the C-Q relationship). Moreover, the first peak discharge of both typhoons triggered the highest DOC concentration in the respective typhoon event (except for Saola at PL, Fig. 6a-1). However, unlike typhoon Trami, the first peak discharge in typhoon Saola was smaller than the second one, which, however, did not trigger higher DOC concentrations. For typhoon Matmo (Fig. 6a-4, 6b-4, 6c-4), the narrow double peak of discharge was not reflected by variations in DOC concentration, resulting in similar patterns as found for typhoon Soulik.
Discussion
1. DOC export in small mountainous rivers
Although DOC concentration in our study watersheds and other small mountainous watersheds (Lloret
et al., 2013) is much lower than the global river mean, i.e. 5.29 mg L-1, estimated by Dai et al. (2012), which
is comparable to other world rivers. Among the 118 world rivers investigated by Dai et al. (2012), DOC concentration in this study, i.e. <1.0 mg L-1, is ranked in the lowest 1% (Fig. 7a), but the DOC yield, ~30 kg ha-1 y-1, is ranked in the top 30% (Fig. 7b). Such high DOC yield can be attributed to the abundant rainfall in combination with substantial carbon stocks in the watershed, and demonstrates the significance of SMRs in delivering terrestrial organic carbon to the ocean involving not only the particulate phase but also the dissolved phase. Typhoons are important triggers of DOC export as shown in Fig. 8. Contribution of typhoon-induced DOC export to the annual amount is positively correlated to the contribution of typhoon-induced water discharge. With the unit increment of typhoon’s contribution of annual discharge, the typhoon’s contribution to annual DOC export will be 1.19-1.38 times more. Liang et al. (2017) has demonstrated the increased long-term trends of typhoon-induced rainfall over Taiwan and its relationship with the expansion of the tropics due to climate change. DOC export in SMRs is very likely to increase in the future.
2. Effects of temperature on streamwater DOC
Soil water is an important source of DOC in streams (Clark et al., 2010), and it has been observed that DOC concentration in soil water increases with increasing temperature around the world regardless of soil type, geological region and land use (Worrall and Burt, 2007; Zaman and Chang, 2004). Increase in temperature enhances soil microbial and enzymatic activity and hence breakdown of litter and soil organic carbon (SOC), accelerating carbon turnover in soil (Subke et al., 2003). Schimel and Weintraub (2003) suggested that microbial activity and SOC be included in models that describe the dynamics of DOC in soil. In Taiwan’s forest soils, SOC is >100 t ha-1 within 1 m depth (Chen and Hseu, 1997). Given the abundant SOC stocks, temperature fluctuations may trigger strong responses of DOC release in these soils. Our results show that at each of the three stations, DOC concentration was more than 30% higher in the warmer wet season than in the cooler dry season (>6℃difference in mean temperature but no significant difference in discharge, Fig. 5).
3. Influence of hydrology on DOC concentration
The changes of geochemical signatures in streamwater have been linked to the mixing of different water sources, i.e. groundwater, subsurface or soil, and surface runoff (Lee et al., 2015; Salmon et al., 2001). Hydrological controls on streamwater solute concentrations usually exhibit one of the following three general C-Q relations, i.e. dilution, enhanced hydrological access, or hydrologically constant conditions (Salmon et
typhoons. This is probably due to enhanced hydrological access, which is commonly shown for solutes found in areas of a watershed that are only hydrologically active during periods of high flows (Salmon et al., 2001). Stormflow is likely to accentuate the contribution of DOC sources near the organic-rich soil surface resulting in increased concentrations of DOC (Qualls and Haines, 1991). Although DOC concentration in soil water was not measured in this study, it is well known that DOC concentration decreases with increasing soil depth (Inamdar et al., 2004), and also confirmed for natural and secondary hardwood forests in central Taiwan, where DOC concentrations of 20 mg L-1 were found at 15 cm and 10 mg L-1 at 60 cm soil depth (Liu and Sheu, 2003). Besides, the litter layer in the forest floor is a substantial DOC source where DOC concentration can be up to 35 mg L-1 (Chang et al., 2007).
It is presumed that flow paths and available sources control the concentrations of dissolved matter during typhoon events (Buffam et al., 2001; Zhang et al., 2007), and our results suggest the following processes. Before typhoon events, groundwater likely dominates flow discharge; the groundwater in our study area had DOC concentrations <0.7 mg L-1 (Lee, unpublished raw data). In the rising limb of the typhoon hydrograph, streamwater DOC concentration rises with discharge until a maximum is reached that probably coincides with the saturation of the topsoil and litter layers where DOC concentrations are highest. In the recession period, DOC concentration keeps decreasing as groundwater gradually dominates the flow discharge again. Lee et al. (2013) also addressed similar hydrological processes in three watersheds in central Taiwan but nitrate and phosphate were used as tracers.
In our study, DOC concentrations responded rapidly to variations in water discharge and increased before every peak in the hydrograph (Fig. 6a-1, 6b-1, 6c-1, 6a-3, 6b-3, 6c-3). Such rapid response may reflect a fast increase in contribution from near-surface components with DOC-enriched water. Interestingly, the second peak of the hydrograph induced lower DOC concentrations even when the second peak discharge was higher (Fig. 6b-1, 6c-1). Perhaps most of the DOC in the soil had been flushed off during the rising limb of the 1st peak discharge. Buffam et al. (2001) addressed a flushing mechanism, in which soil water DOC concentration was depleted over time while the soil was saturated. Buffam et al. (2001) used the three-component mixing model to explain the C-Q relations for stream storm events, which are very similar to ours, based on the relative concentrations of DOC in three source reservoirs, i.e. surface runoff (in the litter layer), soil water, and groundwater. However, we propose that the surface runoff be divided into initial flush-off from the litter layer and the following saturation-excess runoff that leads to the dilution of DOC concentration in the period between the peaks of DOC concentration and water discharge.
4. Implication for global warming
Given the prediction of increasing air temperature by global climate models (IPCC, 2014), rates of heterotrophic microbial activity will accelerate, increasing the efflux of CO2 to the atmosphere and the export of DOC to streams by hydrologic leaching (Bardgett et al., 2008). We speculate that the watershed carbon cycle might speed up even more in forested catchments because the amount of litterfall is also positively correlated to air temperature (Lu and Liu, 2012), and increasing litterfall resulted in enhanced annual seepage
flux of DOC in a Taiwanese Chamaecyparis forest (Chang et al., 2007). Also, typhoon events contribute significantly to the annual litterfall in Taiwan (Wang, 2013); hence, the carbon cycle might be further accelerated by increasing magnitude of typhoons, which has been reported by several studies (Chien and Kuo, 2011; Liu et al., 2009; Tu and Chou, 2013; Mei and Xie, 2016).
A recent study has analyzed the trends of water and sediment discharge off of Taiwan island over the past four decades (Lee et al., 2015) and revealed magnified responses to increased rainfall intensity. On average for the 16 major rivers in Taiwan, the extremes of water discharge rose by 6.5 – 37% in the recent two decades compared to the previous two decades, and the extremes of sediment discharge rose by 62 – 94%. As water and sediment are carriers of DOC and POC, respectively, Taiwan rivers might have delivered much more DOC (and POC) compared to the previous two decades from the terrestrial to the ocean. Moreover, a recent study has demonstrated that typhoons striking Taiwan will intensify further in the future (Mei and Xie, 2016), which suggests that DOC (and POC) export will further increase in the decades to come. A continuous supply of DOC is likely in the forest ecosystems of Taiwan because of abundant SOC stocks (>100 t ha-1; Chen and Hseu, 1997). The DOC yield ranged from 9 to 49 kg ha-1 yr-1 (Table 4), amounting to <0.1 % of the SOC stored in the watershed. Even if the rainfall-driven export of POC, i.e. 210 kg ha-1 yr-1, from forested hillslopes (bedrock excluded) is taken into account (Hilton et al., 2012), such abundant storage of SOC will not easily be depleted by the DOC and POC export off the watershed.
Conclusions
Oceania is a global hotspot of land-to-ocean export of both POC and DOC (Schlünz and Schneider, 2000; Seitzinger et al., 2005), and Taiwan is often taken as a role model (Milliman and Syvitski, 1992; Dadson et al., 2003; Hilton et al., 2012). However, much less attention has been paid to DOC, which is masked by the overwhelming POC yield along with the highest sediment yield in the world (Milliman and Farnsworth, 2013). We found that the DOC concentrations in the studied subtropical SMRs indeed lie on the lower end, i.e. <1.0 mg L-1, of the spectrum of global stream DOC concentrations; however, the DOC yields, ~30 kg ha-1 y-1, ranked in the top 30% among 118 world rivers, which is due to high rainfall and high SOC stocks. Taking into account both the POC yield (~210 kg ha-1 y-1; Hilton et al., 2012) and the DOC yield calculated in our study, we estimate the residence time of SOC at approx. 400 year (100 t ha-1 SOC stocks divided by 0.24 t ha-1 y-1 POC+DOC yield. We think that due to their rapid responses subtropical SMRs might be the best experimental sites for studying the impacts of environmental changes on watershed carbon cycles in the future. Our study demonstrates that the DOC yield needs to be considered in overall budgets of carbon transport. Also, DOC might be more biodegradable than POC, likely causing more direct impacts on aquatic ecosystems (Raymond and Bauer, 2001).
We also found that DOC concentrations increase with rising temperatures and are elevated during typhoon events. Extreme climatic conditions, like heat waves and severe typhoon events, are very likely to be
more frequent in the future as a result of global warming (Mei and Xie, 2016). We therefore infer that more DOC will be exported by subtropical SMRs. Our observational data supplement the global river database and serve as a scientific background for better understanding and modeling nutrient export from small mountainous watersheds.
Acknowledgments
This study was supported by Taiwan’s Ministry of Science and Technology (http://www.most.gov.tw/) (102-2923-M-002-001-MY3, 104-2116-M-003-005, 105-2116-M-003-006) and by the Austrian Science Fund (FWF; http://www.fwf.ac.at) through the project ECATA (grant number I 1396-B16). We are thankful to Dr. Fuh-Kwo Shiah and Dr. Shuh-Ji Kao from Research Center for Environmental Changes, Academia Sinica, Taiwan for providing their lab for the sample analysis. We also thank Feitsui Reservoir Administration for providing hydrological records.
References
Andersson, S., Nilsson, S.I., and Saetre, P. (2000). Leaching of dissolved organic carbon (DOC) and dissolved organic nitrogen (DON) in mor humus as affected by temperature and pH. Soil Biology &
Biochemistry, 32(1): 1–10.
Bardgett, R.D., Freeman, C., and Ostle, N.J. (2008). Microbial contributions to climate change through carbon cycle feedbacks. The Isme Journal, 2(8): 805–814.
Biddanda, B. A. (2017). Global significance of the changing freshwater carbon cycle. Eos, 98, https://doi.org/10.1029/2017EO069751.
Billett, M.F., Deacon, C.M., Palmer, S.M., Dawson, J.J.C., and Hope, D. (2006). Connecting organic carbon in stream water and soils in a peatland catchment. Journal of Geophysical Research-Biogeosciences,
111,G02010, doi:10.1029/2005JG000065.
Borken, W., Ahrens, B., Schulz, C., and Zimmermann, L. (2011). Site-to-site variability and temporal trends of DOC concentrations and fluxes in temperate forest soils. Global Change Biology, 17(7): 2428–2443. Boyer, E.W., Hornberger, G.M., Bencala, K.E., and McKnight, D.M. (1997). Response characteristics of
DOC flushing in an alpine catchment. Hydrological Processes, 11(12): 1635–1647.
Brown, V.A., McDonnell, J.J., Burns, D.A., and Kendall, C. (1999). The role of event water, a rapid shallow flow component, and catchment size in summer stormflow. Journal of Hydrology, 217(3–4): 171–190. Buffam, I., Galloway, J.N., Blum, L.K., and McGlathery, K.J. (2001). A stormflow/baseflow comparison of
dissolved organic matter concentrations and bioavailability in an Appalachian stream. Biogeochemistry,
53(3): 269–306.
elements and dissolved organic matter following manipulation of leaf litter input in a Taiwan Chamaecyparis forest. Forest Ecology and Management, 242: 133–141.
Chen, Z.S., and Hseu, Z.Y. (1997). Total organic carbon pool in soils of Taiwan. Proceeding of the National
Science Council, ROC, 21(3): 120–127.
Chien, F.C., and Kuo, H.C. (2011). On the extreme rainfall of Typhoon Morakot. Journal of Geophysical
Research: Atmospheres, 116: D05104, doi:10.1029/2010JD015092.
Christ, M.J., and David, M.B. (1996). Temperature and moisture effects on the production of dissolved organic carbon in a Spodosol. Soil Biology & Biochemistry, 28(9): 1191–1199.
Cooper, D.M., and Watts, C.D. (2002). A comparison of river load estimation techniques: application to dissolved organic carbon. Environmetrics, 13(7): 733-750.
Clark, J.M., Bottrell, S.H., Evans, C.D., Monteith, D.T., Bartlett, R., Rose, R., Newton, R.J., and Chapman, P.J. (2010). The importance of the relationship between scale and process in understanding long-term DOC dynamics. Science of the Total Environment, 408: 2768–2775.
Dadson, S.J., Hovius, N., Chen, H.G., Dade, W.B., Hsieh, M.L., Willett, S.D., Hu, J.C., Horng, M.J., Chen, M.C., Stark, C.P., Lague, D., and Lin, J.C. (2003). Links between erosion, runoff variability and seismicity in the Taiwan orogeny. Nature, 426: 648–651.
Dai, M., Yin, Z., Meng, F., Liu, Q., and Cai, W.J. (2012). Spatial distribution of riverine DOC inputs to the ocean: an updated global synthesis. Current Opinion in Environmental Sustainability, 4: 170–178. Ferguson, R.I. (1986). River loads underestimated by rating curves. Water Resources Research, 22(1): 74-76. Freeman, C., Evans, C.D., Monteith, D.T., Reynolds, B., and Fenner, N. (2001). Export of organic carbon
from peat soils. Nature, 412: 785–785.
Fröberg, M., Berggren, D., Bergkvist, B., Bryant, C., and Mulder, J. (2006). Concentration and fluxes of dissolved organic carbon (DOC) in three Norway spruce stands along a climatic gradient in Sweden.
Biogeochemistry, 77(1): 1–23.
Hilton, R.G., Galy, A., Hovius, N., Kao, S.J., Horng, M.J., and Chen, H. (2012). Climatic and geomorphic controls on the erosion of terrestrial biomass from subtropical mountain forest. Global Biogeochemical
Cycles, 26: GB3014, doi:10.1029/2012GB004314.
Hotchkiss, E.R., Hall, R.O., Sponseller, R.A., Butman, D., Klaminder, J., Laudon, H., Rosvall, M., and Karlsson, J. (2015). Sources of and processes controlling CO2 emissions change with the size of streams and rivers. Nature Geoscience, 8: 696–699.
Huang, J.C., Lee, T.Y., Kao, S.J., Hsu, S.C., Lin, H.J., and Peng, T.R. (2012). Land use effect and hydrological control on nitrate yield in subtropical mountainous watersheds. Hydrology and Earth
System Sciences, 16: 699–714, doi:10.5194/hess-16-699-2012.
Huang, W., McDowell, W.H., Zou, X.M., Ruan, H.H., Wang, J.S., and Li, L.G. (2013). Dissolved Organic Carbon in Headwater Streams and Riparian Soil Organic Carbon along an Altitudinal Gradient in the Wuyi Mountains, China. Plos One, 8(11): 1–8.
Huntington, T.G., Balch, W.M., Aiken, G.R., Sheffield, J., Luo, L., Roesler, C.S., and Camill, P. (2016). Climate change and dissolved organic carbon export to the Gulf of Maine. Journal of Geophysical
Research: Biogeosciences, 121: 2700–2716, doi:10.1002/2015JG003314.
Inamdar, S.P., Christopher, S.F., and Mitchell, M.J. (2004). Export mechanisms for dissolved organic carbon and nitrate during summer storm events in a glaciated forested catchment in New York, USA.
Hydrological Processes, 18(14): 2651–2661.
IPCC (2014). Climate Change 2014: Synthesis Report. Contribution of Working Groups I, II and III to the
Fifth Assessment Report of the Intergovernmental Panel on Climate Change [Core Writing Team, R.K. Pachauri and L.A. Meyer (eds.)], IPCC, Geneva, Switzerland: 151.
Kalbitz, K., and Kaiser, K. (2008). Contribution of dissolved organic matter to carbon storage in forest mineral soils. Journal of Plant Nutrition and Soil Science - Zeitschrift Fur Pflanzenernahrung Und
Bodenkunde, 171(1): 52–60.
Kao, S.J., Hilton, R.G., Selvaraj, K., Dai, M., Zehetner, F., Huang, J.C., Hsu, S.C., Sparkes, R., Liu, J.T., and Lee, T.Y. (2014). Preservation of terrestrial organic carbon in marine sediments offshore Taiwan: mountain building and atmospheric carbon dioxide sequestration. Earth Surface Dynamics, 2: 127–139. Kao, S.J., Lee, T.Y., and Milliman J.D. (2005). Calculating highly fluctuated suspended sediment fluxes from
mountainous rivers in Taiwan. Terrestrial, atmospheric, and oceanic sciences, 16(3): 653-675.
Kao, S.J., Shiah, F.K., and Owen, J.S. (2004). Export of dissolved inorganic nitrogen in a partially cultivated subtropical mountainous watershed in Taiwan. Water, Air, and Soil Pollution, 156: 211–228.
Lee, T.Y., Huang, J.C., Lee, J.Y., Jien, S.H., Zehetner, F., and Kao, S.J. (2015). Magnified Sediment Export of Small Mountainous Rivers in Taiwan: Chain Reactions from Increased Rainfall Intensity under Global Warming. Plos One, 10(9): e0138283, doi:10.1371/journal.pone.0138283.
Lee, T.Y., Shih, Y.T., Huang, J.C., Kao, S.J., Shiah, F.K., and Liu, K.K. (2014). Speciation and dynamics of dissolved inorganic nitrogen export in the Danshui River, Taiwan. Biogeosciences, 11(19): 5307–5321. Lee, T.Y., Huang, J.C., Kao, S.J., and Tung, C.P. (2013). Temporal variation of nitrate and phosphate
transport in headwater catchments: the hydrological controls and land use alteration. Biogeosciences, 10: 2617-2632, doi:10.5194/bg-10-2617-2013.
Lee, T. Y., Huang, J. C., Carey, A. E., Hsu, S. C., Selvaraj, K., and Kao, S. J. (2009). Uncertainty in acquiring elemental fluxes from subtropical mountainous rivers. Hydrology and Earth System Sciences Discussion,
6: 7349–7383, doi:10.5194/hessd-6-7349-2009.
Lefèvre, D., Denis, M., Lambert, C.E., and Miquel, J.C. (1996). Is DOC the main source of organic matter remineralization in the ocean water column? Journal of Marine Systems, 7: 281–291.
Liang, A., Oey, L., Huang, S., and Chou, S. (2017). Long-term trends of typhoon-induced rainfall over Taiwan: In situ evidence of poleward shift of typhoons in western North Pacific in recent decades.
Journal of Geophysical Research: Atmospheres, 122: 2750-2765, doi:10.1002/2017JD026446.
solution, and stream water at the Guandaushi subtropical forest in Taiwan. Forest Ecology and
Management, 172(2–3): 315–325.
Liu, S.C., Fu, C., Shiu, C.J., Chen, J.P., and Wu, F. (2009). Temperature dependence of global precipitation extremes. Geophysical Research Letters, 36: L17702, doi:10.1029/2009GL040218.
Liu, W., Xu, X., McGoff, N.M., Eaton, J.M., Leahy, P., Foley, N., and Kiely, G. (2014). Spatial and Seasonal Variation of Dissolved Organic Carbon (DOC) Concentrations in Irish Streams: Importance of Soil and Topography Characteristics. Environmental Management, 53(5): 959–967.
Lloret, E., Dessert, C., Pastor, L., Lajeunesse, E., Crispi, O., Gaillardet, J., and Benedetti, M.F. (2013). Dynamic of particulate and dissolved organic carbon in small volcanic mountainous tropical watersheds.
Chemical Geology, 351: 229–244.
Lu, S.W., and Liu, C.P. (2012). Patterns of litterfall and nutrient return at different altitudes in evergreen hardwood forests of Central Taiwan. Annals of Forest Science, 6: 877–886.
Lyons, W.B., Nezat, C.A., Carey, A.E., and Hicks, D.M. (2002). Organic carbon fluxes to the ocean from high-standing islands. Geology, 30: 443–446.
Mei, W., Xie, S.P. (2016). Intensification of landfalling typhoons over the northwest Pacific since the late 1970s. Nature Geoscience, 9(10): 753-757.
Michalzik, B., Kalbitz, K., Park, J.H., Solinger, S., and Matzner, E. (2001). Fluxes and concentrations of dissolved organic carbon and nitrogen - a synthesis for temperate forests. Biogeochemistry, 52(2): 173–205.
Milliman, J.D., and Syvitski, J.P.M. (1992). Geomorphic/tectonic control of sediment discharge to the ocean: the importance of small mountainous rivers. Journal of Geology, 100: 525–544.
Milliman, J.D., and Farnsworth, K.L. (2013). River discharge to the coastal ocean: A global synthesis. Cambridge University Press.
Qualls, R.G., and Haines, B.L. (1991). Geochemistry of dissolved organic nutrients in water percolating through a forest ecosystem. Soil Science Society of America Journal, 55(4): 1112–1123.
Raymond P.A., and Bauer, J.E. (2001). Use of 14C and 13C natural abundances of evaluating riverine, estuarine, and coastal DOC and POC sources and cycling: a review and synthesis. Organic
Geochemistry, 32: 469–485.
Rey, A., Petsikos, C., Jarvis, P.G., and Grace, J. (2005). Effect of temperature and moisture on rates of carbon mineralization in a Mediterranean oak forest soil under controlled and field conditions. European
Journal of Soil Science, 56(5): 589–599.
Salmon, C.D., Walter, M.T., Hedin, L.O., and Brown, M.G. (2001). Hydrological controls on chemical export from an undisturbed old-growth Chilean forest. Journal of Hydrology, 253(1–4): 69–80.
Schimel, J.P., and Weintraub, M.N. (2003). The implications of exoenzyme activity on microbial carbon and nitrogen limitation in soil: a theoretical model. Soil Biology & Biochemistry, 35(4): 549–563.
dissolved organic carbon and nitrogen in a subtropical montane Chamaecyparis forest in Taiwan.
Biogeochemistry, 101(1–3): 243–256.
Schlünz, B., and Schneider, R.R. (2000). Transport of terrestrial organic carbon to the oceans by rivers: Re-estimating flux and burial rates. International Journal of Earth Sciences, 88: 599–606.
Seitzinger, S.P., Harrison, J.A., Dumont, E., Beusen, A.H.W., and Bouwman, A.F. (2005). Sources and delivery of carbon, nitrogen, and phosphorus to the coastal zone: An overview of Global Nutrient Export from Watersheds (NEWS) models and their application. Global Biogeochemical Cycles, 19(4): GB4S01, doi:10.1029/2005GB002606.
Subke, J.A., Reichstein, M., and Tenhunen, J.D. (2003). Explaining temporal variation in soil CO2 efflux in a mature spruce forest in Southern Germany. Soil Biology & Biochemistry, 35(11): 1467–1483.
Tian, Y.Q., Yu, Q., Feig, A.D., Ye, C., and Blunden, A. (2013). Effects of climate and land-surface processes on terrestrial dissolved organic carbon export to major U.S. coastal rivers. Ecological Engineering, 54: 192-201.
Tu, J.Y., and Chou, C. (2013). Changes in precipitation frequency and intensity in the vicinity of Taiwan: typhoon versus non-typhoon events. Environmental Research Letters, 8(1): 71–80.
van den Berg, L.J.L., Shotbolt, L., and Ashmore, M.R. (2012). Dissolved organic carbon (DOC) concentrations in UK soils and the influence of soil, vegetation type and seasonality. Science of the Total
Environment, 427: 269–276.
Wang, H.C., Wang, S.F., Lin, K.C., Shaner, P.J., and Lin, T.C. (2013). Litterfall and Element Fluxes in a Natural Hardwood Forest and a Chinese-fir Plantation Experiencing Frequent Typhoon Disturbance in Central Taiwan. Biotropica, 45(5): 541–548.
Worrall, F., and Burt, T.P. (2007). Trends in DOC concentration in Great Britain. Journal of Hydrology,
346(3–4): 81–92.
Yano, Y., Lajtha, K., Sollins, P., and Caldwell, B.A. (2004). Chemical and seasonal controls on the dynamics of dissolved organic matter in a coniferous old-growth stand in the Pacific Northwest, USA.
Biogeochemistry, 71(2): 197–223.
Zaman, M., and Chang, S.X. (2004). Substrate type, temperature, and moisture content affect gross and net N mineralization and nitrification rates in agroforestry systems. Biology and Fertility of Soils, 39(4): 269–279.
Zhang, Z., Fukushima, T., Onda, Y., Gomi, T., Fukuyama, T., Sidle, R., Kosugi, K., and Matsushige, K. (2007). Nutrient runoff from forested watersheds in central Japan during typhoon storms: implications for understanding runoff mechanisms during storm events. Hydrological Processes, 21(9): 1167–1178.
Ta b le 1 The m ean a nd st and ard de viatio n ( S D) of DO C con ce ntr at io ns [m g L-1 ], wat er disch arge [m3 s-1] and air te mper ature [ ℃ ] at PL , DYK an GGL sta tio ns in dry (N ov – Apr)
and wet (May
– O ct) sea son s an d f or w h ole ca len dar ye ars d uring th e ob serv atio n per io d. T he num be in p are nthe se s st an ds for sa mple s iz e Sta ti on Se as on 2002 2003 2004 2005 2012 2013 2014 All DOC ( m g L -1, Mea n±SD) PL D ry 0.76±0.1 9 (22) 0.72±0.2 5 (51) 0.62±0.1 8 (54) 0.51±0.1 0 (34) 0.50±0.1 7 (62) 0.75± 0.3 6 (48) 0.60±0.3 0 (47) 0.63±0.2 6 (322) W et 0.76±0.2 5 (52) 0.94±0.2 2 (53) 0.96±0.3 4 (51) 0.72±0.2 3 (27) 0.78±0.3 7 (62) 1.20± 0.4 6 (41) 0.75±0.2 6 (45) 0.87±0.3 5 (333) A ll 0.76±0.2 3 (74) 0.83±0.2 6 (104) 0.78±0.3 2 (105) 0.60±0.2 0 (61) 0.64±0.3 2 (124) 0.95± 0.4 7 (89) 0.67±0.2 9 (92) 0.75±0.3 3 (655) DYK D ry 0.76±0.2 6 (22) 0.87±0.3 0 (51) 0.78±0.2 1 (54) 0.58±0.1 3 (34) 0.66±0.5 6 (62) 0.71± 0.2 4 (46) 0.63±0.2 2 (49) 0.71±0.3 3 (318) W et 1.06±0.3 6 (52) 1.28±0.3 2 (54) 0.99±0.2 3 (52) 0.73±0.4 6 (27) 0.87±0.4 4 (62) 1.1 1±0.38 (42 ) 0.73±0.2 8 (47) 0.96±0.4 0 (336) A ll 0.97±0.3 6 (74) 1.08±0.3 7 (105) 0.88±0.2 4 (106) 0.65±0.3 3 (61) 0.71±0.5 1 (124) 0.90± 0.3 7 (88) 0.68±0.2 6 (74) 0.84±0.3 9 (654) GG L D ry 0.72±0.2 7 (21) 0.72±0.2 4 (51) 0.70±0. 11 (54 ) 0.64±0.1 3 (34) 0.57±0.1 8 (61) 0.86±0.3 4 (49) 0.61±0.2 1 (48) 0.68±0.2 3 (318) W et 1.01±0.2 5 (52) 0.98±0.3 3 (54) 0.76±0.3 7 (52) 0.69±0.3 0 (27) 0.83±0.4 9 (61) 1.18± 0.3 0 (42) 0.83±0.6 4 (47) 0.90±0.4 5 (335) A ll 0.92±0.3 9 (73) 0.85±0.3 2 (105) 0.73±0.2 7 (106) 0.66±0.2 2 (61) 0.70±0.3 9 (122) 1.00± 0.3 6 (91) 0.72±0.4 8 (95) 0.80±0.3 8 (653) Wa ter di sc ha rge ( m 3 s -1 , M ea n±SD ) PL D ry 6.12±6.7 3 (181) 11 .21 ±19.5 3 (180) 11 .85 ±13.5 0 (182) 13.81± 12.64 (1 81) 15.12±1 1.5 6 (182) 11 .45 ±12.9 1 (181) 12.77±1 1.6 1 (181) 11.76±13.35 (1268) W et 9.37±2 1.83 (18 4) 9.90±1 7.55 (18 4) 14.17±23.16 (1 82) 21.94±37.84 (1 84) 15.30±25.85 (1 84) 10.93± 20.24 (1 84) 13.85±14.04 (1 84) 13.64±24.26 (1286) A ll 7.75±1 6.27 (36 5) 10.55±18.55 (3 64) 13. 02±18.99 (3 64) 17.91±28.56 (3 65) 15.21±10.04 (3 66) 11 .19 ±16. 98 (365) 13.31±12.89 (3 65) 12.68±19.70 (2554) DYK D ry 2.29±3.2 5 (181) 3.71±6.1 7 (181) 3.55±6.7 1 (182) 7.61±1 0.14 (18 1) 9.50±6.9 2 (182) 7. 03±6.8 9 (181) 7.19±5.6 6 (181) 5.88±7.6 9 ( 126 W et 4.67±1 2.61 (18 4) 4.84±8.2 9 (184) 6. 62±1 1.73 (1 79) 19.65±40.90 (1 84) 13. 10±26.16 (1 84) 8.60±1 6.72 (18 4) 9.41±1 0.90 (18 4) 9.53±2 1.72 (12 83) A ll 3.49±9.3 1 (365) 4.28±8.2 6 (365) 5.01±9. 60 (361) 13.68±30.46 (3 65) 11 .31 ±19.2 4 (366) 7.82±1 2.83 (36 5) 8.31±8.7 7 (365) 7.70±1 6. 42 (25 52) GG L D ry 0.57±1.0 0 (167) 1.34±1.6 4 (181) 1.70±2.2 5 (182) 2.85±2.8 4 (181) 1.29±1.3 3 (182) 1. 36±1.8 2 (181) 0.75±1.1 6 (179) 1.40±2.0 9 ( 125 W et 1.07±2.8 2 (171) 1.75±2.4 8 (184) 2.27±3.7 1 (184) 5.93±1 0.80 (18 4) 2.16±5.4 6 (184) 1. 81±4.9 7 (184) 3.12±5.6 8 (184) 2.59±5.9 2 ( 127 A ll 0.82±2.1 3 (338) 1.55±2. 11 (36 5) 1.99±3.0 8 (366) 4.40±8.0 6 ( 365) 1.73±4.0 0 (366) 1.59±3.8 3 (365) 1.95±4.2 8 (363) 2.01±4.4 9 ( 252 Ai r te mpe rat ure ( ℃ , M ean±SD ) We at he r st ation D ry 17.85±4.06 (18 1) 17.47±4.35 (1 80 ) 16.69±3.78 (18 2) 17.08±4.79 (1 81 ) 16.70±3.96 (18 2) 16.88±3.44 (1 56 ) 15.84±3.83 (18 1) 16.25±4.0 0 (12 43) W et 24.48±2.35 (18 4) 24.34±2.69 (1 84 ) 23.71±2.96 (18 4) 24.60±2.49 (1 84 ) 23.48±2.71 (18 4) 24.54±2.76 (1 84 ) 24.55±2.71 (18 4) 24.24±2.7 7 (12 88) A ll 20.70±4.97 (36 5) 20.41±5.47 (3 64 ) 19.99±5.07 (36 6) 20.17±5.78 (3 65 ) 19.74±5.04 (36 6) 21.02±4.91 (3 40 ) 20.23±5.47 (36 5) 20.39±5.2 4 (25 31)
Ta b le 2 The ob ser ved minimum, m a xi m um a nd mean ± sta n dard d ev iat io n (SD) of DOC c on cen tra tion s [m g L-1 ] and t he m a ximu m water dis char ge [m3 s-1] for fo ur s ampled typ ho on e ven ts at PL, DYK an d G G L sta tio ns. T he n umb er in paren the se s s tand s f or s am ple siz e St ati on Y ear Ty phoon Wa te r D is ch ar ge ( m 3 s -1 ) DOC (m g L -1 ) Max Min Max Mean ±SD PL 201 2 Saol a 641. 3 0.68 2.36 1.33 ±0.4 9 (2 4) 201 3 Soul ik 381. 9 0.57 2.79 1.53 ±0.8 1 ( 11) 20 13 Tar m i 365. 3 0.64 2.40 1.21 ±0.6 9 (1 4) 20 14 Mat m o 203. 8 0.76 1.93 1.40 ±0.4 0 ( 11) All 0.57 2.79 1.35 ±0.6 0 (6 0) DYK 201 2 Saol a 592. 8 0.65 2.17 1.14 ±0.3 8 (2 4) 201 3 Soul ik 468. 7 0.52 4.1 1 1.37 ±1.0 8 (1 0) 20 13 Tar m i 291. 2 0.63 2.68 1.07 ±0.6 4 (1 3) 20 14 Mat m o 201. 3 0.69 1.92 1.31 ±0.5 1 (1 0) All 0.52 4.1 1 1.20 ±0.6 4 (5 7) GGL 201 2 Saol a 135. 1 0.59 2.73 1.32 ±0.5 5 (2 4) 201 3 Soul ik 130. 6 0.50 2.89 1.33 ±0.8 5 (1 0) 20 13 Tar m i 76.3 0.52 2.70 1.03 ±0.7 0 (1 3) 20 14 Mat m o 97.5 0.62 2.19 1.21 ±0.5 7 (7 ) All 0.50 2.89 1.24 ±0.6 5 (5 4)
Ta b le 3 Non-typ hoo n and ty pho on r atin g cur ves d eriv ed from th e o bser ve d DOC flu x [
g s
-1 ] ag ain st water dis char ge Q [m 3 s -1 ] a t P L, DY K an d GG stat io ns T yphoon peri od Non-T ypho on peri od DOC flux [g s -1 ] R 2 Sam ple size DOC flux [g s -1 ] R 2 Sam ple size PL 1.22 Q 0.99 0.92 71 0.92 Q 0.86 0.83 634 DYK 1.03 Q 1.01 0.98 68 0.87 Q 0.89 0.91 636 GGL 1.1 1 Q 0.98 0.92 64 0.71 Q 0.97 0.94 632Tab le 4 DO C yield [ kg ha-1 y-ha-1] at PL, DYK a nd G G L st ations d u ring ty ph oon a nd non-typ hoo n p erio ds . Th e per cen tag e of ty pho on co ntr ibut io n t the ann ual to tal DO C f lu x a nd wat er d is charge are also sho w n . SD s tands for st and ard d ev iat ion Stat io n Ye ar Nu m ber of ty pho on ev ent s Dur ati on [D ay s] DO C y ie ld [ kg ha -1 y -1 ] Co ntri bu tio n of Ty phoo n (%) Dry (Non -T yphoon) We t (Non -T yphoon ) We t (T yphoon) Su m DOC flux Wa te r di schar ge PL 2002 3 9 5.88 5.40 6.67 17.96 37.2 25.6 2003 5 9 9.27 7.66 2.51 19.44 12.9 7.0 2004 7 19 9.47 6.95 13.67 30.09 45.4 31.1 2005 7 23 11 .89 10.48 16.46 38.83 42.4 27.4 2012 3 8 12.99 10.31 6.06 29.36 20.6 11 .8 2013 4 9 9.92 6.61 6.27 22.80 27.5 16.7 2014 2 3 11 .15 11 .32 1.65 24.12 6.8 3.7 M ean ±SD 4.25 ±1.91 1 1± 6. 57 10.08 ±2.3 0 8.39 ±2.28 7.61 ±5.50 26.09 ±7.2 3 27.6 ±14.9 16.2 ±10.6 DYK 2002 3 9 3.38 3.76 4.61 11 .74 39.3 31.2 2003 5 9 5.02 5.34 2.19 12.55 17.4 12.1 2004 7 19 4.16 4.74 8.32 17.22 48.3 39.2 2005 7 23 9.92 11 .99 22.18 44.10 50.3 38.1 2012 3 8 12.53 12.44 7.49 32.47 23.1 15.5 2013 4 9 9.43 7.66 6.45 23.54 27.4 19.4 2014 2 3 9.73 1 1.27 1.96 22.94 8.5 5.6 M ean ±SD 4.25 ±1.91 1 1± 6. 57 7.74 ±3.51 8.17 ±3.70 7.60 ±6.89 23.51 ±1 1.5 6 30.6 ±15.8 17.2 ±11 .8 GGL 2002 3 9 2.82 2.82 3.83 9.47 40.5 31.4 2003 5 9 6.37 7.28 2.29 15.94 14.4 9.9 2004 7 19 7.22 6.04 9.58 22.84 41.9 32.4 2005 7 23 13.57 14.85 20.85 49.27 42.3 32.6 2012 3 8 6.31 7.25 4.95 18.51 26.7 19.6 2013 4 9 6.50 5.01 5.78 17.29 33.4 24.9 2014 2 3 3.69 13.10 2.65 19.44 13.6 9.4 M ean ±SD 4.25 ±1.91 1 1± 6. 57 6.64 ±3.46 8.05 ±4.35 7.13 ±6.52 21.82 ±12 .7 7 3 0. 4± 12.5 22.8 ±9.5
Figure 1 The study watershed, including water sampling sites, discharge gauges, weather station and land use patterns. Water samples were taken from PL, DYK, and GGL watersheds
Figure 2 The monitored air temperature [℃] (red line), water discharge [m3 s-1] (blue line), and
DOC concentration [mg L-1] in the (a) PL, (b) DYK and (c) GGL watersheds. The three
watersheds share the same air temperature data shown in panel (a). Water samples include typhoon (open circle) and non-typhoon (black dot) samples. The running average of 5 adjacent DOC samples is illustrated by a thick grey line
Figure 3 The log-log graphs of observed DOC fluxes [g s-1] against water discharge [m3 s-1] at (a)
PL, (b) DYK and (c) GGL watersheds for both typhoon (red circle) and non-typhoon (black dot) samples
Figure 4 The relation of observed DOC concentration [mg L-1] against water discharge [m3 s-1] in
(a) PL, (b) DYK, and (c) GGL watersheds. Blue circles and black dots indicate non-typhoon samples taken in dry (cool) and wet (warm) season, respectively. Red circles stand for typhoon samples. Grey dashed lines represent the median of the sampled discharge (Q50) at each station
Figure 5 Box-and-whisker plot of sampled (a) DOC concentration [mg L-1], (b) water temperature [℃], and (c) discharge [m3 s-1] at PL (-1), DYK (-2) and GGL (-3) watersheds during the observation period. Samples were divided into 5 categories based on the sampled discharge (<Q50 and ≥Q50), seasons (Dry and Wet), and typhoon periods (Typhoon). Red arrows are shown when the mean values of sampled DOC concentration/water temperature/discharge in dry and wet season are statistically significantly different (higher or lower, p-value<< 0.05) by passing the t-test. Red stars represent the observations during typhoon periods and non-typhoon periods are statistically significantly different (higher or lower, p-value<< 0.05) by passing the t-test. Water temperature, instead of air temperature, is used because only water temperatures were recorded for every water sample DOC [mg L -1] Water temperature [ oC] Discharge [m 3s -1]
Figure 6 DOC concentrations [mg L-1] (black circle) and water discharge [m3 s-1] (blue line) observed at (a) PL, (b) DYK, and (c) GGL watersheds during the typhoons Saola (-1), Soulik (-2), Trami (-3), and Matmo (-4). The last non-typhoon sample taken before the invasion of the respective typhoon is illustrated as red dot
Figure 7 Comparisons between (a) DOC concentrations [mg L-1] and (b) DOC yields [kg km-2 yr-1] against runoff depth of our study watersheds (star) with the world rivers (circle). Bar charts represent histograms of (a) DOC concentration and (b) DOC yield of the word rivers. Blue line stands for the cumulative probability curve derived from the histogram
Figure 8 The relations of contribution of typhoons to annual DOC flux [%] against to annual water discharge [%] at (a) PL, (b) DYK, and (c) GGL watersheds
投稿日期:108 年 11 月 05 日 修正日期:108 年 11 月 21 日 接受日期:108 年 11 月 27 日
![Figure 2 The monitored air temperature [℃] (red line), water discharge [m 3 s -1 ] (blue line), and](https://thumb-ap.123doks.com/thumbv2/9libinfo/7130009.38863/21.808.92.715.108.617/figure-monitored-temperature-line-water-discharge-blue-line.webp)
![Figure 3 The log-log graphs of observed DOC fluxes [g s -1 ] against water discharge [m 3 s -1 ] at (a)](https://thumb-ap.123doks.com/thumbv2/9libinfo/7130009.38863/22.808.93.723.110.338/figure-log-graphs-observed-doc-fluxes-water-discharge.webp)
![Figure 4 The relation of observed DOC concentration [mg L -1 ] against water discharge [m 3 s -1 ] in](https://thumb-ap.123doks.com/thumbv2/9libinfo/7130009.38863/23.808.95.720.106.341/figure-relation-observed-doc-concentration-mg-water-discharge.webp)
![Figure 5 Box-and-whisker plot of sampled (a) DOC concentration [mg L-1], (b) water temperature [℃], and (c) discharge [m3 s-1] at PL (-1), DYK (-2) and GGL (-3) watersheds during the observation period](https://thumb-ap.123doks.com/thumbv2/9libinfo/7130009.38863/24.808.110.708.104.667/figure-whisker-sampled-concentration-temperature-discharge-watersheds-observation.webp)
![Figure 6 DOC concentrations [mg L-1] (black circle) and water discharge [m3 s-1] (blue line) observed at (a) PL, (b) DYK, and (c) GGL watersheds during the typhoons Saola (-1), Soulik (-2), Trami (-3), and Matmo (-4)](https://thumb-ap.123doks.com/thumbv2/9libinfo/7130009.38863/25.808.89.724.104.534/figure-concentrations-circle-discharge-observed-watersheds-typhoons-soulik.webp)
![Figure 7 Comparisons between (a) DOC concentrations [mg L-1] and (b) DOC yields [kg km-2 yr-1] against runoff depth of our study watersheds (star) with the world rivers (circle)](https://thumb-ap.123doks.com/thumbv2/9libinfo/7130009.38863/26.808.196.613.108.689/figure-comparisons-concentrations-yields-runoff-watersheds-rivers-circle.webp)
![Figure 8 The relations of contribution of typhoons to annual DOC flux [%] against to annual water discharge [%] at (a) PL, (b) DYK, and (c) GGL watersheds](https://thumb-ap.123doks.com/thumbv2/9libinfo/7130009.38863/27.808.100.720.110.333/figure-relations-contribution-typhoons-annual-annual-discharge-watersheds.webp)
