行政院國家科學委員會專題研究計畫 期中進度報告
下一代多層級多媒體應用服務匯流網路--子計畫四:分散式
視訊偵搜所需整合性網路與計算服務之研究(2/3)
期中進度報告(精簡版)
計 畫 類 別 : 整合型
計 畫 編 號 : NSC 95-2221-E-002-193-
執 行 期 間 : 95 年 08 月 01 日至 96 年 07 月 31 日
執 行 單 位 : 國立臺灣大學電機工程學系暨研究所
計 畫 主 持 人 : 張時中
報 告 附 件 : 出席國際會議研究心得報告及發表論文
處 理 方 式 : 本計畫可公開查詢
中 華 民 國 96 年 07 月 14 日
下一代多層級多媒體應用服務匯流網路--子計畫四:分散式視訊偵搜所需整合性網路與計算服
務之研究(2/3)
計劃類別:整合型計劃
計劃編號:NSC 95-2221-E-002-193
執行期限:
95 年 8 月 1 日至 96 年 7 月 31 日
整合型計劃:總計劃主持人:蔡志宏教授
子計畫主持人:張時中教授
子計畫參與人員:朱紹儀 張家瑋 葉力維 林哲煒 呂文彥
執行單位:國立台灣大學電機工程學系
一.
中文摘要
本計劃的第二年研究工作為探討 IP 網路上以 P2P 社 群進行視訊偵搜服務與資訊分享的商務模型。研究進 展主要包括以下兩部分: (一) 有影像品質保證的移動視訊偵捜路由演算法之 研究與路由演算法實做 研究目的是在隨意網路上實現有影像品質保證的移 動視訊偵搜服務。我們研究以下兩個課題:1.如何週 期性取得網路上其他節點的資訊、2. 如何建立並動態 調整跳躍數少、能提供足夠的資料傳輸速度傳輸路 徑。我們首先利用實驗了解隨意網路傳輸特性後,在 IP 層設計了一個鄰居資訊表路由法協定,包含鄰居資 訊列表交換堆疊和鄰居資訊路由演算法 NILRA,來解決 所提出的兩個主要研究問題。 我們在 IEEE 802.11 架構下以 4 台的筆記型電腦和運 用 visual basic.NET 與 SQL2000 來實做,並與最短路 徑法比較影像傳輸品質。 (二) P2P 社群使用者行為模型的建立與分享誘因實驗 設計 以同儕對同儕式的教材分享系統為基礎,探討四個 促進分享的重要議題:1. 建構教材分享系統會員數成 長與教師上傳行為模型、2. 建構以網路社群經驗資料 為 基 礎 之 使 用 者 分 享 行 為 集 體 模 型 (collective behavior)、3.評估不同獎勵政策對系統教材質與量的 影響、4. 基於無誘因制度下使用者行為模型,設計使 用者對獎酬制度反應模型之實驗。藉由上述使用者行 為模型的分析與實驗設計,為未來社群管理者提供建 立架構處方性(prescriptive)模型以進行誘因設計 (incentive design)。 關鍵詞:行動視訊偵搜、鄰居資訊列表、路由演算法、 定位、內容與服務分享、誘因、獎酬制度、使用者行 為模型、實驗設計、經驗數據分析 Abstract:In the second yeart, we aim at constructign the business model of video surveillance service and information sharing on P2P community in IP network. Progresses of our research mainly include two parts: I. Design and implementation of neighbor
information-based mobile video surveillance routing over ad hoc networks
The focus of this task has been to explore an innovative mobile video surveillance services, and the quality of video is guaranteed. We have studied two issuesw:i) How to periodically obtain neighbor node information in an ad hoc network, and ii) how to establish transmission path with a low number of hops, enough data rate, and easy to maintain.
We first conducted some experiment to understand the transmission characteristics of an ad hoc network, and then designed a neighbor information list (NIL) routing protocol on the network layer. This protocol contains NIL exchange stack and a NIL routing algorithm (NILRA), which addresses the two main research issues. We used four notebooks and VB.NET TM and SQL2000 TM software development environment for a simple prototype implementation of our design and for comparison of NILRA with a shortest path routing algorithm.
II. P2P user behavior modeling and experiment design for incentive scheme:
On top of a P2P teaching material sharing environment, we have studied four issues for encouraging sharing among peers: 1) construction of Membership growth and content sharing model, 2) collective behavior modeling with empirical data from a production TMS, 3) Impact analysis of different reward policies to the quality and quantity of TMS, and 4) experiment design for constructing a model of user response to rewards.
Our research offers TMS community a method and models to construct prescriptive model for incentive design.
Keywords: mobile video surveillance, neighbor
information list, routing algorithm, positioning, content and service sharing, incentive, reward policy, user behavior modeling, experiment design, empirical data analysis
二. 研究緣由,目的與成果
I. 有影像品質保證的移動視訊偵捜路由演
算法之研究與路由演算法實做
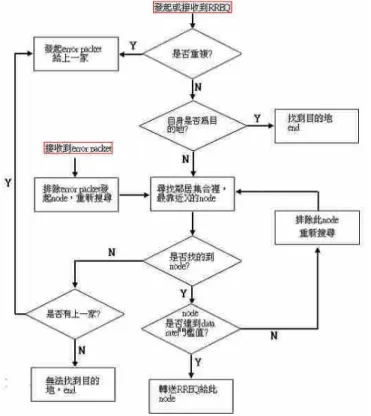
I.1 研究目的 本研究想設計的移動視訊偵搜網路是希望在一 個沒有任何固定式通訊基設備的戶外環境下(無 AP,如戰爭或災害發生時),還是可以立即提供偵搜服務的系 統。其中戶外環境的定義是小型的戶外區域範圍(例如 600 乘 600 公尺範圍內),且其中可能有目視障礙物(如 樹木,房子,橋樑等),我們希望花費最少時間力氣取 得想監視的影像畫面。本研究主要研究目的就是在此 環境中實現有影像品質保證的移動視訊偵搜服務。 I.2 研究問題探討 要實現移動視訊偵搜服務首先必須要知道偵搜 任務的目的地在那(座標位置),以及是否有 node 在目 的地附近。所以我們必須要先有位置資訊,也就是取 得隨意網路上自身與其他 node 的座標位置。但是由於 隨意網路裡的 node 都是可以自由移動的,不但自身的 位置會不停的改變,而且每一個 node 傳輸範圍內的鄰 居也會隨時間而不同,而所建立好的路徑也可能因 node 移動而損毀。再者,802.11 架構設計使得多次跳 躍 (Multi-Hop) 的 傳 輸 方 式 會 造 成 網 路 的 吞 吐 量 (throughput)嚴重下降;且兩個 node 之間距離越遠, 802.11 能提供的傳輸速度也會越低,此兩項因素不利 於即時多媒體的傳輸。因此我們提出了兩個主要研究 問題: 1. 如何取得網路上其他節點的資訊。 2. 如何建立即時影像傳輸路徑(只考路單一傳輸路 徑),此路徑須符合以下要求。 甲、 影像傳輸不易中斷(降低路徑連結中斷的機 率) 乙、 較少 HOP 數 丙、 能提供足夠的資料傳輸速度 為了了解第二項研究問題的實際情況,我們利用 實驗了解在隨意網路上傳輸即時影像的真實特性。其 實驗包括距離遠近與多次跳躍等兩個實驗。由實驗結 果和數據的分析,得知了在隨意網路上傳輸影像的特 性,如下: 1. 當距離越遠的時候,兩個 node 之間的最大 吞吐量會持續的下降(影像越來越差),圖 1。 2. 當路徑上的 HOP 數量越多時,此路徑的吞吐 量值的確會越來越低(影像越來越差),圖 2。 經過上述的實驗結果分析,我們了解了實際傳輸即時 影像會產生的問題,而在設計服務系統時必須考量這 些特性存在。 為了提供有影像品質保證的移動視訊偵搜服務 (含有位置資訊),我們利用實驗所得到傳輸即時影像 的實際特性,在網路層設計了一個鄰居資訊表路由協 定(圖 3)來解決所提出的兩個主要研究問題。鄰居資訊 表路由協定包含鄰居資訊列表交換堆疊(NIL exchange stack)和鄰居資訊路由演算法(NILRA),其中 NIL 交換 協定的想法是希望以區域性方式建立拓撲以減少控制 訊息的浪費,而其建立方法與更新方法是設定每一個 node 可以週期性的取得鄰居的廣播(broadcast)來保 持最新鄰居資訊(包含 IP address,經緯度位置,移動 速度,方向和 Data rate)(表 1),此些資訊可以幫助 路由法來建立和維持路徑;而路由演算法(NILRA)裡我 們詳細的說明包含尋找路徑,回傳搜尋資訊,建立影 像傳輸路徑,降低路徑中斷機率等功能。 尋找路徑演算法的主要想法(圖 4)是接收到搜尋 封包的 node,如果自身與目的地之間的距離不在門檻 值內,則在自身的鄰居列表裡,尋找符合傳輸速度條 件的鄰居中位置最靠近目的地的 node(利用經緯度位 置和傳輸速度資訊),接著將搜尋封包送給此 node,以 此類推即可尋找到一條跳躍(HOP)數較少且符合傳輸 速度的路徑。路徑搜尋演算法演算法的步驟如下: 符號定義(Notations) MN 出發端(任務發起端)節點的任務編號 (Mission Number) i, j, k 節點標籤(node label),以 IP 位址表示 Li 節點 i 的 NIL,含 1. 經緯度座標,2. 傳輸 速度,3. 鄰居節點 IP 位址; in 節點 i 的鄰居所成的集合
RREQ 路由要求封包(Routing Request packet) Xd , Yd 目的地經緯度座標 EP 錯誤資訊封包(error packet - 內含發起者 的 IP 位址與任務編號) Xi,Yi 節點 i 的經緯度座標 Rmin DN 與 Xd,Yd 的距離門檻值 i* in 集合中的一個節點 DR 傳輸速度的門檻設定值 Disti 節點 i 和目的地(Xd ,Yd 經緯度座標)距離 DRi* Li 裡 i*的傳輸速度值
SN RREQ 的發起節點(Source Node)
路徑搜尋演算法 輸入: i,j,k RREQ(內含 Xd ,Yd,Rmin,SN_s) error packet(內含發起者的 IP 位址) in,jn Li Xin,Yin DR Xi,Yi 輸出: 1. 目的地 node 為 i 2. 無法找到 Rmin 範圍內的 node Step 1:封包分析 if ( i 接收到 j 的 RREQ ) 紀錄上一個 node j if ( MN 重複 ) 發生回圈(loop),i 產生 EP,傳給 j; else 將 SN_s 記錄下來; end if else if ( i 接收到 k 的 EP ) in = in \ {k}; # (將 in 裡的 k 刪除) 執行 step 3; else if ( i 是任務發起者 )
i 產生一個 RREQ 封包和任務編號 MN end if Step 2:目的地檢查 計算 i 與 Xd ,Yd 的距離 Disti = (XdXi)2(YdYi)2 if ( Disti < Rmin ) DN = i; 輸出 “ 目的地 node 為 i ” Stop; else in = in \ { j};# (將 in 裡的 j 刪除) end if Step 3:尋找鄰居列表裡的 node,檢查傳輸速度門檻 值 if ( in =
) 執行 step4; else i* = arg { minz in ( 2 2 (XdXz) (YdYz) ) } DRi* = Li 裡的 i*的傳輸速度值 if ( DRi* < DR ) in = in \ {i*}; # (將 in 裡的 i*刪除) 重新執行 Step 3; else 轉送(relay)RREQ 給 i*; Stop; end if end if Step 4:返回上一個 node if ( j =\= 0 ) # 0 代表不存在 傳送 EP 給 j; Stop; else 輸出 “ 無法找到 Rmin 範圍內的 node ”; Stop; end if 建立好的路徑後,其 node 也可以利用移動速度 與方向這兩個資訊來降低傳輸路徑中斷的機率。假如 傳輸路徑上的目的地 node 以每秒一公尺的速度往北方 移動,路徑上的其他 node 也將以同樣速度和方向移 動。由此可以維持建立好的路徑 node 相對位置不變, 進而降低因為移動而使路徑損毀的機率。在這裡我們 不考慮路徑損毀中斷後如何自動修復此路徑。 NILRA 主要的創新為利用鄰居資訊來發送少量的 路徑搜尋封包,即可搜尋到足夠傳輸速度的路徑。另 外為了讓使用者可以下達需求,在應用層上本研究設 計了指令堆疊(圖 3),包含搜尋、移動、取得影像和訊 息回傳等四個功能性方塊,其目的是用來協助使用者 指令介面與所設計的路由演算法做溝通,並且同時可 利用位置資訊來指揮路徑上的節點移動以完成視訊偵 搜任務。 I.3 實作成果 本 研 究 的 實 做 方 面 , 我 們 使 用 了 VB.NETTM 和 SQL2000TM 在應用層簡易的實現鄰居資訊表路由協定(如 圖 5)。在 NIL 交換堆疊實做方面,利用 VB.NETTM設計好 的廣播(Broadcast)程式,將自身的資訊週期的廣播(使 用 UDP 封包)出去,而其他 node 接收到廣播則將此資訊 加入自己的 NIL 資料庫(SQL2000)裡。而在路由法實做方 面,使用 VB.NETTM程式將建立好的 NIL 讀取出來,使用單點傳送(unit-cast 的 UDP 封包)將搜尋資料(RREQ)依 照 NILRA 的搜尋方式傳給符合條件之鄰居。而所找的目 的端會依原搜尋路徑將回覆封包(RREP)傳回給出發端 (圖 6)。影像傳輸方面,使用 Windows 內建的 route 指 令將所找到的路徑建立起來,開啟 webcamXP 即時影像分 享軟體將影像傳回給出發端。我們舉出一個例子,如圖 7,紅色為 NILRA 找到的路徑,綠色為最短路徑法找到的 路徑,接著比較此兩條路徑,其吞吐量、資料遺失率和 人眼評分影像之優劣。由數據結果可得知本研究的路由 法的確可以尋找到有足夠傳輸速度之路徑(表 2)。 I.4 能源限制的考慮 為了使無線視訊偵搜系統服務,能在能源有限的戰 場中延長它的使用時間,本研究的主要目的為平均的消 耗各節點的能源,以使整個系統能加長運作的時間。本 系統是架構在 802.11b/g 上的 ad hoc 模式上,運用 ad hoc 的多點傳輸模式,建立起整個系統。由於需要透過 多點來傳輸,所以為了避免有些點過度使用,造成過早 進入 dead node 的情形,所以要想辦法延長每個 node 的使用時間,使整個系統能運作更久。再者是由於影像 的傳輸比一般的聲音傳輸要花更長的時間,所以連結的 穩定性也必須要考量。本研究在系統的設計上,主要分 為兩個部分:(1)應用層的設計,(2)網路層裡節能路由 的設計。其整個系統的架構圖請見(圖 8)。在應用層的 設計分為兩個部分,第一部分是影像的傳輸介面,是運 用 RTP (Real-time Transport Protocol)/RTCP(Real-time Transport Control Protocol)做為即時影像的傳輸協定,RTP 和 RTCP 配合 使用,能以有效的回饋和最小的頻寬開銷,使傳輸效率 最佳化,因而特別適合傳送網路上的即時資料。第二部 分是命令的堆曡,裡面包含了三個主要的命令,分別是 搜尋、移動及監看。而在網路層的路由設計上,我們加 入了 neighbor list 的概念,在每個節點上利用定時廣 播來取得附近節點的基本資料,包含了 IP address、位 置座標、功率強度、剩餘能量,這是為了使在搜尋時能 夠快速的找到合適的節點。表 3 為 neighbor list 的格 式 。 而 整 個 路 由 的 路 徑 搜 尋 及 維 持 , 我 們 參 考 了 AODV[PR99]和 ESDSR[TTN05]的想法,提出了一個新的路 由方法 Energy Saving Neighbor list Routing (ESNR), 主要是利用上面的 neighbor list 來搜尋目標物附近的 節點,再者在回傳的訊息裡加入了利用剩餘能量和傳輸 功率所計算出來的 RT(t)值,藉此來判斷出哪一條路徑 能夠傳輸較長的時間,這樣就能夠減少能量不足的節 點,過度的被使用,造成整個系統太早進入無法傳輸的
情形。而在路徑維持方面,如果中間有節點要移動離開 或能量不足所造成的連結中斷,則由前一個節點去尋找 替代的路徑,避免從頭開始建立路徑,造成能量的浪費。 I.5 研究成果總結 1. 利用實驗測量實際在隨意網路上傳輸即時影像的 特性,包含距離越遠、路徑 HOP 數與吞吐量之間的 關係。 2. 鄰居資訊列表(NIL)的設計,可以週期性廣播自身 資訊以及動態的取得最新鄰居資訊(包含位置資訊 等等)。 3. 設計了一套路由演算法(NILRA)。其利用 NIL 資訊 來發送少量的路由封包,即可建立一條跳躍數少且 提供足夠傳輸速度的路徑。 4. 設計了移動指令,指揮 node 的移動來完成偵搜任 務,且可藉由位置資訊來指揮 node 保持影像傳輸 路徑不中斷。 5. 使用了 VB.NETTM 和 SQL2000TM 在應用層簡易的實做 了 NIL 的建立更新和 NILRA 演算法,且證明 NILRA 的路徑能提供有影像品質保證的傳輸路徑。 目前正在繼續進行如下: 甲、 多個任務造成資源分配不均的問題 乙、 自動修復傳輸路徑的問題 丙、 週期性廣播造成電力浪費之問題
II. P2P 社群使用者行為模型的建立與分享誘
因實驗設計
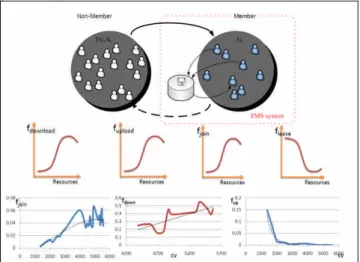
II.1 設計目的 在九年一貫教育體系與一綱多本政策下,近年來 國內教材分享網站蓬勃發展。但目前缺少鼓勵分享行 為的有效誘因。為建構出高品質與持續成長數量的 P2P 網路分享社群,本研究主要目的為提出架構處方性模 型之方式以進行誘因設計。由過去的研究中發現,網 站資源的量和質與獎勵誘因為影響社群使用者分享行 為的主要因素。獎勵誘因對於促使使用者分享有直接 的影響,網站資源的量和質則可能間接影響使用者分 享行為。 II.2 研究問題探討 本研究探討四項行為:網路社群的加入、離開及社群 服務的使用、提供。因此本研究分為四項研究議題: 1. 建構教材分享系統會員數成長與教師上傳行為模 型、2. 建構以網路社群經驗資料為基礎之使用者分享 行為集體模型(collective behavior)、3.評估不同獎 勵政策對系統教材質與量的影響、4. 基於無誘因制度 下使用者行為模型,設計使用者對獎酬制度反應模型 之實驗。 II.3 成果 我們建立使用者加入或離開社群與上傳教材的模 型,並討論這些行為之間的相互影響。根據科技接受模型(technology acceptance model)與呂慧甄對影響 知識分享因素研究(Lu 2003),並以 S 曲線建立教材分 享系統行為的機率模型。研究中之數學模型建立附於 附錄中。此模型掌握影響教師行為的重要因子且符合 基本經濟學原理,做為未來實驗的理論基礎(如圖 9)。 基於過去設計之 Bass model 與 S 曲線使用者行為 模型,我們提出 S-shaped 曲線以捕捉網站資源的量和 質與使用者行為之間的關係。並在無誘因制度的前提 下,利用著名網路社群思摩特(SCTNet)的經驗數據, 驗證行為機率與網站資源的關係。以統計軟體進行迴 歸分析經驗數據後,驗證模型正確性。藉由實際網站 之經驗數據,以曲線配適法導出 S-shape 之模型實際 參數,以提供未來研究或網路管理之處方性模型。成 果如圖 10-13 所示。 根據此模型,我們評估兩種獎勵誘因政策給教材上 傳者之影響,分別是相對排名法(relative ranking) 與閥值法(threshold)。相對排名法可以讓高品質檔案 上傳者得到較多獎勵,讓他們上傳意願提高,增進檔 案的平均水準。而閥值法齊頭式地鼓勵教材上傳行 為,可以增加上傳的數量(如圖 14、15)。 另外為架構使用者對獎酬制度反應模型之實驗 設計,由於在過去文獻中發現,相較分等之獎酬制度 下,較能激勵使用者提出高品質的資源。我們以相較 分等(relative ranking)的獎酬制度進行探討使用者 反應模型之實驗設計。相較分等獎酬制度,將名譽得 分予以分等,分數越高者得越多獎勵。我們在固定社 群資源下,設計包含獎酬比例與獎酬金額兩項因子之 二因子實驗設計。二因子實驗設計不但可評估各因子 的主要影響更能探討因子間的交互作用,以探討在不 同獎酬制度中使用者行為的反應模型(如圖 16-19)。本 實驗環境設定在已架構之 P2P 資源分享社群。於實驗 室進行小型實驗,使實驗不僅節省成本更能控制可能 產生的不可預期變動。本研究藉由上述使用者行為模 型的實證分析與實驗設計,為未來社群管理者提供建 立架構處方性模型之方式以進行誘因設計。 II.4 研究成果總結
1.
我們以 S 曲線建立使用者加入或離開社群與上傳 檔案的模型,並討論這些行為之間的相互影響。此模 型掌握影響教師行為的重要因子且符合基本經濟學原 理,做為未來實驗的理論基礎。2.
我們基於過去研究中之 Bass model 與 S 型使用 者分享模型,架構 S-shaped 曲線之使用者集體行為模 型以捕捉網路資源的質和量與集體使用者加入、離開 社群、分享與利用資源的行為關係。3.
藉由思摩特往之經驗數據,我們以曲線配適法導 出 S-shaped 曲線之參數,提供未來研究與網路管理處 方性模型使用。4.
評估兩種獎勵誘因政策給檔案上傳者之影響,分 別 是 相 對 排 名 法 (relative ranking) 與 閥 值 法 (threshold)。相對排名法可以讓高品質檔案上傳者得 到較多獎勵,讓他們上傳意願提高,增進檔案的平均 水準。而閥值法齊頭式地鼓勵教材上傳行為,可以增加上傳的數量。
5.
設計雙因子實驗室環境之實驗設計,提供可控制 並較為經濟之實驗方法以架構使用者對於不同獎勵制 度之反應模型。藉由雙因子實驗室環境之實驗設計, 未來研究者可在小型實驗環境中,捕捉在不同獎酬比 例與獎酬金額下集體使用者加入、離開社群、分享與 利用資源的行為關係,以獲得架構獎勵制度處方性模 型之有效資訊。三.
計劃成果自評
本計劃除了順利完成上述之成果之外。已發表論文 如下:[1] S.-I Chu, S.-C. Chang, “Time-of-Day Internet Access Management: Virtual Pricing Vs. Quota Scheduling,” Proceedings of IEEE ICCS 2006, Singapore, Oct., 2006, pp. 1-6.
[2] Shao-I Chu, “Research on Time-of-day Internet Access Management by Quota-based Priority Control.” PhD Thesis, Dept. of Electrical Engineering, National Taiwan University, July 2007 [3] Chia-Wei Chang ,“Design and Implementation of
Neighbor Information-based Mobile Video Surveillance Routing Over Ad Hoc Networks,”
Master Thesis, Dept. of Electrical Engineering, National Taiwan University, July 2007
[4] Li-Wei Yeh,” P2P user behavior modeling and experiment design for incentive scheme,” Master
Thesis, Dept. of Electrical Engineering, National Taiwan University, July 2007
附錄
教材分享行為機率的模型
Membership GrowthAt time t, there are Ntteachers already in TMS system.
On contrast, (TN- Nt) teachers have not joined the TMS
system. The probability to join TMS system is fjoin(t), so
the expected number of new member at time t is
(TNNt)fjoin( )t . Teachers might leave the system of
probabilityfleave( )t , the expected number of remaining
member is Nt(1fleave( ))t . The total number of teacher at
time t+1 equals to the remaining member plus new member.
1
(1
( )) (
)
( )
t t leave t join
N
N
f
t
TN
N f
t
Content Growth
In each time slot, teacher might submit one new TM. Because teachers are homogeneous, their probability to upload content is the same. So the probability distribution of xt new TMs is binomial distribution with parameter
t
N and fupload( )t . The relation of content variety between
t and t+1 is CVt1CVtxt, where
x
tis a positive integerdrawn from binomial distribution.
{ } ( , , ( )) Nt( ( )) (1n ( ))Nt n
t t upload n upload upload
P x n f n N f t C f t f t
Quality Change
We use average content quality as an indicator of our system. The average content quality changes while teachers upload their new content, the average content at time t+1 is 1 1 1 ( * ( * )) n t t tj tj j t t CQ CV x cq CQ CV
Joining ProbabilityWe assumed all kinds of reward incentives transfer to monetary reward given to teacher. For example, if they join the TMS for the first time, bureau of education will give bonus to them. The bonus induces teachers to use TMS system, and the bonus given to teacher i at time t is denoted as RIit.
Forteacherthe “usefulness” isthebenefitTM brings, the TM quantity and quality affects that benefit. Teachers will get more benefit if the quantity is large and quality is high. We define the usefulness as expected TM benefit which is a function of product of
CV
t andCQ
t.The joining probability at time t is a function of expected TM benefit and reward incentive.
Pr{teacher join at time t}
f
join(
CV CQ RI
t t,
it)
Leaving Probability
Once teachers have used TMS system, they will stay for a period of time and leave afterward. The probability to leave the system reflects opposite willingness to stay. The more willingness teachers have to stay, the lower probability of teachers’ leaving. We believe the probability to leave are affected by new TM benefit and habit.
Teachers are attracted by new TMs, new TMs bring more benefit. Like many portal website, they provide new contents or services everyday to attract Internet users. If no new TMs are uploaded, teachers might leave the community. In each time slot, the more new TMs quantity and quality (
x cq
t t) the more they are attracted to thesystem.
Researchers found online shoppers’ intentions to continue using a website that they last bought at depend not only on perceived usefulness and perceived ease of use, but also on habit. In [Lu03] authors also found that sustained teacher material sharing behavior is supported by habits.
For reasons mentioned above, we define leaving probability as function of new TM benefit, existing content TMs benefit and a habit factor.
Pr{a teacher leaves at time t}
f
leave(
x cq CVCQ S
t t,
t t,
it)
Content Submission
In [Lu03] the authors find the personality is the main factor that influences the upload behavior. Altruistic teacher contribute their contents without asking reward, they get positive utility from altruism behavior. In contrast, extreme selfish teachers only upload content if they can get reward. So we model teachers upload
probability combining these two factors, altruism and reward incentive.
Pr{a teacher upload one newTMat time t} f
upload(
AL RI
i,
it)
四.
參考文獻
[CCL03] I. Chlamtac, M. Conti, Jennifer J.-N. Liu, “Mobile ad hoc networking: imperatives and challenges,”Ad Hoc Networks, Vol. 1, No. 1,
pp.13-64, July 2003.
[CWK97] B. P. Crow, I. Widjaja, J. G. Kim and P. T. Sakai, “IEEE 802.11 Wireless Local Area
Networks,” IEEE Communications
Magazine, Vol. 35, pp.15-18, September
1997.
[IEE99] IEEE Std. 802.11-1999, Parr 11: Wire/-s U N Medium Access Control (MAC) and Physical Layer (PHY) specifications, Reference number ISO/IEC 8802-11:1999(E), IEEE Std 802.11, 1999. [XUS02] Shugong Xua and Tarek Saadawi,
“Revealing the Problems with 802.11 Medium Access Control Protocol in Multi-hop Wireless Ad Hoc Networks,”
ELSEVIER Computer Networks, Vol. 38, pp.
531–548, 2002.
[COM99] S. Corson, J. Macker, “Mobile Ad Hoc Networking (MANET): Routing Protocol Performance Issues and Evaluation Considerations,” IETF RFC 2501, January 1999.
[Chi06] Yi-Ren Chiou, “TMS behavior modeling, incentive and system design against piracy and collusion” Master Thesis, NTU IE, Jul 2006
[Lai05] Jiang-Jang Lai,“P2P Network and Incentive Design for Sharing Teaching Material”
Master Thesis, NTU EE, Jul 2005.
[Lu03] Hui-Chen Lu, “Study ofInfluentialFactors on Knowledge Educators Sharing of the Case of SCTNet Network Community” Mater
Thesis, National Chung Cheng University,
Jun 2003.
[PR99] Perkins, C.E.; Royer, E.M., “Ad-hoc On-Demand DistanceVectorRouting”IEEE
1999.
[TTN05] Tarique, M.; Tepe, K.E.; Naserian, M.;, “Energy Saving DynamicSourceRouting for Ad HocWirelessNetworks”IEEE 2005
資訊
鄰居節
點 IP 位址
經
緯
度
位
置
傳輸
速度
(data
rate)
移
動
速
度
方
向
169.254.xxx.xxx xx
xx
x
xx
169.254.xx.xxx
xxx
xx
xx
xx
169.254.xxx.xx
xx
xxx
xx
x
…..
…….
表 1:NIL example 數據資料 路由方法 路徑吞吐量 資料遺失 率 人眼評分 NILRA 之路 徑 1.803Mbps 趨近 0 5 分 最短路徑法 之路徑 0.852Mbps 8.13% 2 分 表 2:路由法之數據結果比較(實驗結果) 802.11g/b 0 2 4 6 8 10 12 14 16 18 20 1 2 3 4 5 6 7 8 9 10 11 12 13 14 15 16 17 18 19 20 21 22 23 24 25 26 27 28 29 30 Distance(10m) T hr o ug hp ut (M b ps ) 802.11g/b 圖 1:距離與吞吐量(實驗數據) TCP Throughput 0 1 2 3 4 5 6 1 2 3 4 HOP數 T hr ou gh pu t (M bp s) TCP Throughput 圖 2: Hop 數與吞吐量(實驗數據)圖 3:The complete stack figure
圖 4:個別 node 的搜尋步驟邏輯流程圖
圖 5: 軟體架構堆疊
圖 6:發送 RREQ 與接收 RREP 搜尋結果
圖 8: 系統的架構圖 表 3: Neighbor list 的格式 CVt*CQt 0 10 30 50 RIit 0 100 300 500
圖 9: Technology acceptance model and s-curve join probability model
圖 10:使用者行為模型分析結果
圖 11: Design issues
R Square Sig. F-value b0 b1
0.53024 0.0021 -19042.428146 2.690284
Y=e
2000 (2.69+-19042.42/t)3000 4000 5000 6000 1000 .6 .5 .4 .3 .2 .1 0.0 -.1 觀察值 S fdownload file amount圖 12: S-shape curve fitting for download probability
IP
address
位置座標 功率強度 剩餘能
量
Peer2
xx
xx
xx
x
Peer3
x
xxx
xx
xx
6000 5000 4000 3000 2000 1000 .07 .06 .05 .04 .03 .02 .01 0.00 觀察值 S
R Square Sig. F-value b0 b1
0.88409 0.0000 -4710.0840 -2.173498
Y=e
(-2.17+-4710.08/t)fjoining
file
amount
圖 13: S-shape curve fitting for joining probability
Baseline High RI Low RI Time Slot Membership Nt Time slot High RI Low RI Baseline Number of contents CV A B
圖 14: (A) Membership in different RI scheme (B) Content variety in different RI scheme
Time slot Relative Ranking Threshold Average content Quality Time slot Relative Ranking Threshold Content Variety CV A B
圖 15: (A) Content quality under reward policy (B) Content variety under reward policy
圖 16: Experiment environment S O A P O D B C E x te rn al re q u es t
圖 17: Super-peer software stack
圖 18: Peer software stack
fupload Reward budget (D) Reward proportion 25% 10% 5% fdownload Reward budget (D) Reward proportion 25% 10% 5% fjoin Reward budget (D) Reward proportion 25% 10% 5% fleave Reward budget (D) Reward proportion 5% 10% 25%
圖 19: Expected behavior model under different reward parameters
博士班研究生出席國際會議報告書
報 告 人 姓 名
朱紹儀
所屬系所
電機工程學系
會 議 時 間 地 點
Holiday Inn ATRIUM SINGAPORE, Singapore, 30 Oct -1 Nov
2006
會 議 名 稱
The Tenth IEEE International Conference on Communication
Systems (ICCS 2006)
發 表 論 文 題 目
Time-of-day Internet Access Management: Virtual Pricing vs.
Quota Scheduling
一、
會議簡介
ICCS 會議是每兩年在新加坡舉辦一次有關通訊系統和工程方面的國際會議,今
年收到大量的論文投稿(自於 43 個國家總共約 480 篇的論文),經過嚴格的審核
過程,最後約有 200 篇左右的論文被接受。在這次會議期間亦舉辦了四個
tutorials,分別是 Iterative Receiver Design,Emerging Wireless Standards for WRAN,
WiFi, WiMedia and ZigBee,WiMax Systems and Mesh Networks 和 Wireless Sensor
Networks – Research vs Reality。
二、
參加會議經過
第 一天以一個 Keynote Speaker 的演講作為會議的開始,題目為 Universal
Communications – Towards Ubiquitous Network Society , 演 講 者 為 Shingo
OHMORI, Vice president, Member of the Board National Institute of Information and
Communication Technology (NICT)。印象頗為深刻的部份為演講者播放一段未來
日常生活跟網路結合的影片。生活所遭遇到的各種問題,均可由各種網路的相連
而得到解決,帶給人類便利的生活。接下來即為各領域的報告,學生參與研究相
關的網路資源管理(Network Resource Management)的 Session,一方面聽取他
人的新研究方向,另一方面報告亦報告自己的研究,發表過程中聽眾發問的相當
踴躍,學生於報告結束後與在 Institute for Infocomm Research 工作的研究學者有
充分的討論和交換資訊。
三、
與會心得
雖然有近 200 的論文的作者需要與會發表,但第一天 Keynote Speaker 的演講參
與程度並非相當熱烈,頗為遺憾。此外,由此次參與新加坡的 ICCS2006 會議中,
可窺見國際化的視野對學術界的重要性,並深深感覺到英文聽力的重要,尤其是
須適應不同人種的英文口音。
四、
攜回資料名稱及內容
1. FINAL PROGRAM in a book.
2. PROCEEDINGS in a CD
出席國際會議報告書
報 告 人 姓 名
張時中
所屬系所
電機工程學系
會 議 時 間 地 點
Century Hyatt Tokyo, Japan. Monday, September 25 –
Wednesday, September 27, 2006
會 議 名 稱
INTERNATIONAL SYMPOSIUM ON SEMICONDUCTOR
MANUFACTURING (ISSM 2006)
發 表 論 文 題 目
1. Priority X-Factor Modeling for Differentiated Manufacturing
Service Planning
2. Priority Behavior Modeling of Fab for Supply Chain
Management
五、
會議簡介
ISSM is the industry's largest forum of semiconductor manufacturing professionals
dedicated to sharing technical solutions and opinions on the advancement of
manufacturing science. The highlight topics of ISSM 2006 include, process control
maturation, application of Taguchi Method, DFM-total optimization for 65nm and
beyond, systematic productivity improvement, fab extendibility and flexibility,
application-specific semiconductor manufacturing, SiP, 3D modules, Environmental
and safety, nanometer-level contamination control, challenges for 450mm fab, and
new business model to meet with time-to-market. The Society of Applied Physics of
Japan, IEEE Electron Devices Society, and Semiconductor Equipment and Materials
International (SEMI) offer ISSM as a forum to broaden semiconductor manufacturing
knowledge.
六、
參加會議經過
Shi-Chung Chang served as a technical program committee member, presented
one oral session paper in the 09/25 afternoon session of Manufacturing control and
one poster session paper in the afternoon of 09/26, and served as a session chair. The
program attended is attached below.
Shi-Chung Chang met the new TPC chair, Mr.
Thomas Sounderman about ISSM2007.
Factory Design (FD)
Manufacturing Control and Execution (MC) Manufacturing Strategy and Structure (MS) Process Control and Monitoring (PC) Process and Metrology Equipment (PE) Yield Enhancement Methodology (YE) Ultraclean Technology (UC)
Environment, Safety and Health (ES) Process and Material Optimization (PO) Final Manufacturing (FM)
Robust Engineering (RE)
七、
與會心得
Researchers from Taiwan continue to show a strong presence in ISSM. Design for
manufacturing (DFM) and Supply Chain Management have gain significant growth in
attendees’
interest.
Industrial participation from Taiwan was largely from TSMC.
八、
攜回資料名稱及內容
Priority X-Factor Modeling for Differentiated Manufacturing
Service Planning
Shi-Chung Chang Ke-Ju Chen
[email protected] [email protected]
Dept. of Electrical Engineering, National Taiwan University, Taipei, Taiwan, ROC, 10617 Phone: +886 –2 –2362-5187 Fax: +886 –2 –2363-8247
Abstract –This paper addresses the X-factor modeling needs in fab capacity and release rate planning for differentiated manufacturing service provision. A priority X-Factor constrained planning problem is first formulated that describes the relation among profit, release rates of individual priorities, and capacity utilization. Modeling priority X-factors is key to the formulation. We deign a novel M/G/1:PR queue approximation-based network modeling methodology to capture in a scalable way how operation priority, production flow variations, and capacity utilizations may affect individual PXFs of overall fab and tool groups. Numerical studies demonstrate the potential applications of our PXF models.
I. INTRODUCTION
Effective provision of manufacturing services in
multiple priority levels has been one critical aspect
to the competitiveness of wafer fabs.
A customer
order with a higher priority level demands a shorter
cycle time than orders of a lower priority.
Wafers
of lower priority orders have elongated cycle times
because they need to wait in line until wafers of
higher priority orders finish processing. Machine
capacity loss may occur when processing a high
priority order by a batching machine without
requiring a full load policy.
Priority mix
percentage significantly affects the variations of
fab performance such as throughput, cycle time,
wafer-in-process (WIP) and bottleneck location
[1].
Among the many fab performance indices, cycle
time has a significant impact on productivity
learning and customer serviceability.
There is a
basic relationship among capacity utilization (U),
throughput (T) and cycle time [2].
The cycle time
of a fab increases exponentially with the increase
of U/T when U/T goes beyond a high level, say,
90%, while it is proportional to U/T at a lower
level.
To measure and manage cycle times, the
notion of X-factor (XF),
where
XF = cycle time/raw processing time (RPT)
has been introduced
to provide a sensitive
performance indicator and is standardized across
different products [3].
It has been shown that many fab opration problems
can be effectively identified through the analysis of
X-factors. Customized X-factor targets can be set
for short cycle time manufacturing (SCM) that not
only allow the performance differentiation among
toolsets
of
different
characteristics
but
also
guarantee the overall fab objective [3-6].
In production planning of a fab, there are different
XF target (XFT) specifications for individual
priority levels of manufacturing services [7].
The
XF of each priority (PXF) is a function of release
rates
of
individual
priorities
and
the
total
utilization of the bottleneck tool group, which we
shall refer to as a PXF behavior model.
Note that
different XFs require different levels of resources
and
hence
lead
to
different
costs
and
manufacturing services of different XFTs should
be priced differently.
Given a pricing policy,
capacity cost structure, and a set of XFT, a PXFT
constrained
production
planning
decides
the
priority mix (or wafer release rats) of products in
individual manufacturing service priorities for
profit maximization subject to machine capacity
and PXFT constraints.
Key to this planning
problem
is
the
behavior
modeling
of
the
relationship between PXF and priority mix and
capacity utilizations.
Motivated by the problem of PXFT constrained
production planning.
In this paper, we design and
develop an M/G/1:PR queue approximation-based
network modeling methodology with a focus on
capturing how operation priority,
production
flow variations, and capacity utilizations may
affect individual PXFs of a fab. The M/G/1:PR
queue model is adopted
to model the behavior of
a service node (tool group). On top of the single
node model,
we derive a PXF contribution theory
that relates PXFs of individual service nodes to the
overall fab PXF and provides a novel priority
network model. Model fitting is then adopted to fit
the M/G/1:PR-based approximation to empirical
fab data. The key idea of fitting is to add a
parameter in calculating the mean residual service
time, which compensates, for each priority,
the
ISSM2006
MC- 231
effect of arrival process variation to the mean
service time at a node. Figure 1 depicts the
concept.
The remainder of the paper is organized as follows.
Section II gives a problem formulation of PXFT
constrained production planning and identify the
need for a PXF behavior model.
Section
III
then presents the M/G/1:PR queue approximation
and priority contribution theory-based network
modeling methodology.
Model analysis and
applications are given in Section IV.
Finally,
Section V concludes the paper.
II.
PRIORITY
X-FACTOR
CONSTRAINED
PLANNING
Consider a fab with a given set of prespecified
PXFTs for individual priorities that need to be
achieved by fab operations. Prices and WIP costs
of individual priorities and capacity costs are also
given.
A fab manager can control XFs of the fab,
individual stages and priorities at each stage by
adjusting priority mix and utilization levels while
maximizing the profit.
To formulate the XF constrained planning problem,
let us first define some notations, where we assume
for simplicity of discussions that there is only one
type of products in each priority.
Notations
ij
XF
: X-Factor of j-th priority product at processing
step i;
j
: Mean release rate of jth priority product;
ij
: Mean service time of a jth priority wafer at step
i;
j
RPT
: Average processing time of a wafer at step i;
[ ij]Var S
: Variance of service time of jth priority at
step i;
ij
: Utilization of jth priority product in step i;
jP
:
Per wafer price of jth priority;
Mj
c
: Per wafer manufacturing cost of jth priority;
I ij
c
: Per wafer and per unit time WIP cost of jth
priority at ith step.
The revenue rate of manufacturing wafers of one
priority comes from its offered price and wafer
release rate of the priority, while the WIP cost at a
step is proportional to the release rate and cycle
time at the step and the capcity cost is proportional
to the release rate. In deciding on the release rates
or
mi
x
of
i
ndi
vi
dua
l
pr
i
or
i
t
i
e
s
t
o
ma
xi
mi
ze
one
’
s
manufacturing profit,
a fab manager must
consider constraints of capacity and PXF targets.
A
PXFT
constrained
planning
problem
is
formulated as follows:
Pr_ ( , 2 2 _ [ ( ) ({ }, )] [ ( )] ({ }) ; ({ }) , ; and { } j j j ij j j I M j j j j ij ij j j j j fab j j p f p j j ij s i j jMax J Revenue Cost XF
P c XF c subject to XFT XFT j
) tool group Pr_ , ;with targets , { , } and capacity { , } given.
m uses m fab j m C m XFT XFT j C m
In the formulation, function
p f2respresents a
model of the relationship beween priority release
rates and XF of the wole fab while function
2 _
p s j
respresents a model of the relationship
beween priority release rates and the XF of priority
j at a step s.
These functions have to be
constructed for PXFT constrained planning.
III. MODELING PRIORITY X-FACTORS
Exploiting available closed-form results, we first
adopt a M/G/1:PR queueing approximation to
model the PXF of a service node (tool group).
As
the Poisson arrival assumption of the M/G/1:PR
model may not be a good approximation, the
model needs to be modified for a closer match to
fab data.
Network relationship among nodes is
then needed for modeling fabwide PXF of each
priority based on nodal models.
Our modeling
approach is described as follows.
III.1 Single Node Model: M/G/1:PR approximation
Key to the fab PXF behavior model
i
s
t
he
single-node
priority
behavior
modeling.
We
modified the M/G/1:PR results of [8] by adding a
compensation parameter
jto account for the
variance of a general, non-Poisson arrival process.
The approximation model of XF for priority j is
then
2 _ 2 1 1 1 1 ({ }) 1 ( [ ] ) 1 2 1, (1 )(1 ) j p s j k J k k k k j j j k k k i j XF Var S
where
j ij i
and
j j j.properties
of
the
modified
M/G/1:
PR
approximation over a two-priority service node
example, where wafer processing requirements are
the same for both priority. Model data setting
refers to that provided by ITRS [7]. There is not
much difference in PXF of priority-1 when
priority-1 mix varies in the low percentage range
of 1-10%.
Note that under a fixed mix percentage,
the PXF of priority-1 increases almost linearly
with respect to overall capacity utilization while
the PXF of priority-2 increases drastically when
utilization is higher than 90%.
The lower priority
is much more sensitive to capacity utilization and
priority mix than the higher priority.
II.2 Priority XF Contribution Theory
In [3], D.P. Martin derived a contribution theory
that
describes
the
contribution
by
XFs
of
individual processing step/tools to fab XF as
following:
_ 2 } ) I f a b s t e p i i = 1 I i i i = 1 f a b s f i i X F X F C o n t r i b u t i o n R P T = X F R P T = ( { R P T , X F
where
ij ijRPT
and
s f2respresents
the
relationship beween XF at a tool group to fab XF.
In this paper, we exploit the relationship between
total queue size and queue sizes of individual
priorities, the relation between total cycle time and
cycle times of individual priorities, and Little’
s
formula, to obtain the contribution by XFs of
individual priorities to the XF of step i as
1 J i i i 2 ij =1 i =1 i ( ) WL = (WL ) ( XF ) WL wher relative utilizat e WL i n . o m j j j j j p s m j j j j j i i j j XF XF XF
We then obtain the contribution by XFs of
individual priorities to fab XF:
2 _ 2 _ _ ) ) p f j p f j j I stage i ij ij ij m i=1 fab ij j=1 XF = ( RPT WL = XF (WL RPT WL
The Priority XF contribution theory above assumes
given PXF behavior models at individual nodes in
a fab.
Figure 2 shows the relationship among
PXFs in the behavior model.
IV.
APPLICATIONS
OF PXF MODEL TO
PLANNING
Construction of the PXF behavior model completes
the PXF target constrained production planning
problem. Figures 5 gives results of numerical
studies of the planning problem.
The same
two-priority example for Figures 3 and 4 is
examined,
where
release
rate
of
individual
priorities are changed. Figure 5 shows that profit
increases with capacity utilization under different
priority mixes (PM). Under the given PXFTs, there
is a maximum profit level among various mixes for
each utilization level as indicated by a red solid
curve in Figure 5.
Our analysis show that the XF
of the lower priority is very sensitive to slight
variation of higher priority relase rate. When the
bottleneck capacity utilization goes beyond 82% in
this example, the WIP cost of the lower priority
surpassses the gain in revenue and the maximum
profit drops.
We further apply the model to
address the following two questions.
Q1: How total utilization should be adjusted with
respect to PM change under given PXF
targets?
Optimization tools can be applied to compute
optimal capacity allocations and release rates of
individual priorities.
A fab manager may also
utilize PXF charts for decision-making.
For
example, consider Figures 2 and 3 as fab models
with priority-1 at 10% and the total capacity
utilization at 90%.
If there is a new order
demanding an increase of priority-1 to 20% with
bottleneck capacity
still at 90% utilization, then
PXF1 = 1.34 and PXF2 = 3.58 and profit increases
2.86% from Figure 5.
To maintain PXF1<1.3 and
PXF2<3.2, the fab manager may want to reduce
the fab utilization to 84% so that PXF targets are
achieved at a price of 3.8% total profit decrease. In
this case, the tradeoff is between the revenue gain
from increase in high priority orders and the loss in
reducing low priority wafer release. Besides
capacity reduction, one may want to increase the
price of priority 1 to recover profit loss in priority
2.
So, the model also provides a link for pricing
consideration.
Q2: How to find cycle time bottleneck of tool
groups?
A two-priority, say P1 and P2,
experiment is
designed
for
investigation.
The
numbers
of
operation steps of P1 and P2 products are 32 and
60, respectively. There are 12 service nodes (tool
groups). Release processes of the two priority
wafers are Poisson while service time distributions
contain
uniform,
erlang-k
and
exponential
distributions. This example basically follows that
in [9].
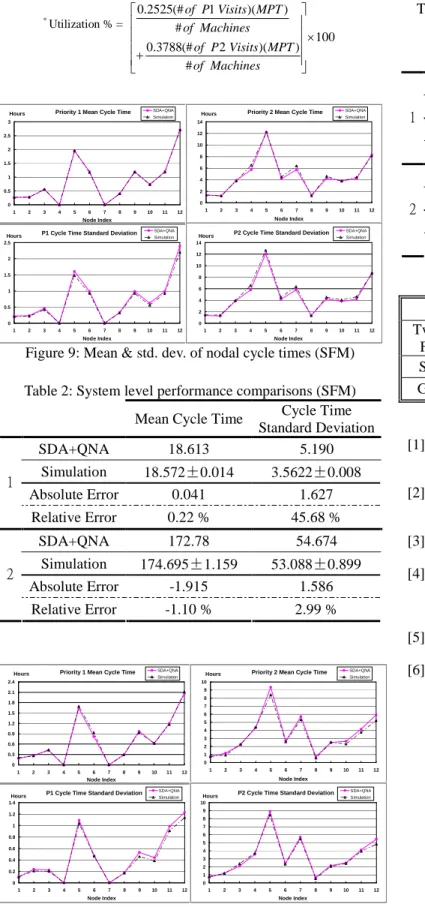
Figures 6 and 7 show comparisons of XFs between
simulation
results
and
M/G/1:
PR
+
PXF
contribution theory for priority 1and 2 under 12
tool groups with different service time distribution.
Table 1 shows the error percentages of each tool
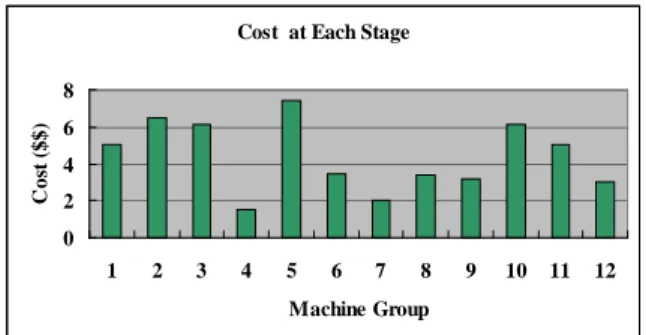
group. Figure 8 shows XF contributions of each
node to fab XF and we can identify that tool group
5 is the cycle time bottleneck but the capacity
bottleneck is tool group 3.
V. CONCLUSIONS
In this paper, we have designed and developed an
M/G/1:PR queue approximation-based network
modeling
methodology.
The
PXF
models
obtained
captures
how
operation
priority,
production
flow
variations,
and
capacity
utilizations may affect individual PXFs of a fab.
We have also demonstrated good application
potential of these models to the planning of priority
manufacturing services..
Figure 1: PXF model fitting
Priority mix Stage 1 Stage n Fab XF Targets P _ Pr_m r 1 XF XF _ 1 _ s ta g e s ta g e n X F X F fab XF
Red: High priority Green: low priority
Figure 2: the architecture of the Fab behavior mode
X-Factor of Priority 1 & Utilization
1 1.08 1.16 1.24 1.32 1.4 1.48 1.56 1.64 1.72 1.8 67.0% 72.0% 77.0% 82.0% 87.0% 92.0% 97.0% Utilization of system X -F a ct o r PM=50% PM=35% PM=20% PM=10% PM=7% PM=5% PM=3% PM=1%
Figure 3: Relation between PXF and utilization for
priority 1
X-Factor of Priority 2 & Utilization
1 4 7 10 13 16 19 22 25 28 67.0% 72.0% 77.0% 82.0% 87.0% 92.0% 97.0% Utilization of system X -F a c to r PM=50% PM=35% PM=20% PM=10% PM=7% PM=5% PM=3% PM=1%
Figure 4: Relation between XF and utilization for
priority 2
Profit Curve at each Priority Mix Level
100 110 120 130 140 150 160 170 180 190 200 68% 71% 74% 77% 80% 83% 86% 89% 92% 95% 98% Utilization P ro fi t PM = 1% PM = 3% PM = 5% PM = 7% PM = 10% PM = 20% PM = 35% XF Target Limit
Figure 5: Relation between Profit and utilization
under different priority mix
Priority 1 X-Factor 0 0.5 1 1.5 2 2.5 3 1 2 3 4 5 6 7 8 9 10 11 12 Machine group X -F a ct o r (MG1+PXFC) Simulation
Figure 6: Comparison of X Factor between
Simulation and MG1+PXFC for priority 1
Priority 2 X-Factor 0 2 4 6 8 10 12 14 1 2 3 4 5 6 7 8 9 10 11 12 Machine group X -F a ct o r MG1+PXFC Simulation
Simulation and MG1+PXFC for priority 2
XF contribution at each MG 0 0.1 0.2 0.3 0.4 0.5 0.6 0.7 0.8 0.9 1 1 2 3 4 5 6 7 8 9 10 11 12 Machine group X F co n tr ib u ti o nFigure 8: XF contributions of each node to fab XF
Cost at Each Stage
0 2 4 6 8 1 2 3 4 5 6 7 8 9 10 11 12 Machine Group C o st ($ $ )
Figure 9: Cost at each node
ACKNOWLEDGEMENT
* This work was supported in part by the Semiconductor Research Corporation and International Semiconductor Manufacturing Initiative under FORCe-II project 1214 and by the National Science Council, Taiwan, ROC, under grants NSC-93-2213-E-002-043 and 94-2213-E-002-015
REFERENCES
[1]Amy H.I. Lee, He-Yau Kang, Wen-Pai Wang “Analysis of
priority mix planning for the fabrication of semiconductors
under uncertainty,”Int. J. Adv. Manuf. Tech. (2006) 28:
351–361.
[2] W. Hopp, M. Spearman, Factory Physics, 2nded., MacGraw-Hill
Higher Education, 2000.
[3] D. P. Martin,”The Advantage of Using Short Cycle Time Manufacturing (SMC) Instead of Continuous Flow Manufacturing (CFM),”Proc. of ASMC, 1998, pp.89-94. [4] Y.Narahariand L.M.Khan”Modeling the Effect of Hot Lots in
Semiconductor Manufacturing Systems,”IEEE Transactions on Semiconductor Manufacturing, vol. 10, no.1, Februnary 1997.
[5] M. Kishimoto, K. Ozawa, K. Watanabe, and D. Martin, “Optimized Operationsby Extended X-Factor Theory Including Unit Hours Concept”IEEE Transactions on Semiconductor
Manufacturing, vol. 14, no. 3, Aug. 2001.
[6] J. Robinson and F. Chance,”Dynamic X-Factor application for Optimizing Lot Control for Agile Manufacturing,”Proceedings of ISSM, Tokyo, Oct. 2002.
[7] International Technology Roadmap for Semiconductors 2005
edition, Factory Integartion, http://www.itrs.net/reports.html.
[8] J. Virtamo,” 38.143 Queueing Theory / Priority queues,” Helsinki University of Technology, Fall 2001.
[9] Ming-Der Hu and S.C. Chang, “Translating Delivery Specifications into Distributed Flow Control Requirements for Re-entrant Production Lines”PhD dissertation, EE, NTU 2000.
Priority Behavior Modeling of Fab for Supply Chain Management
*
Shi-Chung Chang Bo-Jiun Liao Argon Chen [email protected] [email protected] [email protected]
Graduate Institute of Industrial Engineering, National Taiwan University No.1, Sec. 4, Roosevelt Rd., Taipei, Taiwan 10617
Phone: +886 -223625187 Fax: +886-23638247
Abstract–This paper develops modeling methods and fab behavior models with predictability and scalability to capture variability and manufacturing service differentiation in semiconductor supply chain management. A novel, hybrid decomposition approximation-based priority queueing network model is designed for fab behavior modeling. The model characterizes the relationship between output performance metrics of cycle time, wafer-in-process, throughput, and capacity utilization and input factors of priority mix, wafer release, capacity allocation and machine characteristics. Model evaluation results over some fab
models demonstrate that the hybrid decomposition
approximation-based network model yields very quick and good quality estimations of mean and variability of tool group and fab performance metrics.
I. INTRODUCTION
A supply chain is a system of nodes that provides manufacturing services—in fact, a variety of services. Services differentiation, namely, prioritization, is common in operations of semiconductor supply chains (SSC, Figure 1). It affects how to allocate resources and charge prices. Such a new paradigm of manufacturing services requires new methods of operation control. The grand challenges will be scalability and predictability with respect to differentiation of services and variability that are exacerbated by rapidly increasing product varieties and process variations in the chains.
To provide service with differentiable ensures that the quality of service (QoS), allocation of manufacturing capacity and pricing of services have to be dependent of and differentiated by QoS requirements. Product, process and operation variability affects the performance of individual service nodes such as tool groups and fabs and chains/networks of service nodes. In order to predict the behavior of the SSC that provide differentiated services, research is needed in follow aspects: predictable and scalable performance metrics with respect to the chain structure, and fundamental understanding of the behavior of service nodes and chains under variability. Among the SSC service nodes, fab is the most expensive, complicated, and important. So this study is aimed at the behavior modeling of a fab and provides a cornerstone model for supply chain management. In behavior modeling, the output performance metrics consist of cycle time, wafer-in-process (WIP), throughput, and capacity utilization. And input options to a fab include priority mix, wafer release, capacity allocation and machine characteristics. The behavior model describes the relationship between output performance metrics and inputs, which are characterized by not only mean
values but also variability.
In this paper, we develop behavior models and modeling methods that enhance the scalability and predictability of the semiconductor supply chains with respect to varieties, and differentiability of services. We aim at fab behavior modeling that provides a cornerstone model for SSC management. The network-based fab behavior models describe how priority, resource allocation and sources of variations affect fab performance metrics such as mean and variability of cycle time, wafer-in-process, throughputs, and machine utilizations as shown in Figure 2. The input/output relationship of a fab will be modeled as a network of priority service nodes [1]. Such a priority network captures factors and effects of variations throughout the network model. The model is scalable and allows chain/network performance metrics to be decomposed into per node and per priority metrics. It has also predictability that allows very quick evaluation of mean and variability of both nodal and system output performance metrics with various priority input options.
II. FAB BEHAVIOR MODELING BY HYBRID DECOMPOSITION OF PRIORITY NETWORK Consider a fab with multiple part priorities, failure prone machines, and re-entrant process flows. We model the fab as a failure-free, batch-free, deterministic-feedback and priority open queueing network (OQN) [4]. Then we design and develop an innovative, hybrid decomposition approximation-based approach for such a priority OQN with a focus on capturing operation priority and variations in a fab.
Key ingredients of the hybrid decomposition approach for modeling a priority fab OQN are as follows:
1. Decompose the fab network into many independent service nodes and their networking relationship by adopting the decomposition approximation of queueing network analyzer (QNA, [3]).
2. Model single service node behavior by sequential decomposition approximation (SDA) of coupling interactions among priorities in one node ([2], Figure 3;
3. Combine the networking relationship among service nodes with a fixed point iteration to approximate re-entrant flow line performance.
More details will be given in the following subsections.
II.1 Nodal Model: Sequential Priority Decomposition
The behavior modeling of priority single service node provides a cornerstone for the fab behavior modeling. We develop the nodal behavior model with priority by treating each service node independently as a GI/G/1 non-preemptive