國 立 交 通 大 學
資訊工程研究所
博士論文
都會區交通路網整體效能提升之研究
A Study of Enhancing the Global Traffic Network
Performance for Urban Network
研究生:李威勳
指導教授:曾憲雄 博士
都會區交通路網整體效能提升之研究
A Study of Enhancing the Global Traffic Network Performance for
Urban Network
研究生:李威勳 Student:
Wei-Hsun
Lee
指導教授:曾憲雄 博士 Advisor:
Dr.
Shian-Shyong
Tseng
國 立 交 通 大 學
資訊學院 資訊工程學系
博 士 論 文
A Dissertation
Submitted to Department of Computer Science
College of Computer Science
National Chiao Tung University
in partial Fulfillment of the Requirements
for the Degree of
Doctor of Philosophy
in
Computer Science
July 2009
Hsinchu, Taiwan, Republic of China
I
A Study of Enhancing the Global Traffic Network
Performance for Urban Network
Student: Wei-Hsun Lee Advisor: Dr. Shian-Shyong Tseng Department of Computer Science
College of Computer Science National Chiao Tung University
Abstract
Global traffic network performance enhancement is one of the critical issues for the urban network administration since traffic congestion has been increasing world-wide as a result of increased motorization, urbanization, population growth and changes in population density, especially in urban network. Network administrators try to enhance the traffic network performance by overall considering all the related issues including current network traffic status, traffic demands, historical traffic patterns, traffic bottlenecks, and predicted traffic status. However, difficulties and issues are raised in traditional Dynamic Traffic Assignment (DTA) models, including traffic demand dynamics, network complexity, spatiotemporal traffic bottlenecks, lack of traffic event consideration, and network topologies evolvement problem.
In this dissertation, a traffic knowledge framework is proposed for enhancing the traffic network performance by considering four major factors including decreasing the traffic demand, discovering Spatiotemporal Traffic Patterns (STPs) and identifying the Spatiotemporal Traffic Bottlenecks (STBs), resolving the traffic bottlenecks, and creating a collaborative traffic information generation and sharing framework. There are four phases in the propose framework, which are traffic information generation, heterogeneous traffic
II
information fusion, traffic knowledge extraction and traffic information applications. Two real-time traffic information collection schemes are proposed including traffic information derived from the LBS-based applications and collaborative traffic information generation and sharing framework. All the collected traffic information is kept in the Traffic Information Database (TIDB), from which STPs as well as STBs are mined by spatiotemporal data mining techniques. The discovered traffic knowledge is applied to travel time prediction system and Advanced Traffic Management System (ATMS) decision support system, where the former assists the travelers to select the shortest travel time path, and the latter provides traffic assignment suggestions to network administrators for enhancing traffic network performance. Knowledge based system technique is adopted for these two applications with pre-designed domain knowledge ontologies obtained from the domain experts. The collected as well as predicted traffic information, events, network topologies, constraints are regarded as the facts in the inference engine.
The contributions of this work can be summarized as: a traffic information and knowledge framework is built for the ground works of ITS, several hypothesis based spatiotemporal data mining methods are proposed for discovering STP/STB, the proposed travel time prediction system outperforms the real-time predictor as well as the historical predictor, the proposed ATMS decision support system is tractable to apply to real urban network comparing to traditional DTA-based approaches, and the knowledge base is continuously incremental updated to get more precise rules.
Keywords: intelligent transportation system (ITS), spatiotemporal data mining,
spatiotemporal traffic patterns, spatiotemporal traffic bottlenecks, advanced traffic management system (ATMS)
III
摘要
由於車輛機動化、都市化、人口增加與人口密度提高的趨勢,導致都會區交通路網 的壅塞成為世界性的趨勢,交通網路整體效能的提升是交通管理中心的關鍵性任務,交 管中心管理者在考量交通需求、交通狀態、歷史資料、交通瓶頸點與預測資料等全盤狀 況之後,做出提升整體交通路網效能的決策。然而以傳統的動態交通指派模型(DTA)方 法,要提升整體交通路網效能卻可能面對許多的困難,包含交通需求的變化、路網的複 雜度、時空變化的交通瓶頸點、缺乏事件應變機制、路網變更須重新定義模型等等問題。 在本論文中提出了一個以提升整體交通路網效能為目的的交通知識框架,考量了數 個可以改善交通路網效能的要素,包含建立協同式的交通資訊產生與分享的架構、減低 交通旅次需求、找出時空變化交通樣式(STP)與時空變化交通瓶頸點(STB)、利用系統找 出的交通知識與專家提供的知識來改善交通路網的效能。此框架分成了交通資訊收集與 產生、異質交通資訊的融合、交通知識的萃取與交通管理的應用等四個階段,在論文中 提出了兩種即時交通資訊收集的方式,包含從車輛定位應用服務(LBS)資料中分析出交 通資訊,與協同式交通資訊產生與分享架構,所收集到的交通資訊存放在交通資訊資料 庫(TIDB)中,做為以時空資料探勘技術找出各種時空交通樣式(STP)與時空交通瓶頸點 (STB)的資料源。在本論文中,我們將這些交通資訊與從這些資訊中找出的相關交通知 識應用到兩個系統: 旅程時間預測系統與先進交通管理支援決策系統,前者提供用路人 最短旅程時間路徑的資訊,後者提供路網管理中心有關於提升交通路網效能的交通指派 建議。這兩個應用系統都採取了知識庫系統的技術,推論引擎中的推論法則(Rule)是由IV 領域專家協助設計的知識本體論以及發掘的交通知識(STP/STB)所轉換而來,而推論所 需要的事實(Facts)則包含了系統收集到即時交通資訊與事件、預測的交通資訊、路網架 構資訊與交通法規限制等等。 本研究的貢獻簡單彙整如下:一、建立一個交通資訊與知識的系統框架,為進一步發 展智慧型運輸系統的基礎工程;二、提出數個以時空資料探勘方式找出時空交通樣式與 交通瓶頸點的方法;三、提出的動態混合式旅程時間預測方法,其精準度比即時資料旅 程時間預測與歷史資料旅程時間預測方法都來的高;四、以知識庫方法實現的交通管理決 策系統比傳統的交通指派方法更容易實現在都會區路網上,並且系統可以持續更新知識 庫以得到更精準的推論法則。 關鍵字: 智慧型運輸系統(ITS), 時空資料探勘, 時空交通樣式, 時空交通瓶頸點,先進交 通管理系統(ATMS)
V
誌謝
本篇論文能夠順利完成付梓,最要感謝的當然是指導老師曾憲雄教授,老師嚴謹的治學 態度與啟發式的指導,培養了我獨立思考、解決問題的能力,並得以領略學術研究的奧 妙,本論文在研究方面若能有所突破與創新,都要歸功於 曾教授對教育理念的堅持及 在學術研究的創見。同時也要感謝從論文研究計畫書審查、校內口試到最後口試一路給 予我許多論文修改建議的 卓訓榮教授與 孫春在教授,讓我重新檢視本論文的研究貢 獻。還有感謝在口試中, 郭耀煌教授、 洪宗貝教授、 鄭伯順教授與 張光耀教授所提 出的寶貴意見,對於論文方法與結果呈現,給於精闢的見解與指導,並且指正論文的缺 失,讓此論文最後的成果能夠更加完整並增加整體論文的可讀性。 在不惑之年,能夠以在職的身份順利的完成學業,要感謝任職單位中華電信研究所的許 多長官栽培與同仁的支持,特別是主管王景弘博士與繆嘉新博士的栽培與指教,使得此 論文研究能夠順利進行。另外也要感謝知識工程實驗室的眾多夥伴,蘇董、慶堯、順傑、 衍旭、哲青、瑞鋒、宗儒、元昕與眾多同門師兄弟們,一起做研究討論讓彼此的研究能 夠更為精進,當然也要感謝和我一起做研究的學弟妹,昇翰、曉涵,沒有你們努力做實 驗,論文與期刊的可看性就不會這麼完整,謝謝! 最要感謝的當然是家人一路的支持,謹將本論文獻給在天上的父親、在嘉義的母親、親 愛的老婆惠瑜、可愛的女兒宜臻,以及眾親友,並且感謝每一個幫助過我、支持我的夥 伴。 李威勳 謹誌 2009 年 7 月於桃園楊梅VI
Table of Contents
Abstract ... I 摘要 ... III 誌謝 ... V Table of Contents ... VI List of Figures ... VIII List of Tables ... X List of Algorithms ... XI
Chapter 1 Introduction ... 1
1.1 Problems in traffic network performance enhancement... 1
1.2 Major factors in global traffic network performance enhancement ... 5
1.3 Reader’s guide ... 8
Chapter 2 Related Works ... 14
2.1 Traffic data collection and traffic state recognition ... 14
2.2 Traffic patterns mining and traffic bottlenecks discovering ... 15
2.3 Dynamic traffic assignment (DTA) ... 16
2.4 Travel time prediction (TTP) ... 16
Chapter 3 Traffic Information Generated from LBS-based Applications ... 19
3.1 Location-based service (LBS) ... 19
3.2 Data collection and cleansing ... 21
3.3 Traffic information generation ... 23
Chapter 4 Collaborative Traffic Information Generation and Sharing Framework ... 31
4.1 Architecture of the framework ... 33
4.2 Smart traffic agent (STA) ... 34
4.3 Multi-sources heterogeneous traffic information fusion ... 37
VII
Chapter 5 Spatiotemporal Traffic Patterns Mining ... 43
5.1 Object level traffic patterns mining ... 43
5.2 Spatial heuristic clustering (SHC) ... 49
5.3 Area level traffic patterns mining ... 51
Chapter 6 Spatiotemporal Traffic Bottlenecks Discovering ... 56
6.1 Spatiotemporal traffic bottlenecks (STB)... 56
6.2 Congestion area sequence rule (CASR) ... 57
6.3 Heuristics for discovering STB ... 58
6.4 Experiment ... 60
Chapter 7 Application: Real-time Travel Time Prediction ... 66
7.1 Architecture of TTP system ... 67
7.2 Dynamic weighted combination TTP scheme ... 68
7.3 Ontology for travel time prediction ... 71
7.4 Knowledge based TTP ... 76
7.5 TTP prototype system ... 80
7.6 Experiment ... 83
Chapter 8 Application: Decision Support System for Global Traffic Network Performance Enhancement ... 86
8.1 System architecture ... 87
8.2 Hierarchical three-layer traffic assignment principles ... 89
8.3 ATMS ontology ... 96
Chapter 9 Conclusions and Future Works ... 99
9.1 Conclusions ... 99
9.2 Future works ... 104
References ... 106
Appendix A: Design and Implementation of a Vehicle-Positioning Based Electronic Toll Collection System ... 115
A.1 Introduction ... 115
A.2 VPS system background and related works ... 117
A.3 VPS system architecture ... 119
A.3 VPS components design ... 122
A.5 Unit Test and Field Test ... 130
VIII
List of Figures
FIGURE 3‐1 COMPONENTS OF LBS APPLICATION 20 FIGURE 3‐2 EXAMPLES OF THREE CONTINUOUS TNSS (FROM 7AM~7:30AM) 26 FIGURE 3‐3 INTERSECTION DELAY EXAMPLE: RTD 29 FIGURE 4‐1 COLLABORATIVE TRAFFIC INFORMATION GENERATION AND DISTRIBUTION FRAMEWORK 34 FIGURE 4‐2 TIC REAL‐TIME AND PREDICTIVE TRAFFIC INFORMATION RESPONSE MESSAGE 36 FIGURE 4‐3 USER CENTRIC TRAFFIC STATUS REACTION USER INTERFACE IN STA 36 FIGURE 4‐4 DESIGN ONTOLOGY FOR THE TRAFFIC STATUS PREDICTION KNOWLEDGE BASED SYSTEM 40 FIGURE 5‐1 CONGESTION DROP PATTERN CONCEPT 47 FIGURE 5‐2 INTERSECTION DELAY EXAMPLE: RTD 48 FIGURE 5‐3 EXAMPLE OF CPP DISCOVERING ALGORITHM 51 FIGURE 5‐4 DCP: MOST LIKELY EXISTING STB IN THE SPATIAL CROSS DEMAND OF TWO CPPS (BLACK DOTTED CIRCLE AREA) 54 FIGURE 5‐5 (A) CROSS CONFLICT DELAY, (B) LEFT TURN INTERLACED DELAY 55 FIGURE 6‐1 CONGESTION PROPAGATION HEURISTIC FOR DISCOVERING STB 59 FIGURE 6‐2 CONGESTION CONVERGE HEURISTIC FOR DISCOVERING STB 60 FIGURE 6‐3 ROAD NETWORK IN TAIPEI URBAN AREA 61 FIGURE 6‐4 TRAFFIC INDEX FACTOR (Θ) FOR WORKDAY AND WEEKEND 62 FIGURE 6‐5 THREE HEURISTIC METHODS COMPARED TO COI METHOD IN WORKDAY 63 FIGURE 6‐6 THREE HEURISTIC METHODS COMPARED TO COI METHOD IN WEEKEND 64 FIGURE 6‐7 STBS DISCOVERED BY CPH IN WORKDAY 65 FIGURE 7‐1 ARCHITECTURE OF TTP SYSTEM 67 FIGURE 7‐2 LINEAR COMBINATION OF REAL‐TIME AND HISTORICAL TRAVEL TIME PREDICTORS 69 FIGURE 7‐3 DESIGN ONTOLOGY OF THE TTP SYSTEM 72 FIGURE 7‐4 TRAVEL TIME PREDICTION INFERENCE WORKFLOW 73 FIGURE 7‐5 ROAD NETWORK IN TAIPEI URBAN AREA 81 FIGURE 8‐1 SYSTEM ARCHITECTURE OF ATMS DSS 88 FIGURE 8‐2 DEMAND CONFLICT PATTERN 92 FIGURE 8‐3 (A) COMPROMISED ON MAJOR REQUEST, (B) INCREASING THE TWO WAY LEF‐TURN GREEN TIME 93 FIGURE 8‐4 TRAFFIC SMOOTHING ASSIGNMENT FOR CONGESTION PROPAGATION PATTERN 94IX FIGURE 8‐5 SIGNAL CHAINING TRAFFIC SMOOTHING ASSIGNMENT 95 FIGURE 8‐6 INTERSECTION GIVE WAY SIGNAL CONTROL 96 FIGURE 8‐7 ONTOLOGY OF THE ATMS DSS 98 FIGURE 9‐1 THREE‐LAYER TRAFFIC KNOWLEDGE FRAMEWORK 101
X
List of Tables
TABLE 1‐1 COMPARISONS OF TRADITIONAL DTA MODELS WITH THIS STUDY 8 TABLE 1‐2 ABBREVIATIONS 10 TABLE 1‐3 NOTATIONS 12 TABLE 3‐1 SERVICE LEVEL CLASSIFICATION FOR THREE CATEGORIES OF ROAD IN TAIWAN 28 TABLE 7‐1 EXAMPLES OF THE DYNAMIC WEIGHT ASSIGNMENT META‐RULES 80 TABLE 7‐2 TTP PRECISION OF THREE PREDICTORS (BY IDPS) 84 TABLE 7‐3 TTP PRECISION OF THREE PREDICTORS (BY EXPERTISE IN ID) 84 TABLE 8‐1 HIERARCHICAL THREE‐LAYER TRAFFIC ASSIGNMENT PRINCIPLES 87 TABLE 8‐2 HIERARCHICAL KNOWLEDGE STRUCTURE IN ATMS DSS 89 TABLE 8‐3 SPATIOTEMPORAL TRAFFIC PATTERNS AND HANDLING STRATEGIES 90 TABLE A‐1 COMPARISONS OF THE TOLL SCHEME AND TECHNOLOGY IN PROGRESS [PRO00] 119 TABLE A‐2 INDICATORS AND DESCRIPTIONS OF OBU MAIN WINDOW 124 TABLE A‐3 MESSAGES PROTOCOL DEFINITION BETWEEN OBU AND BACKEND IN VPS 126 TABLE A‐4 FIRST FIELD TEST RESULT OF VPS DEBIT SYSTEM (IN THE VIEW OF VEHICLE) 135 TABLE A‐5 SECOND FIELD TEST RESULT OF VPS DEBIT SYSTEM (IN THE VIEW OF VEHICLE) 136 TABLE A‐6 FIELD TEST RESULT OF VPS DEBIT SYSTEM (IN THE VIEW OF TOLL STATION) 137 TABLE A‐7 ONLINE DEBIT TRANSACTION SUCCESSFUL RATE 139XI
List of Algorithms
ALGORITHM 5‐1 SPATIAL HEURISTIC CLUSTERING (SHC) ALGORITHM ... 50 ALGORITHM 5‐2 CPP PATTERNS MINING ALGORITHM ... 53
1
Chapter 1
Introduction
1.1 Problems in traffic network performance enhancement
Traffic congestion has been increasing world-wide as a result of increased motorization, urbanization, population growth and changes in population density, especially in urban network. Congestion reduces utilization of the transportation infrastructure and increases travel time, air pollution and fuel consumption, which may cause various social, environmental, and economic problems. Global traffic network performance enhancement has become more and more important, especially in the heavy traffic urban area. It is the common hope of all the participants in the traffic network and the major goal of the transportation department in the government. Advanced traffic management system (ATMS), targets at improving the efficiency of utilization of existing infrastructures and enhancing the global traffic network performance for the urban network, is one of the major topics in intelligent transportation system (ITS). The goal of an ATMS is to efficiently manage existing transportation resources in response to dynamic traffic conditions. In the traffic network, the transportation resources including traffic signal control, changeable message sign (CMS), reversible lane, or manual control, etc. can be properly managed to alleviate the congestions and improve global traffic network performance.
Traffic network consists of a set of network objects, each of which is either a link or an intersection. Congestions occur on some network objects by which the traffic demand cannot
2
be fully serviced. Thus traffic bottleneck can be defined as an object in traffic network where and when its capacity is less than the traffic demand. Traffic bottlenecks may be the root cause of neighborhood congestions; for example, a traffic bottleneck may generate a queue of vehicles propagated to the surrounding network objects, blocking intersections and result in congestion chaining. Most traffic congestions mainly result from traffic bottlenecks; therefore locating the traffic bottlenecks and taking appropriate actions to alleviate the congestions and improving the global performance of traffic network is major tasks of the network administrators. However, the traffic demand varies with spatial and temporal environments, so does the traffic bottleneck. In this work, spatiotemporal traffic bottleneck (STB) is defined and used instead of traffic bottleneck in order to clearly identify where and when the traffic congestion could occur. An STB is a traffic bottleneck with spatial as well as temporal identification, which indicates when and where a network object could be congested and may be the root cause of other neighborhood congestions.
In order to enhance the global traffic network performance for the urban network, real-time traffic information and historical traffic patterns are the essential information for the network administrators. Real-time traffic information plays an important role in several fields of ITS such as ATMS, advanced traveler information system (ATIS), commercial vehicle operation (CVO) and emergency management system (EMS). It is one of the most useful features especially when users are travelling outside, because real-time traffic information can assist and support travelers and drivers to plan the trip before travelling and make route choices decision during traveling in order to reduce the travel time and improve travelling safety. Besides, the traffic information also can support traffic management administrators to make decisions and take appropriate actions to alleviate the congestions and improve the global performance of traffic network. However, the availability of real-time traffic
3
information suffers from the cost, coverage, and real-time issues in the traditional data collection techniques, so compromised solution must be made among these considerations.
In this work, two real-time traffic information collection schemes are proposed, one is traffic information derived from the LBS-based applications, the other is traffic information collected from the collaborative traffic information generation and sharing framework. Comparing to the traditional sensor based or probing vehicle based traffic information collection system, it is cost effective because the traffic information is derived from the raw data of LBS-based applications and the smart traffic agents (STA) installed in the mobile devices (ex. mobile phone, personal navigation device). Moreover, the proposed traffic information collection schemes have the temporal as well as spatial coverage advantages because traffic information can be gathered from the STA and the LBS vehicles 24 hours per day in real time. By analyzing and mining the collected data, network traffic status as well as vehicle journey information can be generated.
Traditionally, traffic network performance enhancement is resolved by dynamic traffic assignment (DTA) model, which tries to achieve the goal of system optimal of the traffic network by regulating the traffic flow. However, DTA model is hardly practicable in urban network for several reasons: 1) complexity: traffic network in urban area is too complex to model and resolve by DTA, 2) traffic demand unavailable: DTA makes traffic assignment by the origin-destination (O-D) traffic demand analysis; however, the real O-D data is not cost-effectively available for the most traffic surveillance systems. Most DTA-based traffic network optimal assignment researches obtain the O-D data by assumption, estimation or simulation.
The difficulties for enhancing the global traffic network performance for the urban network can be summarized by the following issues.
4
1) Un-availability of sensor data in real-time
In traditional traffic data collection scheme, real-time traffic information is either unavailable or not able to be collected cost effectively. Both the sensor-based and the probing vehicle based traditionally traffic data collection schemes have the spatiotemporal coverage problem. The former suffers from the sensor coverage area, and the latter suffers from the quantity and temporal coverage (working hours) of the probing vehicles.
2) Spatiotemporal dynamics in traffic demand
In urban network, the traffic demand is spatiotemporally dynamic, and the precise traffic demand is never known in advance.
3) Network complexity
The network complexity in urban area is far more complex than the freeway. Traditional DTA model is hard to apply to the complex urban network because of the complexity [ZW+04].
4) Spatiotemporal Traffic bottleneck (STB)
There exists some STBs in urban network; moreover, some of them resulted from the origin destination (O-D) demand conflict, which makes the traffic assignments more difficult.
5) Network topology evolution
Traditional DTA-model is not evolvable as the network topology change. It has to redesign the network DTA model if the network topology is changed.
6) Lack of traffic event re-action mechanism
In traditional DTA-model based solution, there is no traffic event re-action mechanism, so that if there exist some traffic events in the network, then the traffic
5
assignment actions suggested by the traditional DTA-model may not conform with the expectation.
1.2 Major factors in global traffic network performance
enhancement
For the problems and difficulties in enhancing the global traffic network performance discussed above, in this work, we try to enhance the global traffic network performance by considering the following four facets: 1) decreasing the traffic demand (discussed in this Section), 2) discovering traffic patterns and identifying traffic bottleneck (discussed in Chapter 5 and Chapter 6), 3) resolving the traffic bottlenecks by traffic assignment by decision support system (discussed in Chapter 8), and 4) creating a collaborative traffic information generation and sharing framework for two-ways information exchanging between the travelers and the backend traffic information center (discussed in Chapter 4).
1.2.1
Decreasing the traffic demands
Since the traffic congestions and bottlenecks primarily result from the traffic demand of the traffic network, decreasing the traffic demands or temporally distributing the traffic demand from the peak hours to the non-peak hour should be helpful for enhancing the global traffic network performance. ETC (electronic toll collection) [SL+05, SL+06, LTW08, LJ+04] system and HOV (high occupancy vehicle) system [TAO07] are the two effective mechanisms for achieving the goals of decreasing the traffic demands or temporally distributing the traffic demands. HOV system decreases the traffic demand of actual vehicle journeys by matching travelers who have same O-D demand into the same vehicle in order to ‘raise’ the occupancy
6
of the vehicles. ETC system decreases the traffic demand by tolling the vehicles which enter the urban area, and distributes the traffic flow by setting different toll fee for different periods, for example, high toll fee for peak-hours and low toll fee for non-peak hours. Although these two techniques can effectively decrease the traffic demand, the technical details are beyond the scope of this study. In this dissertation, we focus on the other three factors, as discussed in the following sub-sections. As for the ETC system technique is not strongly related with the research topics in this dissertation, the discussion of design and implementation of a VPS-based ETC system is listed in Appendix A.
1.2.2
Discovering traffic patterns and identifying traffic bottlenecks
Although the traffic network evolves with the growth of the traffic demand and the dynamics in traffic demand makes the performance of the traffic network un-predictable. Somehow there is some traffic patterns can be discovered to reveal the traffic network behavior by data mining on the raw data collected from the LBS-based applications. For example, congestions usually take places at some links on some time period, or some links usually congestion because of in-town traffic demand at AM peak hours.
On the other hand, spatiotemporal traffic bottleneck (STB) is defined and discovered by analyzing the discovered spatiotemporal traffic patterns (STP). With the knowledge of STP and STB, network administrators can take some actions to relieve the congestion and enhance the global performance of the traffic network. In this dissertation, an STP mining model based on spatiotemporal data mining on the raw data collected from the LBS-based applications is discussed in the Chapter 5, and three heuristic methods for identifying the STB is discussed in Chapter 6.
7
1.2.3
Resolving the traffic bottlenecks
In addition to traditional DTA actions such as traffic signal control, the concept of DTA can be generalized and extended to overall traffic network performance consideration. With the knowledge of the STP/STB and the traffic demand between congestion areas which results in the STP/STB, network administrators can take some actions to relieve the congestion, for example, traffic signal control, changeable message sign (CMS), reversible lane, or assigning traffic polices for manually regulating the busy intersections. However, there are some difficulties for the network administrators. For example, which traffic assignment action is most suitable or what parameter setting is optimal (e.g., green time in traffic signal control)? Different actions may result in different effects for the traffic network. For enhancing the global network performance, network administrators need a decision support system provide decision support information for selecting the traffic assignment actions by integrating the real-time and historical traffic information as well as considering the STP/STB.
1.2.4
Collaborative traffic information generation and sharing framework
In addition to central side traffic control and assignment which are carried out at the backend system, user centric behaviors such as path choice to avoid the congestion area, or departure time choice to avoid the congestion periods may also have positive effects to the global network performance. A wiki-like user centric collaborative real-time traffic information generation and sharing framework based on the high penetration rates of location aware mobile devices is proposed in this study. By this collective traffic information generation scheme, since more real-time traffic data will be collected cost-effectively and
8
accurately, the spatiotemporal coverage is better than the traditional traffic information collection scheme. Front-end smart traffic agent (STA), traffic information exchange protocol (TIEP), and backend traffic information center (TIC) constitute the traffic information sharing framework, where STA and TIEP are designed for the location aware real-time traffic information exchanging between the STA and TIC. The TIEP enables STA to automatically echo the local traffic information to the TIC, automatically download the local real-time and predictive traffic information, and reveal the traffic events or traffic status to the TIC manually by the traveler.
1.3 Reader’s guide
In this study, a novel approach rather than the traditional DTA based approaches is proposed, which has the philosophy of enhancing the traffic network performance progressively rather than the optimal traffic assignment.
Table 1-1 Comparisons of traditional DTA models with this study
Traditional
DTA models
This Study
Goal Optimal traffic assignment Continuously enhancing traffic network performance
Model Techniques
Math. Programming, Optimal control theory, Variational inequality
Spatiotemporal data mining, Knowledge based system, Decision Support System
Data source
Traffic demand obtained by estimation or simulation
Raw data collected from LBS-based applications
Apply to Small traffic network, Network planning
Real urban network performance enhancement
Adv. Optimal traffic assignment if the network can be properly modeled
Practicable,
9
Disadv. Intractable for large network, Can’t capture realities of network due to simplification
Optimality is not guaranteed
The remainder of this dissertation is organized as follows. The related works about traffic data collection and traffic state recognition, traffic patterns mining and traffic bottlenecks discovering, and travel time prediction are discussed in Chapter 2. The background knowledge of LBS, data collection and cleansing technique, and traffic information generation from LBS issues are discussed in Chapter 3. A collaborative traffic information generation and sharing framework is proposed and designed in Chapter 4 for the portal of traffic information collection and distribution, where several techniques including smart traffic agent (STA) for the front-end devices, multi-sources heterogeneous traffic information fusion, and traffic status predicting are proposed and detailedly discussed. In Chapter 5, spatiotemporal traffic patterns (STP) mining issue is discussed, where several STPs are defined and discovered by hypothesis based spatiotemporal data mining technique. The granularities of the discovered STPs range from object level, area level, to the global network level. Based upon the discovered STPs, three heuristic methods for discovering the spatiotemporal bottlenecks (STB) are proposed and discussed in Chapter 6, which includes congestion propagation heuristic (CPH), congestion converge heuristic (CCH), and congestion drop heuristic (CDH).
Two applications about the advanced traveler information system (ATIS) and advanced traffic management system (ATMS) are discussed in Chapter 7 and Chapter 8 respectively. In Chapter 7, a knowledge based real time travel time prediction (TTP) system is designed and implemented, which contains real-time and historical travel time predictors and a dynamic weighted combination scheme. The discovered spatiotemporal traffic patterns are transformed
10
to the prediction rules in the historical travel time predictor, and real-time traffic information constitutes the real-time predictor and facts in the inference engine. In addition to the TTP system designed for the traveler, a decision support system targeted to enhance the global network performance which provides valuable traffic assignment suggestions for the traffic network administrators in Chapter 8. It utilizes the discovered traffic knowledge discussed in this work, such as traffic information database, STP/STB, predicted traffic status, and combines the domain expertise in order to optimize the global network performance and make traffic assignment suggestions. Finally, the concluding remarks and future works are discussed in Chapter 9.
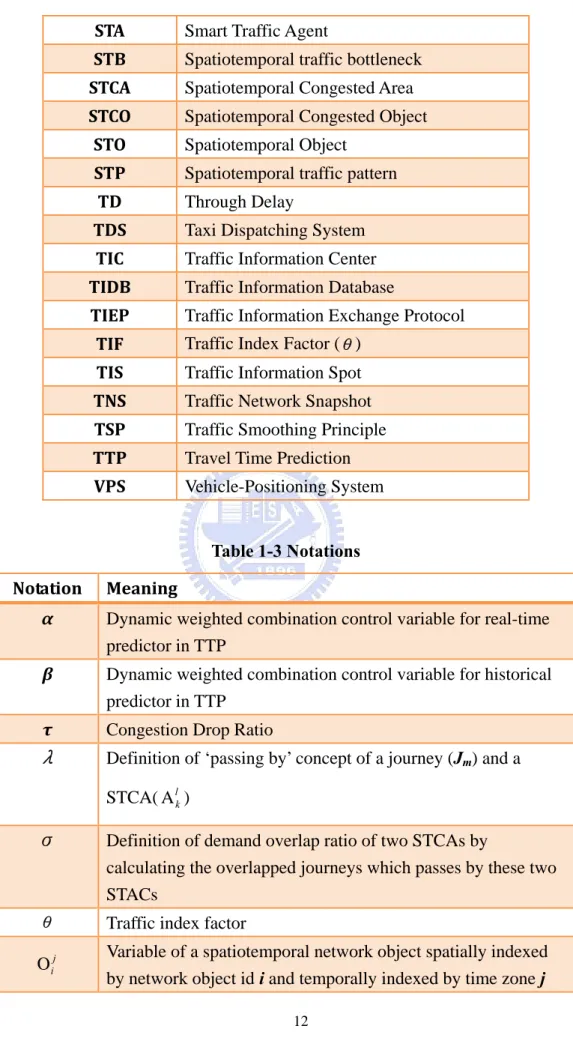
1.3.1 Abbreviations and notations
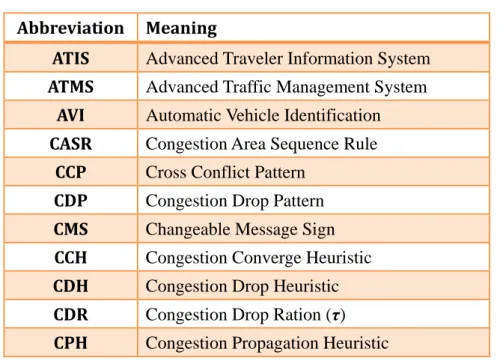
Many abbreviations, terminologies, and notations are defined and used in this dissertation. In order to facilitate reading, the abbreviations are summarized in Table 1-2 and the notations are summarized in Table 1-3.
Table 1-2 Abbreviations Abbreviation Meaning
ATIS Advanced Traveler Information System
ATMS Advanced Traffic Management System
AVI Automatic Vehicle Identification
CASR Congestion Area Sequence Rule
CCP Cross Conflict Pattern
CDP Congestion Drop Pattern
CMS Changeable Message Sign
CCH Congestion Converge Heuristic
CDH Congestion Drop Heuristic
CDR Congestion Drop Ration (τ)
11
CPP Congestion Propagation Pattern
CTM Cell Transmission Model
CRP Conflict Resolution Principle
CVO Commercial Vehicle Operation
DCP Demand Conflict Pattern
DOR Demand Overlap Ratio (σ)
DSRC dedicated short range communication
DSS Decision Support System
DTA Dynamic Traffic Assignment
ETC Electronic Toll Collection
FCD Floating Car Data
FED Front-End Device
GEP Global Enhancement Principle
GIS Geographical Information System
GPS Global Positioning System
GWP Give Way Principle
IBP Information Broadcast Principle
IDP Intersection Delay Pattern
ITS Intelligent Transportation System
KB Knowledge Base
KC Knowledge Class
KBS Knowledge based system
LBS Location-Based Service
LTD Left-Turn Delay
LTIP Left-Turn Interlaced Pattern
NORM New Object-oriented Rule Model
OBU On-Board Unit
OD Origin Destination
PCP Priority Control Principle
RTD Right-Turn Delay
RCSTCA Root Cause Spatiotemporal Congested Area
SAP Spatiotemporal Aggregation Pattern
SCP Sole Congested Pattern
12
STA Smart Traffic Agent
STB Spatiotemporal traffic bottleneck
STCA Spatiotemporal Congested Area
STCO Spatiotemporal Congested Object
STO Spatiotemporal Object
STP Spatiotemporal traffic pattern
TD Through Delay
TDS Taxi Dispatching System
TIC Traffic Information Center
TIDB Traffic Information Database
TIEP Traffic Information Exchange Protocol
TIF Traffic Index Factor (θ)
TIS Traffic Information Spot
TNS Traffic Network Snapshot
TSP Traffic Smoothing Principle
TTP Travel Time Prediction
VPS Vehicle-Positioning System
Table 1-3 Notations Notation Meaning
α Dynamic weighted combination control variable for real-time predictor in TTP
β Dynamic weighted combination control variable for historical predictor in TTP
τ Congestion Drop Ratio
λ Definition of ‘passing by’ concept of a journey (Jm) and a
STCA(A ) lk
σ Definition of demand overlap ratio of two STCAs by
calculating the overlapped journeys which passes by these two STACs
θ Traffic index factor
j i
O Variable of a spatiotemporal network object spatially indexed by network object id i and temporally indexed by time zone j
13 )
(Oij
θ normalized traffic status of spatiotemporal objectO ij Nj Snapshot indexed by temporal index j
Hd congestion drop threshold
s u
H spatial boundary threshold
d u
H demand overlap ratio Tk Time zone indexed by k
14
Chapter 2
Related Works
2.1 Traffic data collection and traffic state recognition
Traditionally, real-time traffic information collection is categorized into three schemes [LZ05]: site-based, sensor-based and probing vehicle-based data collection schemes. Site-based measurement collects vehicle license plate characters and arrival times at various checkpoints through automatic vehicle identification (AVI) technologies, matches the license plates between consecutive checkpoints, and computes travel times from the difference between arrival times. Vehicle-based methods analyze the raw data collected from fleet of probe vehicles by matching the vehicle tracks with geographical information system (GIS). Sensor-based scheme collects raw data from the stationary sensors like loops detectors, transponders or radio beacons installed at arterial roads. However, each traffic information collection method has some drawbacks and limitations. For example, site-based and sensor based methods have the spatial coverage problem due to the fixed and limited sensors or AVI devices. Vehicle-based scheme [NT04, YAN05, CH+03] has cost, spatial and temporal coverage problems due to the very high cost for maintaining a dedicated fleet of urban network traffic probing vehicles. Besides, the cost of real-time transmission for the whole traffic network in each data collection scheme is also very high [LTT09].
15
2.2 Traffic patterns mining and traffic bottlenecks discovering
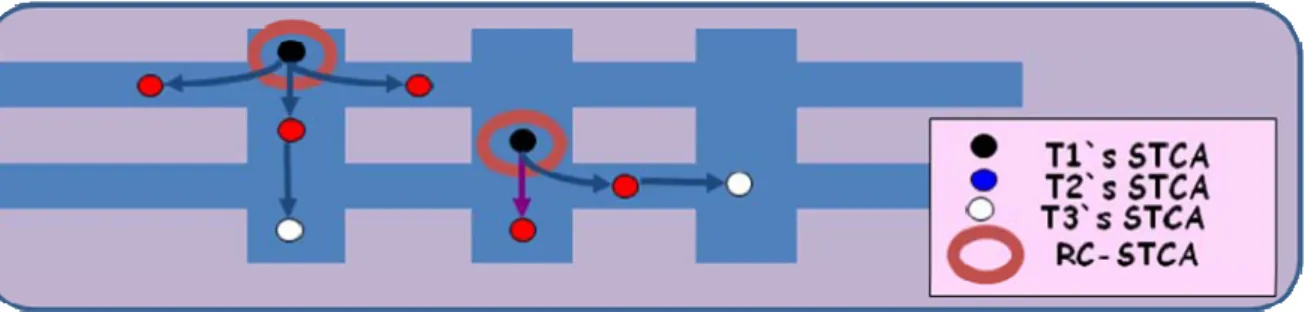
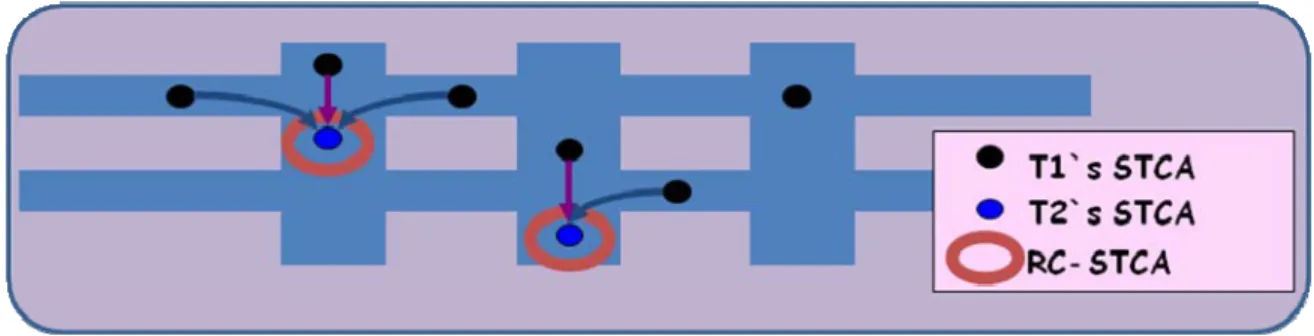
In the literature, many researches aimed to find out the traffic patterns[ZZ+04, TLT05, TSA06, CHU03, CMC07] or to identify traffic states[KD+05] in traffic network, and some researches worked on predicting the travel time to provide drivers route suggestion[LTT09, KKS05]. Kerner [KD+05] proposed FCD (Floating Car Data) method to recognize traffic state (e.g., congested or not) by FCD vehicles in urban network, but still cannot identify the locations of the bottlenecks. Till now, most of previous studies tried to locate and control congestion patterns on highway bottlenecks [KER05, KER07] which are usually static, clear and always located around the gateway, but locating the bottlenecks on the urban network is more difficult than that on the freeway because there are no intersections and traffic signal control on the freeway. In other words, the task of analyzing traffic patterns in urban network and finding out traffic bottlenecks is a complex and difficult mission due to the following reasons: first, traffic network in urban area is more complex than that in freeway or simple arterial network; second, bottlenecks in urban network which are spatiotemporal dynamic varied with spatial or temporal environment and varied with traffic demands; third, not only more traffic factors but also more non-traffic factors have to be concerned in urban network than in freeway, such as traffic signal, social event, and traffic incidents, etc. Recently, [LG+08] tried to recognize urban traffic congestion propagation and identify bottleneck based on Cell Transmission Model (CTM), which discretizes each roadway into homogeneous section (cell) and discretizes time into intervals. Given the network objects capacities, it tries to identify the network bottlenecks by simulating the traffic demands of the urban network. In this dissertation, we try to not only discover the statistical and congestion propagation types of network bottlenecks, which similar to [LG+08], but also define and discover several types
16
of traffic patterns including object level patterns and area level patterns, which are then transformed to spatiotemporal traffic bottlenecks by our proposed heuristic methods.
2.3 Dynamic traffic assignment (DTA)
DTA researches have evolved substantially since the pioneering work of Merchant and
Nemhauser [MN78A, MN78B], which are typically classified into two broad categories: analytical models and simulation-based heuristic models [ZW+04]. The analytical models can be further classified by three groups: mathematical programming, optimal control, variational inequality [PZ01]. Efforts in the analytical models include mathematical programming approaches by [JAN91] and [ZIL00], optimal control theory based formulations by [FL+90], and variational inequality approaches introduced by [FB+93] and [SMI93]. The evolutions and literature review of the related analytical as well as simulation based approaches was done by Peeta and Ziliaskopoulos [PZ01]. Most analytical formulations are extensions of their static formulations and seem to have two main disadvantages: 1) they cannot adequately capture the realities of street network due to simplifications, and 2) they tend to be intractable for realistic size networks [ZW+04]. Besides, most analytical researches obtain the O-D data by assumption, estimation or simulation, which cannot capture the spatiotemporal traffic demand of the traffic network. So that the assignment suggestions based upon the assumption, estimation or simulation won’t have good effect for network performance enhancement.
2.4 Travel time prediction (TTP)
17
the road network. Vehicular flows on freeways are often treated as uninterrupted flows; flows on urban network are conceivably much more complicated since vehicles traveling on urban network are subject to not only queuing delays but also signal delays and turning delays. Thus,
TTP for an urban network is more challenging than predicting the travel time for freeway or
single arterial. Besides, the routing and path selection problems should be solved in TTP for urban network, i.e., the TTP model has to suggest a shortest travel time path on a given OD (origin, destination) pair as a request. Many models had been proposed for travel time prediction in these decades, but most of them focused on predicting the travel time on freeway [WHL04, CK03] or simple arterial network [JZ03, LKM04].
In the past, many ITS studies and transportation agencies use the traffic data from dual-loop detectors which are capable of archiving with traffic count (the number of vehicles that pass over the detector in that period of time), velocity, and occupancy (the fraction of time that vehicles are detected) and readily available in many locales of freeways and urban roadways [LZ05]. Nowadays, traffic data collecting techniques have made great progress and evolved to real-time collecting in order to improve traffic management efficiency. In [LZ05], traffic information collection and travel time measurement can be divided into three categories: site-based, vehicle-based and sensor-based measurement. Site-based measurement collects vehicle license plate characters and arrival times at various checkpoints through automatic vehicle identification (AVI) technologies, matches the license plates between consecutive checkpoints, and computes travel times from the difference between arrival times. Vehicle-based methods make TTP by analyzing raw data collected from fleet of probe vehicles. Sensor-based methods make TTP measurement by collecting raw data from the stationary sensors like loops detectors, transponders or radio beacons installed at arterial roads. However, each traffic information collection method used for TTP has some drawbacks and
18
limitations. For example, site-based and sensor based TTP methods have the spatial coverage problem because the sensors or AVI devices are fixed and limited. Vehicle-based TTP methods [NT04, YAN05, CS+03] have cost, spatial and temporal coverage problems because the total cost is very high if a dedicated fleet of urban network traffic probing vehicle is maintained.
There are numerous previous TTP approaches based on the historical traffic data analysis in the literatures, which can be categorized as follows [LZ05]: regression method (mathematical model) [WHL04], time series estimation method, hybrid of data fusion or combinative model [WLC05] and artificial intelligence method like neural network [MSR04]. In [NT04], auto regression (AR) model and state space model for time series modeling were used to predict travel time. The Kalman filtering provides an efficient computational (recursive) in many TTP researches [LKM04, CHU03, YAN05], because it is very powerful in several aspects: it supports estimations of past, present, and even future states even if the precise nature of the modeled system is unknown. In [WHL04], the support vector regression model was used to predict travel time for highway users. In [BCK04], pattern matching technique was used for TTP. Traffic patterns similar to the current traffic are searched among the historical patterns, and the closest matched patterns are used to extrapolate the present traffic condition. Chung et al. [CH+03] developed an O-D estimation method to make more accurate estimation of traffic flow and traffic volume in congestion traffic status. Moreover, the data fusion models of TTP integrated grey theory [TTI03] and neural network-based. Yang [YAN05] developed some hybrid models toward data treatment and data fusion for traffic detector data on freeway.
19
Chapter 3
Traffic Information Generated
from LBS-based Applications
3.1 Location-based service (LBS)
LBS, a kind of service providing appropriate location-aware information for the users, has become the main stream of mobile commerce applications and telematics service. The technologies used in LBS are positioning, mobile communication, and GIS (Geographical Information System). Front end devices such as OBU (On-Board Unit) or smart phone exchanges the users’ location information with LBS backend system through mobile communication network to accomplish the business processes. There are many LBS-based applications had been proposed, such as electronic toll-collection by vehicle-positioning system (VPS) [LTW08], telematics service, taxi dispatching system (TDS) [LW+04], and commercial fleet management system, etc.
As shown in Figure 3-1, the architecture of LBS system includes four system components: OBU, communication system, M-Server and E-Server. OBU, a small computer system installed on the vehicle, has computing, positioning, communication and human interface modules. It can locate the vehicle through receiving GPS satellites signal by positioning module, send and receive the messages to and from the backend system through the communication module, and interact with user via the human interface module. LBS-based applications accomplish the business processes by exchanging information
20
between the in-vehicle front-end devices (OBU, smart-phone) and the backend systems. Information is transmitted by the uplink packets (sent from OBUs to backend) and downlink packets (sent from backend to OBUs) over the mobile network. Such interactions among OBUs and the backend system form the basis of the LBS-based applications. TDS, one of the most complicated LBS-based applications, is used as the data mining source of this work because the traffic information included in TDS is considered more plentiful than other LBS-based applications, especially in urban network.
GPRS WCDMA
Figure 3-1 Components of LBS application
There are several participants in TDS, including customers (passengers), taxi drivers, operators and administrators. OBU automatically registers to the backend system through mobile network and turns into ‘available’ state when it gets started. Taxi drivers can change the state of the taxi or interact with the backend system by the human interface on OBU. There are several functions designed for the driver to interact with the backend system and operator, including state change (‘available’ / ‘occupied’ / ‘scheduled’ / ‘dispatched’ / ‘rest’), polling reply(‘Y’ / ‘N’ / [minutes]), emergency, and message request.
When OBU gets started, it automatically communicates and exchanges information with the dispatching center through the mobile network, and reports the position, direction, speed,
21
and status of the taxi according to the predefined rules embedded in OBU. Therefore, the dispatching center keeps the latest statuses and positions of all the vehicles based upon all the collected uplink packets of OBUs. In TDS [LW+04], there are three uplink rules built in the OBU: periodically report (in fixed time interval), cross boundary report (on taxi driving through the geographical boundary), and event report (on status changing or event triggering). Customer requests a taxi via telephone call, fax, or Internet web site, operators key-in the requirements and location of the customers, and the backend system automatically searches the available taxi candidates nearby the location of the customer, probes the candidates that fulfill the requirements. The dispatched taxi driver responses the probing message from TDS, and moves on to the corresponding customer’s location when the dispatching message is confirmed. The OBU turns into ‘dispatched’ state when the taxi is dispatched, switches to ‘occupied’ state when the customers get on the vehicle, and finally turns into ‘available’ state when the customers get off the vehicle. By decoding and analyzing the uplink packets and state transitions, traffic status and traffic origin-destination demand in the urban network can be derived from communication raw data in LBS-based applications. Thus all the vehicles in the LBS-based applications can be regarded as the traffic status probing vehicles for the urban network.
3.2 Data collection and cleansing
Data collection module, a batch process, periodically collects the communication log between the front-end devices (OBU) in the vehicles and backend system in the LBS-based applications. Different data sources are collected and integrated by the data collection module, network connection, data transfer protocol and data format transformation issues are also done
22
in this module. Real time data is collected and analyzed from the LBS-based applications, for different applications, data collection module and cleansing module have different ways of data collection and cleansing, depending on the application data format and domain knowledge. Take the TDS as an example, all the uplink packets are filtered out except OBU in “occupied” and “dispatched” states because only these two states can guarantee the vehicle is in moving status, which can reflect the real traffic status.
Data cleansing module takes care of the “incomplete”, “inconsistent”, “outlier”, “noise” data preprocess issues, for example, data is not in the interested traffic network area, vehicle is not in moving status, incorrect GPS state, incorrect speed data, or incomplete data. Data normalization and those application dependent data preprocessing rules are also included in the data cleansing module.
3.2.1 Missing Values (incomplete)
In some cases, the uplink packets collected from the front-end devices are incomplete. This may happen due to malfunction of some components of the front-end device or the GPS signal is too weak to precisely locate the vehicle. The reasons for the weak GPS signal case might be that the vehicle is located in the weak signal area such as under an infrastructure (e.g., tunnel) or the vicinity of elevated structures (the so called urban canon). There are several cases in the GPS data missing, coordinates, speed, or direction missing. In the former two cases, the uplink packets are regarded as useless; however, in the case of missing direction data, it can be recovered by vehicle moving direction estimation by the assistance of the GIS.
23
3.2.2 Useless Data
Some collected data is regarded as useless data due to the following reasons: 1) the location of the uplink packet is not located in the interested urban area, 2) the outlier / incomplete / inconsistent data, 3) vehicle is not in moving status or 4) redundant data. The useless data is filtered out by the data cleansing module case by case. For example, for the case of vehicle not in the moving state, the vehicle continuously sends the speed “0” uplink packets to the traffic information center. The data collection module checks the real-time traffic status of the same link with TIC to verify that the link is in congested state or not. If the link is not in congested states, then the uplink packets from the vehicle are discarded due to they are not in moving state. This case will happen when the vehicle temporary stops for some business reasons, e.g., taxies in taxi stop, commercial vehicle (truck / wagon) stopped for goods loading / unloading, bus stopped at bus stop for people on / off the bus.
3.3 Traffic information generation
3.3.1 Traffic information spot (TIS)
Traffic information transformation module transforms the cleaned raw data into traffic information by integrating the urban road network database in GIS. Each uplink packet of the OBU can be transformed into a traffic information spot (TIS) because the information contained in the uplink packets includes location, moving speed, moving direction, and the state of the vehicle. By integrating the road network database with GIS, the coordinates of the GPS position of a vehicle can be interpolated to nearest address. Thus traffic information can
24
from the OBU uplink packet Uk of a vehicle, as illustrated in Equation (3.1), consists of object
id (Oij), speed (V), direction (D) of the vehicle when it communicates with the LBS backend
system at time t and location (x, y), where Oij is a spatiotemporal network object spatially
indexed by network object id i (transformed from the location to address interpolation) and temporally indexed by time zone j (transformed from timestamp t).
) , , O ( S ) , , , , , (X Y tV D S k V D U j i Gis k ⎯⎯→ … (3.1)
3.3.2 Vehicle journey
In addition to TIS which indicates the traffic status at one fixed point, a vehicle journey represents the tracks of a vehicle starting from its origin to the destination. A vehicle journey, which partially reflects the traffic demand in the urban network, is a collection of consecutive
TISs of a vehicle and can be extracted from the LBS raw data. For example, ‘dispatched’
state journey extracted from TDS consists of a set of TISs which starts from the dispatched location to the customer’s location, and ‘occupied’ state journey starts from the customer’s location to their destination.
Vehicle journey generation module extracts ‘meaningful’ journey (indexed by k) from the raw data collected from the LBS-based applications, for the TDS example, taxi that is in the ‘dispatched’ or ‘occupied’ states, where a journey of a vehicle consists of a set of
consecutive TISs reported from the origin S1 of the vehicle to its destination Sn, as illustrated
25
Jk=<S1,..,Sn> … (3.2)
3.3.3 Traffic network snapshot (TNS)
In order to enhance the global traffic network performance, network administrators have to realize the traffic status of the whole network. Traffic network snapshot (TNS) provides a global view of traffic status in a time period for the traffic network, which is indexed by spatial and temporal dimensions. Spatial domain groups the TISs by spatial area of the network object (e.g., link) and temporal domain groups the TISs by time zone (e.g., 15 minutes). Let a TNS be composed of a set of a spatiotemporal network objects during a
15-minute period. Therefore, the traffic status of urban network in morning workday peak
hour (7~9 AM) includes eight snapshots. All the spatiotemporal traffic network objects and snapshots generated in this phase are stored in TIDB (traffic info. database) as the data source of the subsequent data mining processes.
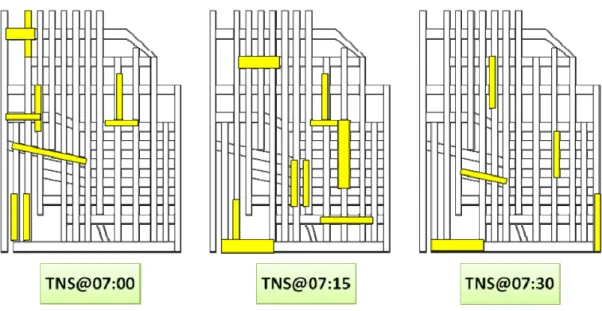
TNS can be easily presented by map based user interface for reflecting a short period of
network status by the assistance of the GIS. As illustrated in Figure 3-2, there are three continuous TNSs of an urban network from 7AM to 7:30AM, where the objects marked as yellow lines indicate the congested links. With the knowledge of global network traffic status and continuous traffic status variations which can be presented by continuous TNSs, the network administrators can decide which traffic assignment actions to be the best action by their domain expertise.
26
Figure 3-2 examples of three continuous TNSs (from 7AM~7:30AM)
3.3.4 Traffic information generation for freeway
The focus of traffic information for the freeway area is different from that for the urban area; travelers are more concerned about the traffic event messages and ramp to ramp traveling time than the route path choice in the freeway. On the contrary, in the urban area, travelers are concerned about the route path choices in order to avoid the congestion. Since the topology in the freeway is much different from that in the urban network, different sampling strategies are used to generate the traffic information depending on the location of the traffic information in freeway area or urban area. For example, if a vehicle is equipped with OBU or STA (smart traffic agent, discussed in the next chapter) traveling through the freeway, a series of samples uploaded from the same OBU/STA are collected by the backend
traffic information center (TIC), and each sample can be transformed to the format of (Mx, Tx),
where Mx indicates the mileage and Tx indicates the uploaded timestamp. By selecting the
27
between these two ramps can be calculated by (Me-Ms)/(Te-Ts), which is regarded as a case.
For any two ramps k and j, the overall average travelling speed can be calculated by the
arithmetic mean value (Vk,j) of for all the cases of (k, j) as shown in Equation (3.3).
) M M ( ) ( V 1 , , , j k n i i l i k j k n T T − ⋅ − =
∑
= … (3.3)3.3.5 Traffic information generation for urban network
Urban network consists of a set of network objects, each of which is either a link or an intersection where traffic congestions occur on some network objects in which the traffic demand cannot be fully serviced. The traffic status of the network which constitutes the network can then represent the traffic status of urban network.
(I) Traffic information of a link
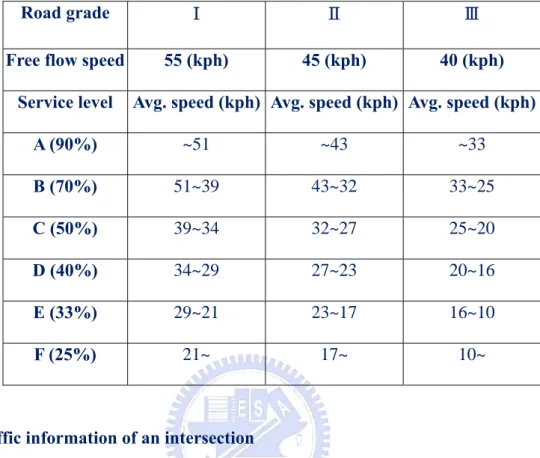
The average speed of a link in a temporal period can be calculated by arithmetic mean value shown in Equation (3.3) of all the samples spatially falling in the link and temporally falling in the temporal range. However, in urban area, it seems not reasonable to represent link traffic status by the average speed for all the links because the service levels of different road grades are different. As shown in Table 3-1, the service levels of the three road categories in urban area of Taiwan are defined from level A to F [CLO01]. The link traffic information can be transformed to the service level by mapping the average speed to the road grade and service level defined in Table 3-1. For example, average speed of 30km/hr indicates the traffic status is good (level B) in street (grade III), but slight congestion (level D) in the expressway
28
or arterial (road grade I).
Table 3-1 Service level classification for three categories of road in Taiwan
Road grade Ⅰ Ⅱ Ⅲ
Free flow speed 55 (kph) 45 (kph) 40 (kph) Service level Avg. speed (kph) Avg. speed (kph) Avg. speed (kph)
A (90%) ~51 ~43 ~33 B (70%) 51~39 43~32 33~25 C (50%) 39~34 32~27 25~20 D (40%) 34~29 27~23 20~16 E (33%) 29~21 23~17 16~10 F (25%) 21~ 17~ 10~
(II) Traffic information of an intersection
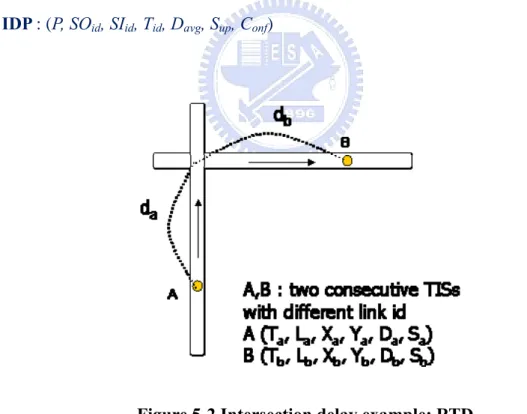
On the other hand, the average intersection delay can represent the traffic information for the intersection, and the delay between two consecutive links, which is mostly caused by signal delay and queuing delay and can be classified by TD, LTD and RTD patterns according to the three possible directions from one link to the next link. Equation (3.4) shows the
general format of intersection delays (TD/LTD/RTD), where P is the pattern type, SOid and
SIid are the two consecutive links at the intersection where the vehicles leave out the link SOid
and come into the link SIid, Tid is the temporal id, Davg is the average delay time of this
intersection, and Sup, Con are the support and confidence of the pattern, respectively.
29
For example, (‘RTD’, ‘L1’, ‘L2’, ‘W,P’, 40, 0.2%, 75%) represents that in the peak hours of workday, it takes 40 seconds to do a right turn from link ‘L1’ to link ‘L2’, and the support is 0.2% , confidence is 75%. Intersection delay patterns can be discovered by sequential pattern mining or spatial and temporal sequence mining on all samples of intersection delay in a journey containing two consecutive samples with different links in the historical traffic information database. Figure 3-2 shows an example of RTD pattern: a probing vehicle driving
north and then turning right to east, it reports TIS at location A of Link La and consecutively
reports TIS at location B of Link Lb. The symbols of the TIS format (T,L,X,Y,D,V) in Figure
3-3 stand for timestamp (T), link id (L), coordinates (X,Y), direction (D) and speed (V),
respectively. The distance da, db in Figure 3-2 stands for the distance from A or B to the
intersection of links La or Lb respectively. Assuming that in the short period time interval
between Tb and Ta, the vehicle is driving at the speed of Va at link La and Vb at the link Lb.
Then the right turn delay (RTD) time from La to Lb can be estimated by subtracting travel
time of da and db from elapsed time between two TISs (Tb-Ta).
30
The status of each intersection delay in an intersection is also classified into six service levels (A~F) by normalizing each intersection delays, i.e., by equally dividing the intersection delay samples into six levels from the historical traffic information database. With the traffic status of all the links and intersections, the whole network status can be easily represented on map by coloring the objects in the user interface.
31
Chapter 4
Collaborative Traffic Information
Generation and Sharing Framework
In addition to the generated traffic information from the LBS-based applications, there are two other traffic information sources: collaborative traffic information generation and external traffic information data sources integration. By integrating these two traffic information with the generated traffic information with LBS-based applications, a collaborative traffic information generation and sharing framework is proposed and discussed in this chapter.
More and more mobile devices such as mobile phones, PDAs are equipped with location capability by connecting to GPS module by wired or wireless scheme. On the other hand, more and more PNDs (personal navigation device) and UMPC (ultra mobile PC) which have location capability are now equipped with mobile communication module in order to retrieve the real-time traffic information. All these devices (GPS smart phone, PDA, PND, UMPC, etc.) have the features of mobility, communication and location capabilities. With the front end devices with these features, many modern mobile applications such as location-based service (LBS), telematics, and ITS related applications can be provided. On the basis of such high penetration of mobile communication devices with location capability, we proposed a wiki-like collaborative real-time traffic information generation and sharing framework for real-time traffic information collection, fusion and distribution. By this collaborative traffic information generation scheme, more real-time traffic data will be collected cost-effectively
32
and accurately, and the spatiotemporal coverage is better than the traditional traffic information collection scheme.
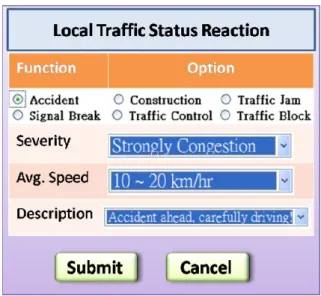
As information exchanging and sharing through a public platform, e.g., the Wikipedia website is the major trend of Web 2.0 technology, our idea is to create a wiki-like real-time traffic information exchanging and sharing framework for different kinds of mobile devices users. Accordingly, a collaborative real-time traffic information collection, data fusion and distribution framework including a front-end smart traffic agent (STA), real-time traffic information exchange protocol (TIEP) and traffic data fusion and distribution backend center (TIC) is proposed. STA is a two-way real-time traffic information agent with a data exchange channel for location aware traffic information exchange through the TIEP is installed, and is also developed as a smart interface between the terminal and the driver for displaying the real-time and predictive traffic information, and providing the real-time traffic events reaction interface to share the local traffic information with other users.
Several external traffic information data sources including national traffic information center [EIOT], national freeway traffic information [TAN], and police station real-time traffic information [PRS] are integrated to the TIC in order to enhance the precision and coverage area, and an optimal weight traffic information fusion scheme is proposed to enhance the traffic information prediction capability. A knowledge based system combined with expert heuristic rules is also implemented in the TIC to dynamically decide the weight of different data sources including real-time collected traffic information, historical traffic data base, and multiple external traffic information data sources.
33
4.1 Architecture of the framework
The applications of the traffic information are generally divided into three stages, which are data collection and cleansing, data fusion and integration, and data distribution. In the data collection and cleansing stage, raw data is collected from different data sources, filtered and analyzed in the backend system. The collected data are then integrated with the geographical information system (GIS) and external traffic information data sources in the data fusion and integration phase. In the data distribution phase, several interfaces including web, radio, mobile subscribe, etc. are provided for users, where the mobile subscription scheme which is suitable for the users with mobile communication device can retrieve the real-time traffic information provided by the TIC according to the device location.
Three key components, front-end STA, TIEP protocol, and backend TIC constitute the traffic information generation and sharing framework, where TIEP are designed for the location aware real-time traffic information exchanging between the STA and TIC, which enables STA to automatically echo the local traffic information detected by STA to the TIC, automatically download the local real-time and predictive traffic information, and react the traffic events or traffic status to the TIC by the traveler. As shown in Figure 4-1, the architecture of the collaborative traffic information generation and distribution framework includes three parts: location aware mobile device with STA, TIC for data collection and fusion, and external traffic information data sources, where various versions of STAs are developed for different front-end mobile devices depending on the different hardware and operating system, the generated real-time traffic information can be distributed by STA (request and response model), radio broadcast network (RDS), web site, etc, and TIC also connects to external real-time traffic information data sources, including e-IOT national traffic