583
T
he Japanese eel Anguilla japonica Temminck and Schlegel is a temperate catadro-mous fish, distributed in rivers of the northeastern Asian countries of Taiwan, China, Japan, and Korea (Tesch 2003). The spawning ground of this species is presumed to be in the western Mariana Is., at a salinity front near 15°
N, 140°
E, as evi-denced by the occurrence of newly hatched larvae (leptocephali) in the area (Tsukamoto 2006). Leptocephalus larvae drift from their spawning grounds with the North Equatorial Current (NEC) followed by the Kuroshio Current (KC) for 4-6 mo to reach the coasts of Northeast Asia (Cheng and Tzeng 1996). The translucent glass eels become pigmented elvers during their upstream migration. Eels live in rivers for 4-10 yr before their gonadsbegin to mature in late autumn when they meta-morphose into silver eels and are ready to migrate a distance of 2000-3500 km back to their birth-place for spawning (Tzeng 1986, Tsukamoto 1992, Tzeng et al. 2000, Han et al. 2003).
The Japanese eel is an important fishery resource in Asia. For cultivation, great numbers of elvers are caught in estuaries, resulting in a seri-ous problem with overfishing (Tzeng 1985, Tseng et al. 2003). For effective management of eel resources, a better understanding of the popula-tion structure of the eel is fundamental. In the past, the concept of panmictic populations of Japanese eel, European eel, (Anguilla anguilla), and American eel (A. rostrata) was accepted due to evidence from allozyme, nuclear markers, and
Population Genetic Structure among Intra-Annual Arrival Waves of the
Japanese Eel Anguilla japonica in Northern Taiwan
Kai-Chieh Chang, Yu-San Han, and Wann-Nian Tzeng*
Institute of Fisheries Science, College of Life Science, National Taiwan University, Taipei 106, Taiwan
(Accepted April 18, 2007)
Kai-Chieh Chang, Yu-San Han, and Wann-Nian Tzeng (2007) Population genetic structure among intra-annual arrival waves of the Japanese eel Anguilla japonica in northern Taiwan. Zoological Studies 46(5): 583-590. A previous study showed that the Japanese eel Anguilla japonica Temminck and Schlegel is not a pan-mictic species, as it is divided into low- and high-latitude groups, but it shows no significant genetic differentia-tion among year cohorts in the same habitat. However, based on hatching dates back-calculated from otolith of elvers recruited in Taiwan in the winter, the arrival waves of elvers are from different intra-annual cohorts with separate spawning times. To test if temporal genetic differentiation exists within intra-annual cohorts, 7 poly-morphic microsatellite DNA loci were examined. Four arrival waves of Japanese eel elvers were collected from a single location in northern Taiwan from Nov. 2000 to Mar. 2001. Deviations from Hardy-Weinberg equilibrium were found in three of the 7 loci after the Bonferroni correction, and five of the 7 loci were used for a genetic variation test. No significant genetic differentiation was observed among the overall sample (FST= 0.0029, p = 0.173), and subtle, but significant, differentiation was only found between temporal cohorts of Nov. and Dec. 2000 (FST= 0.0111, p = 0.008). The phylogenetic tree indicates patchiness among elver waves with samples of Nov. 2000 significantly separated from the others. The assignment test, however, showed a high mixing rate among each cohorts. These results indicate that arrival waves of elvers in consecutive months at the same habitat exhibit subtle genetic patchiness but overall lack significant temporal genetic variations.
http://zoolstud.sinica.edu.tw/Journals/46.5/583.pdf
Key words: Intra-annual cohort, Japanese eel, Genetic differentiation, Microsatellite DNA, Panmixia.
*To whom correspondence and reprint requests should be addressed. Tel: 886-2-33662887. Fax: 886-2-23639570.
mtDNA sequences (De Ligny and Pantelouris 1973, Avise et al. 1986, Sang et al. 1994, Lintas et al. 1998, Ishikawa et al. 2001, Avise 2003). However, recent studies using more-sensitive microsatellite markers indicate that the population genetic structure does not support the panmictic hypothesis in the Japanese eel (Tseng et al. 2006), American eel (Wirth and Bernatchez 2003), or European eel (Wirth and Bernatchez 2001, Maes and Volckaert 2002). The European eel fits the model of isolation-by-distance (IBD) with some level of gene flow occurring between spatially adja-cent populations (Wirth and Bernatchez 2001, Maes and Volckaert 2002). However, no IBD was found among eels of different locations in another study of the European eel (Dannewitz et al. 2005). American eel populations have very weak but sig-nificant spatial genetic differentiation although an IBD pattern was not observed (W irth and Bernatchez 2003). The Japanese eel is divided into a low-latitude group (South China and Taiwan) and a high-latitude group (Japan, Korea, and North China) without IBD being detected (Tseng et al. 2006). The“member-vagrant model”hypothesis, which emphasizes the role of stable oceanograph-ic features in retaining larvae in a favorable envi-ronment (Sinclair 1988), was modified to explain the population structure of the Japanese eel: most progeny tend to be transported back to similar locations as were their ancestors with some degree of exchange between neighboring popula-tions (Tseng et al. 2006). The spawning site of the Japanese eel appears to be near 3 seamounts in the western Mariana Ridge (Tsukamoto et al. 2003, Tsukamoto 2006). These seamounts are located in the westward flow of the North Equatorial Current (NEC) and are hypothesized to provide cues for migrating silver eels and to serve as possible aggregation sites for spawning. In addition, the eel shows a protractive spawning period induced by different departure times and distances for geographically distant groups (Tesch 2003, Tsukamoto et al. 2003, Maes et al. 2006). The existence of separate spawning sites and spawning migration loops for the southern and northern eel groups is likely to be the reason for the formation of spatial genetic heterogeneity in the Japanese eel. Cheng and Tzeng (1996) deter-mined the ages at metamorphosis from lepto-cephalus to glass eels of Japanese eels by calcu-lating the daily growth rings of otoliths, which increased from south to north. The difference in larval durations between southern and northern groups of Japanese eel may have contributed to
the separation of these 2 groups.
Despite the spatial differentiation of the genet-ic structures of the Japanese, Amergenet-ican, and European eels, temporal genetic variation is also an important issue for better and accurate under-standing of eel population structures. Dannewitz et al. (2005) indicated that the overall genetic dif-ferentiation of the European eel is low but signifi-cant, with temporal genetic variation within sites exceeding the geographical factor among sites. Pujolar et al. (2006) found highly significant genet-ic differentiation among arrival waves of European eels either among inter-annual cohorts or among intra-annual samples, and genetic patchiness among recruits was raised to explain the heteroge-neous character of the eel that results from a large variance in the contribution of individuals to each annual cohort. Maes et al. (2006) also found sig-nificant genetic differentiation among arrival waves of European eel, and evidence of the isolation-by-time (IBT) pattern was found among waves. These studies suggest that both spatial and tem-poral genetic differentiations occur in the European eel. For Japanese eel, no significant genetic dif-ferentiation was observed among annual cohorts in 3 successive years in northern Taiwan with sam-ples randomly selected from intra-annual cohorts for each year, indicating the annual stability of the population structure (Tseng et al. 2003). However, back-calculated birth dates based on otolith microstructure of glass eels indicated that the Japanese eel does not continuously spawn during the long spawning season from Apr. to Nov., but is synchronized to spawn periodically once a month during the new moon (Tsukamoto et al. 2003, Tsukamoto 2006). Glass eels caught in estuaries of Taiwan during the course of their upstream migration between Nov. and the following Mar. have been proven to come from different intra-annual cohorts which spawned in different months (Tzeng 1990). If the spawning time of the Japanese eel is inheritable, then genetic differenti-ation might occur within intra-annual cohorts due to temporal isolation. Heterogeneity of the genetic composition among arrival waves of intra-annual cohorts of the Japanese eel, however, has not been determined.
The aim of this study is to examine the genet-ic composition of 7 mgenet-icrosatellite loci among intra-annual cohorts of different arrival waves of Japanese glass eels. The population structure of intra-annual cohorts on a temporal scale is dis-cussed.
MATERIALS AND METHODS Sample collection
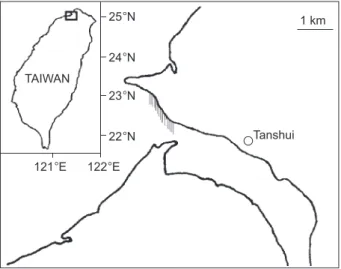
In total, 189 live Anguilla japonica glass eels were collected by fyke net from the Tanshui River estuary of northern Taiwan (121
°
25'E, 25°
10'N, Fig. 1) on 25 Nov. and 25 Dec. 2000, and 7 Feb. and 9 Mar. 2001 (Table 1). Glass eels were imme-diately preserved in 95% ethanol until DNA extrac-tion. The method to separate glass eels of the Japanese eel from those of other 2 eel species, namely A. marmorata and A. bicolor pacifica, fol-lowed Tzeng (1982) by pigmentation of the tail and the distance between the verticals through the anus and origin of the dorsal fin. Total length (± 0.1 mm) was measured before DNA extraction for the 4 different collecting times (Table 1).DNA extraction
Genomic DNA extraction was carried out from a small piece of muscle tissue of the glass eels. Extraction was done using a DNA purification and extraction kit (Bioman Scientific Ltd., Taiwan). Briefly, the ethanol was removed by evaporation before treatment. A piece of muscle weighing 20 mg was digested in 1 ml of lysis buffer (10 mM Tris-HCl, 2 mM EDTA, 10 mM NaCl, 1% sodium dodecyl sulfate, and 10 mg/ml dithiothreitol; pH 8.0) and 55 µl of proteinase K (0.5 mg/ml) for 1 h at 60
°
C after grinding. The solution was then applied to the spin column, washed with ethanolbuffer, eluted with 100 µl of TE buffer (10 mM Tris-HCl and 1 mM EDTA; pH 8.0), and stored at -20
°
C before the polymerase chain reaction (PCR).PCR and genotyping
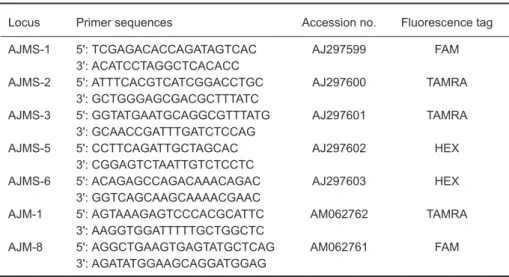
Seven microsatellite loci were selected based on Tseng et al. (2001 2006) including 6 (GT)n (AJMS-1, AJMS-3, AJMS-5, AJMS-6, AJM-1, and AJM-8) loci and 1 (GA)n (AJMS-2) locus (Table 2). Microsatellites were amplified via the PCR ducted in a 25 µl volume with the following con-tents: 0.5 µl of DNA template, 0.25 µl of Taq poly-merase, 1 µl of 10 µM forward and reverse primers, 2.5 µl of 10x PCR buffer, 0.5 µl of 10 mM dNTPs, and 19.25 µl of double-distilled (dd)H2O. Reverse primers contained either FAM, TAMRA, or HEX fluorescence labels for genotyping. PCR amplification procedures were as follows: initial denaturation at 94
°
C for 4 min followed by 35 cycles of denaturation at 94°
C for 30 s, annealing at 55-60°
C for 30 s, and extension at 72°
C for 30 s, followed by a final extension at 72°
C for 10 min. The PCR product, at 0.5 µl, was diluted with 12 µl of ddH2O for genotyping performed using a capil-lary MegaBACE-500 DNA analysis system (Amersham Biosciences). Data were scored by Genetic ProfilerTM vers. 1.5 (AmershamBiosciences), and the sizes of each allele were manually checked with the naked eye.
Data analysis
The total number of alleles (na), effective number of alleles (ne), and observed (HO) and expected (HE) heterozygosities were independent-ly calculated for each locus (Yang and Yeh 1993). Multilocus estimates for each of the 4 samples were calculated as well. Any deviations from
Fig. 1. Map showing the river mouth of the Tanshui River, northern Taiwan where the glass eels were caught. The shad-ed region indicates the position of the fyke net.
1 km Tanshui TAIWAN 121°E 122°E 25°N 24°N 23°N 22°N
Table 1. Sampling date, number of specimens, and mean total length of Japanese glass eels col-lected in the Tanshui River estuary
Date Sample size Total length (mm)
Mean ± SD Range 25 Nov. 2000 39 55.25 ± 2.16 50.68-58.62 25 Dec. 2000 50 54.67 ± 1.99 50.70-58.90 7 Feb. 2001 50 54.36 ± 2.58 47.38-60.10 9 Mar. 2001 50 55.23 ± 2.52 49.39-61.53 Total 189 54.88 ± 2.34 47.38-61.53
Hardy-Weinberg equilibrium (HWE) were calculat-ed with Genepop vers. 3.1 (Raymond and Rousset 1995). Genetic differentiation was estimated using ARLEQUIN vers. 2.0 software (Schneider et al. 2000). Wright,s (Weir and Cockerham 1984) fixa-tion index, FST, was calculated based on an infinite allele model, and the significance level was adjust-ed using the Bonferroni correction (Rice 1989). Nei,s (1983) unbiased genetic distance (Ds) was used to construct a phylogenetic tree using the Neighbor-joining (NJ) algorithm. Support for the tree nodes was assessed by bootstrapping over loci with 1000 replicates. The tree was built from raw allele frequency data using POPULATIONS 1.2.28. (Langella 2002) and visualized using TreeView (Page 1996). In addition, an individual assignment test based on Bayesian statistics was carried out using the software STRUCTURE 2.1 (Pritchard et al. 2000). This test calculates the number of foreign elvers (vagrants) from residents (members) of a particular group. Differences in the mean total length (± SD) between eel cohorts were examined by one-way analysis of variance (ANOVA).
RESULTS Genetic diversity
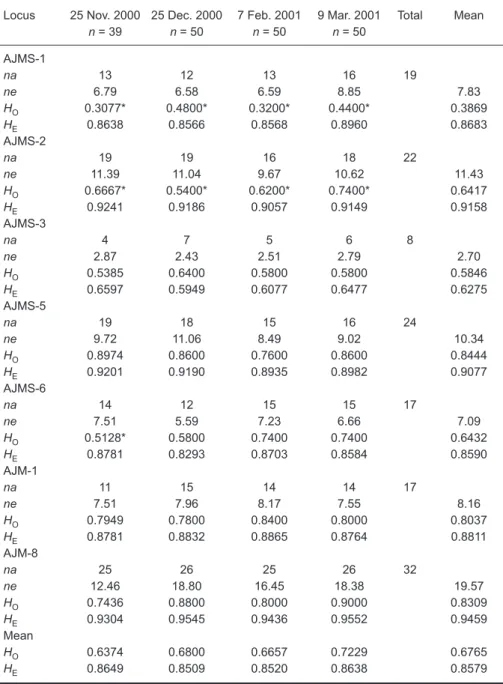
The mean total lengths among the 4 intra-annual cohorts did not significantly differ from each other (p = 0.173) (Table 1). Values of na, ne, HO,
HE, and the Hardy-Weinberg equilibrium (HWE) test of the 7 microsatellites loci from the 4
intra-annual eel groups are shown in table 3. All loci were polymorphic such that the total number of alleles ranged from 8 in locus AJMS-3 to 32 in locus AJM-8 with a total mean of 19.9. Three, 4, 5, and 6 private alleles were found in samples of Nov. 2000, Dec. 2000, Feb. 2001, and Mar. 2001, respectively. The private alleles may have been deduced from new genealogical mutations, slipped strand mispairings during DNA duplication, or crossovers during DNA recombinations (Goldstein and Schlotterer 1999). Observed and expected heterozygosities of each sample ranged 0.3077-0.9000 and 0.5949-0.9552 with means of 0.6765 and 0.8579, respectively. The HWE test showed that significant deviations occurred at the AJMS-1 and AJMS-2 loci for all eel groups and on 25 Nov. 2000 at locus AJMS-6 after applying the Bonferroni correction (Table 3). Loci AJMS-1 and AJMS-2 were thus excluded from the subsequent analyses.
Genetic distances and genetic differentiation among samples
The overall genetic differentiation among all samples was very low and not significant (FST = 0.0029, p = 0.173). Pair-wise FST values were smallest at -0.0010 between Feb. 2001 and Mar. 2001, and largest at 0.0111 between Nov. 2000 and Dec. 2000 (Table 4). No combinations were found to be significant except between samples of Nov. and Dec. 2000 (p = 0.008). Analysis of mole-cular variance (AMOVA) within and among the 4 intra-annual eel cohorts indicated that most of the total genetic variation was present within samples
Table 2. Characteristics of 7 microsatellite DNA loci of the Japanese eel
Locus Primer sequences Accession no. Fluorescence tag
AJMS-1 5': TCGAGACACCAGATAGTCAC AJ297599 FAM
3': ACATCCTAGGCTCACACC
AJMS-2 5': ATTTCACGTCATCGGACCTGC AJ297600 TAMRA
3': GCTGGGAGCGACGCTTTATC
AJMS-3 5': GGTATGAATGCAGGCGTTTATG AJ297601 TAMRA
3': GCAACCGATTTGATCTCCAG
AJMS-5 5': CCTTCAGATTGCTAGCAC AJ297602 HEX
3': CGGAGTCTAATTGTCTCCTC
AJMS-6 5': ACAGAGCCAGACAAACAGAC AJ297603 HEX
3': GGTCAGCAAGCAAAACGAAC
AJM-1 5': AGTAAAGAGTCCCACGCATTC AM062762 TAMRA
3': AAGGTGGATTTTTGCTGGCTC
AJM-8 5': AGGCTGAAGTGAGTATGCTCAG AM062761 FAM
(98.99%), and only 1.01% was present among samples (p < 0.01).
Genetic structure and assignment test
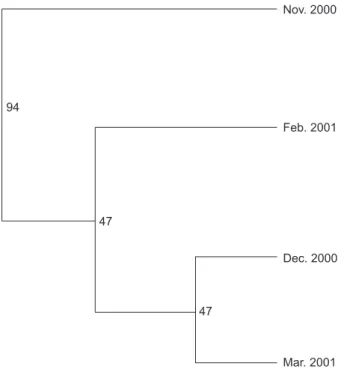
Figure 2 shows the NJ tree employing Nei,s unbiased genetic distances (Ds) between eel pop-ulations (Table 4) with robust bootstrap values
occurring between the samples of Nov. 2000 and all others. The glass eels from samples other than Nov. 2000 were phylogenetically close to each other with low bootstrap values.
Individual assignment tests based on Bayesian statistics with a 95% score were used to identify the origin of individuals. Among the 189 individuals in the 4 eel samples, the assignment
Table 3. Levels of genetic variation observed at 7 microsatellite loci: sam-ple size (n), observed (HO) and expected (HE) heterozygosity within sam-ples, and observed (na) and effective (ne) number of alleles. An asterisk (*) indicates a significant Hardy-Weinberg disequilibrium level at 5% adjusted by Bonferroni,s correction
Locus 25 Nov. 2000 25 Dec. 2000 7 Feb. 2001 9 Mar. 2001 Total Mean
n = 39 n = 50 n = 50 n = 50 AJMS-1 na 13 12 13 16 19 ne 6.79 6.58 6.59 8.85 7.83 HO 0.3077* 0.4800* 0.3200* 0.4400* 0.3869 HE 0.8638 0.8566 0.8568 0.8960 0.8683 AJMS-2 na 19 19 16 18 22 ne 11.39 11.04 9.67 10.62 11.43 HO 0.6667* 0.5400* 0.6200* 0.7400* 0.6417 HE 0.9241 0.9186 0.9057 0.9149 0.9158 AJMS-3 na 4 7 5 6 8 ne 2.87 2.43 2.51 2.79 2.70 HO 0.5385 0.6400 0.5800 0.5800 0.5846 HE 0.6597 0.5949 0.6077 0.6477 0.6275 AJMS-5 na 19 18 15 16 24 ne 9.72 11.06 8.49 9.02 10.34 HO 0.8974 0.8600 0.7600 0.8600 0.8444 HE 0.9201 0.9190 0.8935 0.8982 0.9077 AJMS-6 na 14 12 15 15 17 ne 7.51 5.59 7.23 6.66 7.09 HO 0.5128* 0.5800 0.7400 0.7400 0.6432 HE 0.8781 0.8293 0.8703 0.8584 0.8590 AJM-1 na 11 15 14 14 17 ne 7.51 7.96 8.17 7.55 8.16 HO 0.7949 0.7800 0.8400 0.8000 0.8037 HE 0.8781 0.8832 0.8865 0.8764 0.8811 AJM-8 na 25 26 25 26 32 ne 12.46 18.80 16.45 18.38 19.57 HO 0.7436 0.8800 0.8000 0.9000 0.8309 HE 0.9304 0.9545 0.9436 0.9552 0.9459 Mean HO 0.6374 0.6800 0.6657 0.7229 0.6765 HE 0.8649 0.8509 0.8520 0.8638 0.8579
test indicated that a mean 14.3% of individuals were members of each cohort, while 85.7% of indi-viduals were foreign recruits (vagrants) (Fig. 3). Each sample contained a high mixing rate (60%-92%) of foreign recruits.
DISCUSSION
Values of HO for genetic variability of the Japanese eel among spatial (Tseng et al. 2006), inter-annual (Tseng et al. 2003), and intra-annual (this study) samples were 0.758, 0.708, and 0.677, respectively. This indicates that genetic differenti-ation was highest among samples from different locations, intermediate among annual cohorts of the same habitats, and lowest among intra-annual cohorts of the same habitats. Several lines of evi-dence support the Japanese eel, although exhibit-ing spatial genetic differentiation, still beexhibit-ing geneti-cally stable temporally at the same location. First, the overall temporal genetic variation among arrival waves of elvers in consecutive months of the same habitat was not significant. Pair-wise FST values showed that only the pair of samples between Nov. and Dec. 2000 exhibited subtle but significant genetic variation. This might have been due to the phenomenon of genetic patchiness, in which random variations in parental contributions
of reproductive activity result in a heterogeneous genetic composition of offspring (Maes et al. 2006). Second, based on the individual assign-ment test, high percentages (60%-92%) of elvers were not correctly assigned to their original sam-ples, indicating the high mixing rate among intra-annual cohorts. Third, the phylogenetic tree exhib-ited low bootstrap values among intra-annual cohorts except samples from Nov. 2000, indicating the generally high genetic identity among arrival waves. These results suggest that there is no overall significant genetic variation among recruits within years.
The high rate of larval mixing among recruits may be related to the hydrographic features of Pacific Ocean currents. Although the spawning of the Japanese eel is synchronized once a month around the new moon (Tsukamoto et al. 2003, Tsukamoto 2006), the long dispersal time (4-6 mo) of the leptocephali, which may be due to the larval behavior and their diverse positions in the NEC where current velocities differ, provide the condi-tions needed for larval mixing between intra-annu-al cohorts. Indeed, the birthdates of previous arrival waves of glass eels caught in Taiwanese estuaries partially overlapped with those of the next arrival wave (Tzeng 1990), supporting the phenomenon of potential larval mixing. The lack of an IBT pattern from either inter-annual (Tseng et al. 2003) or among intra-annual arrival waves (this study) indicates the stable temporal genetic struc-ture between progenies and ancestors in the same geographic region. Plasticity of the maturation age and spawning time together with the high larval mixing in the Japanese eel may hinder the occur-rence of genetic differentiation in the same habitat.
Significant spatial genetic differentiation was found in the European eel, which either fits the IBD hypothesis (Wirth and Bernatchez 2001, Maes and Volckaert 2002) or does not (Dannewitz et al.
Table 4. Pairwise FST (below the diagonal) and Nei,s unbiased genetic distance (Ds) (above the diagonal) values between the 4 eel samples. *The significance level was 0.05
Date Nov. 2000 Dec. 2000 Feb. 2001 Mar. 2001
Nov. 2000 0.1223 0.0905 0.0884 Dec. 2000 0.0111* 0.0569 0.0468 Feb. 2001 0.0052 0.0012 0.0475 Mar. 2001 0.0044 -0.0009 -0.0010 Overall FST= 0.0029, p = 0.173. Nov. 2000 Feb. 2001 Dec. 2000 Mar. 2001 47 47 94
Fig. 2. Neighbor-Joining tree depicting genetic relationships based on Nei,s unbiased genetic distances among the 4 intra-annual cohorts.
2005). The Japanese eel is clearly spatially distin-guished into 2 groups. However, this does not support the IBD migration model. For American eels, Wirth and Bernatchez (2003) found weak but significant spatial genetic differentiation which did not support IBD, which meant that the panmixia hypothesis could not be fully rejected. These results infer that spatial genetic variation seems to be highest in the European eel, intermediate in the Japanese eel, and lowest in the American eel. On the other hand, IBT was found in inter-annual cohorts of the European eel (Maes et al. 2006), and genetic patchiness was observed among inter-and intra-annual cohorts (Pujolar et al. 2006). No significant temporal genetic differentiation was suggested in the Japanese eel (Tseng et al. 2003, this study). This further supports higher genetic differentiation in the European eel than in the Japanese eel, both spatially and temporally. The reason may be due to the longer times and dis-tances for the spawning migration of adults and dispersal of larvae in the European eel than in the Japanese or American eels (Wang and Tzeng 1998). The migration distances are longest for the European eel (4000-8000 km), intermediate for the
Japanese eel (2000-3500 km), and shortest for the American eel (900-3000 km) (Aoyama et al. 2003, Tesch 2003). The longer migration distances are coincident with higher genetic differentiation in the 3 eel species. The oceanic factors and climatic variations that the European eel faces are more complicated than those faced by the other 2 eels, causing higher isolation and lower gene flow between spawning groups. This may have pro-moted genetic differentiation of the European eel. Consequently, the Japanese, American, and European eels have evolved their own particular genetic structures based on their own adaptations to the unique oceanic current systems of the respective Pacific and Atlantic Oceans.
In conclusion, the population genetic structure of the Japanese eels examined, based on microsatellite loci, exhibited no significant genetic differentiation among intra-annual cohorts. Although the Japanese eel can be spatially divided into 2 management units, the genetic structures of inter- and intra-annual cohorts in each habitat were temporally stable.
Acknowledgments: The authors express their gratitude to Ms. H.Y. Teng and Drs. C.W. Chang and Y.T. Wang for collecting specimens from Taiwan. Research funding was provided to W.N. Tzeng by the National Science Council, Executive Yuan, Taiwan (NSC 94-2313-B-002-070) and the Council of Agriculture, Executive Yuan, Taiwan (94 AS-14.12-FA-F1(5)).
REFERENCES
Aoyama J, S Wouthuyzen, MJ Miller, T Inagaki, K Tsukamoto. 2003. Short-distance spawning migration of tropical freshwater eels. Biol. Bull. 204: 104-108.
Avise JC. 2003. Catadromous eels of the North Atlantic: a review of molecular genetic findings relevant to natural history, population structure, speciation, and phylogeny.
In Aida K, Tsukamoto K, Yamauchi K, eds. Eel Biology.
Tokyo: Springer-Verlag, pp. 31-48.
Avise JC, GS Helfman, NC Saunders, LS Hales. 1986. Mitochondrial DNA differentiation in North Atlantic eels: population genetic consequences of an unusual life histo-ry pattern. Proc. Natl. Acad. Sci. USA 83: 4350-4353. Cheng PW, WN Tzeng. 1996. Timing of metamorphosis and
estuarine arrival across the dispersal range of the Japaneseeel Anguilla japonica. Mar. Ecol.-Prog. Ser. 131: 87-96.
Dannewitz J, GE Maes, L Johansson, H Wickström, FAM Volckaert. 2005. Panmixia in the European eel: a matter of time. Proc. R. Soc. Lond. B 272: 1129-1137.
De Ligny W, EM Pantelouris. 1973. Origin of the European eel. Nature 246: 518-519.
Goldstein DB, C Schlotterer. 1999. Mechanistic basis for Fig. 3. Assignment test (95% score) among eel groups in the 4
mo sampled. The black and gray pies indicate the percentage of foreign (vagrant) and resident (member) elvers, respectively.
Nov. 2000 77% 88% 92% 84% Dec. 2000 Feb. 2001 Mar. 2001
microsatellite instability. In Microsatellites: evolution and applications. Oxford, UK: Oxford Univ. Press, pp. 34-48. Han YS, IC Liao, YS Huang, JT He, CW Chang, WN Tzeng.
2003. Synchronous changes of morphology and gonadal development of silvering Japanese eel Anguilla japonica. Aquaculture 219: 783-796.
Ishikawa S, J Aoyama, K Tsukamoto, M Nishida. 2001. Population structure of the Japanese eel Anguilla japonica as examined by mitochondrial DNA sequencing. Fish. Sci. 67: 246-253.
Langella O. 2002. POPULATIONS 1.2.28. CNRS UPR9034. Lintas C, J Hirano, S Archer. 1998. Genetic variation of the
European eel Anguilla anguilla. Mol. Mar. Biol. Biotech. 7: 263-269.
Maes GE, JM Pujolar, B Hellemans, FAM Volckaert. 2006. Evidence for isolation by time in the European eel (Anguilla anguilla L.). Mol. Ecol. 15: 2095-2107.
Maes GE, FAM Volckaert. 2002. Clinal genetic variation and isolation by distance in the European eel Anguilla anguilla (L.). Biol. J. Linn. Soc. 77: 509-521.
Nei M. 1983. Genetic polymorphism and the role of mutation in evolution. In M Nei, R Koehn, eds. Evolution of genes and proteins. Sunderland, MA: Sinauer Associates, pp. 165-190.
Page RDM. 1996. TreeView: an application to display phylo-genetic trees on personal computers. Comp. Appl. Biosci. 12: 357-358.
Pritchard JK, M Stephens, P Donnelly. 2000. Inference of pop-ulation structure using multilocus genotype data. Genetics 155: 945-959.
Pujolar JM, GE Maes, FAM Volckaert. 2006. Genetic patchi-ness among recruits in the European eel Anguilla
anguilla. Mar. Ecol.-Prog. Ser. 307: 209-217.
Raymond M, F Rousset. 1995. An exact test for population dif-ferentiation. Evolution 49: 1280-1283.
Rice WR. 1989. Analyzing tables of statistical tests. Evolution 43: 223-225.
Sang TK, HY Chang, CT Chen, CF Hui. 1994. Population structure of the Japanese eel Anguilla japonica. Mol. Biol. Evol. 11: 250-260.
Schneider S, D Roessli, L Excoffier. 2000. Arlequin: a software for population genetics data analysis. Vers. 2.000. Geneva, Switzerland: Genetics and Biometry Lab, Department of Anthropology, Univ. of Geneva.
Sinclair M. 1988. Marine populations: an assay on population regulation and speciation. Seattle, WA: Univ. of Washington Press.
Tesch FW. 2003. The eel. Oxford, UK: Blackwell Science. Tseng MC, CA Chen, HW Kao, WN Tzeng, SC Lee. 2001.
Polymorphisms of GA/GT microsatellite loci from Anguilla
japonica. Mar. Biotechnol. 3: 275-280.
Tseng MC, WN Tzeng, SC Lee. 2003. Historical decline in the Japanese eel Anguilla japonica in northern Taiwan inferred from genetic variations. Zool. Stud. 42: 556-563. Tseng MC, WN Tzeng, SC Lee. 2006. Population genetic
structure of the Japanese eel Anguilla japonica in the northwest Pacific Ocean: evidence of non-panmictic pop-ulations. Mar. Ecol.-Prog. Ser. 308: 221-230.
Tsukamoto K. 1992. Discovery of the spawning area for Japanese eel. Nature 356: 789-791.
Tsukamoto K. 2006. Spawning of eels near a seamount. Nature 439: 929.
Tsukamoto K, T Otake, N Mochioka, TW Lee, H Fricke, T Inagaki, J Aoyama, S Ishikawa, S Kimura, MJ Miller, H Hasumoto, M Oya, Y Suzuki. 2003. Seamounts, new moon and eel spawning: the search for the spawning site of the Japanese eel. Environ. Biol. Fish. 66: 221-229. Tzeng WN. 1982. New record of the eel, Anguilla
celebesen-sis Kaup, from Taiwan. Bioscience 19: 57-66.
Tzeng WN. 1985. Immigration timing and activity rhythms of the eel, Anguilla japonica, elvers in the estuary of northern Taiwan, with emphasis on environmental influences. Bull. Jpn. Soc. Fish. Oceanogr. 47/48: 11-28.
Tzeng WN. 1986. Resources and ecology of the Japanese eel
Anguilla japonica elvers in the coastal waters of Taiwan.
China Fish. Month. 404: 19-24. (in Chinese)
Tzeng WN. 1990. Relationship between growth rate and age at recruitment of Anguilla japonica elvers in a Taiwan estuary as inferred from otolith growth increments. Mar. Biol. 107: 75-81.
Tzeng WN, HR Lin, CH Wang, SN Xu. 2000. Differences in size and growth rates of male and female migrating Japanese eels in Pearl River, China. J. Fish Biol. 57: 1245-1253.
Wang CH, WN Tzeng. 1998. Interpretation of geographic vari-ation in size of American eel Anguilla roatrata elvers on the Atlantic coast of North American using their life history and otolith ageing. Mar. Ecol.-Prog. Ser. 168: 35-43. Weir BS, CC Cockerham. 1984. Estimating F-statistics for the
analysis of population structure. Evolution 38: 1358-1370.
Wirth T, L Bernatchez. 2001. Genetic evidence against pan-mixia in the European eel. Nature 409: 1037-1040. Wirth T, L Bernatchez. 2003. Decline of North Atlantic eels: a
fatal synergy. Proc. R Soc. Lond. 270: 681-688.
Yang RC, FC Yeh. 1993. Multilocus structure in Pinus contoria Dougl. Theor. Appl. Genet. 87: 568-576.