Investigations and Prediction of Vegetation changes and
Corresponding Sediment transport Characteristics in Guandu
Nature Reserve
Shang- Shu Shih
Ph.D. student, Department of Civil Engineering, National Taiwan University, Taipei 106, Taiwan (Corresponding Author: d90521017@ntu.edu.tw)
Hong- Yuan Lee
Professor, Department of Civil Engineering, National Taiwan University, Taipei 106,
Taiwan
Abstract
The aerial photographs from 1986 to 2002 were used to analyze and predicted the
temporal and spatial variations of the vegetation changes in Guandu Nature Reserve.
The results revealed that the marsh habitat, dominated by
Cyperus malaccensis Lam.and
Phragmites communis (L.) Trin, has changed into a swamp habitat, dominated by
Kandelia candel (L.)
. The coverage area of
Kandelia candel (L.)has increased from 7.2
hectares in 1986 to 23.8 hectares in 2002. It causes significant impacts upon the
ecosystem and flood control operations. GIS-based technique has been used to
determine the vegetation changes
inthis area. TABS-2, a horizontal two dimensional
sediment transport simulation model, can be utilized to evaluate the sediment
transport characteristics of this estuarine wetland.
The Shannon’s diversity index decreased from 0.98 in 1986 to 0.77 in 2002.
Additionally, the Shannon’s evenness index also decrease form 0.77 in 1986 to 0.5 in
2002. We have concluded that the habitat diversity became lower and lower and will
be unbenefited to water birds.
Significant sediment deposition occurs due to the extensive root network of Kandelia
candel (L.) Druce. The average deposition is about 33 mm during a 200 years return period
flood event. Removal of Kandelia candel (L.) Druce is able to reduce the sediment deposition rate. When the removal ratio reaches 20%, the reduction in sediment deposition is about 5 mm. It is also found that mangrove remove will improve the ecological restoration of Uca
(Thalassuca) Formosensis Rathbun which is an endemic species of the fiddler crab in Taiwan.
Keywords:intertidal wetland, vegetation change, sediment transport simulation,
1. Introduction
Coastal wetlands are widely distributed in estuaries throughout the world. Because of the tremendous volumes and varieties of inhabiting plants, they are regarded as being among the most productive ecosystems (Teal, 1962; Day et al., 1989). They are known to provide food sources and diverse habitats for large numbers of resident and migratory organisms. Wetlands have also been shown to be very efficient in removal of nutrients from agricultural runoff (Comín et al., 2001). The Guandu Natural Reserve (25o 07’ N, 121o 027’ E) lies in the west of the Guandu floodplain, which is located in the confluence of the Keelung and Tanshui Rivers, approximately ten kilometers from the river mouth, near Taipei, Taiwan(see also Fig. 1). The increase of Kandelia candel (L.) Druce cover has some adverse effects on the river hydraulic characteristics, including velocity retardation, increase of water surface elevation and sediment deposition. Increased roughness coefficient of the river leading to a higher mean water surface elevation (Chow, 1973; Lee and Shih, 2004).The original types of plant in this area are shrubs and trees adapted to the harsh seashore environment, having large and smooth leaves. Moreover, the thick inner tissues and well-developed cuticles of these plants allow them to reduce water evaporation. These plants also have special protective features against the salty environment. Some of these plants are oceanic drift plants, whose lightweight and fibrous fruits ride ocean currents and take root in faraway places. Analysis of aerial photographs taken from 1986 to 2002 revealed that the marsh habitat has changed into a swamp wetland habitat.
2. Material and methods
(1) GIS-base technique
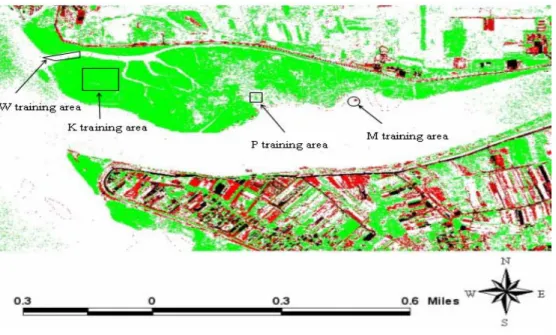
The aerial photographs of Gunandu mangrove wetland from 1986 to 2002 (see detail in Table 2) have been employed in this study to evaluate the temporal and spatial vegetation variations. Both unsupervised and supervised classification methods of GIS-based technique (Duda and Canty, 2002; Hong and Chen, 1994) were applied and classification results are shown as Fig.2. The accuracy of this auto-detecting result was also calculated in Table2. The classification results are well obviously cause of the accuracy of auto-detecting can exhibit more than 83%.
(2) Numerical Simulation
The TABS-2 model is a two dimensional, depth-averaged, finite element hydrodynamic numerical model developed by the Waterways Experiment Station of U.S. Army Corps of Engineers. It computes water surface elevation and horizontal velocity components for subcritical, free-surface flow in two-dimensional flow fields. TABS-2 also computes a finite
element solution of the Reynolds form of the Navier-Stokes equations for turbulent flows. Friction is calculated according to the Manning or the Chézy equation, and eddy viscosity coefficients are used to define turbulence characteristics. Both steady and unsteady state problems can be analyzed. Please refer to SMS 7.0 User’s manual (2000) for more details.
The Manning’s n represents degree of the energy loss caused by the riverbed and riverbank roughness. Many studies investigated this roughness coefficient (Chow, 1973; Shoji Fukuoka et al., 1991). In this study, some findings of Lee and Shih’s (2004) study were used to estimate the values of n and then the numerical model parameters were calibrated and verified using the experimental data conduced by the Water Resources Agency in Taiwan (1996).
The Manning’s n increase with increasing return period flood and reaches to a maximum value of 0.283 when the return period flood equals to 20 years.
According to the data provided by the User’s Manual of TABS-2, the eddy viscosity coefficient in the mangrove wetland and rest of the study sites have been selected as 5000 (N•sec/m2) and 2000 (N•sec/m2), respectively.
The finite element mesh generated from the digital maps defines only the x and y coordinates for the numerical node. The bathymetric information thus can be surveyed using field data and interpolated onto the finite element mesh. The x, y and z coordinates of this study site were provided based on the field data surveyed by the Water Resources Agency in 2003 and adjusted using the Taipei Government 1:5000 DTM data.
The upstream and downstream boundary conditions used in TABS-2’s sediment transport simulations are provided in Fig. 4, 5 and 6, respectively (Water Resources Agency, Taiwan, 1996; Lee and Shih, 2004).
3. Results and discussions
(1) Vegetation changes
The temporal variation of mangrove spread from 1986 to 2002 in Guandu mangrove wetland was shown in Fig.7. The landscape coverage area, including mangrove, reed, mudflat and tidal slough, were also calculated and shown in Fig.8, 9, 10 and 11 compared with literature review ( Lin, 1994; Wang, 1999 ; Hsu et al., 1994).
The spatial changing of vegetation reveals that mangrove spread from western to
eastern part of this wetland (downstream to upstream). The tidal slough and mudflat
which were important habitat type to waterfowls reduce year by year.
The Shannon’s diversity index decreased from 0.98 in1986 to 0.77 in 2002.
Additional, the Shannon’s evenness index also decrease form 0.77 in 1986 to 0.5 in
2002 (see also Fig. 12). We have concluded that the habitat diversity became lower
and lower and will be unbenefited to water birds.
The prediction of mangrove growth was shown in Fig. 13. The trend exhibits that
mangrove coverage area will increase to 38.1 hectare in 2010 and 42.3 hectare in
2013 (occupied whole Nature Reserve), respective, without any thinning. It was
therefore suggested that we should take action to prevent this worse condition carry
on as soon as possible.
(2) Sediment transport simulation
Spatial variations of the riverbed elevations are provided in Fig. 14. The sediment transport simulations revealed that sediment deposition occurred in most of the 12 cross-sections, and thus the riverbed elevation increased after 46 hours of simulation. The sediment deposition depth ranged between 10.45 mm to 122.65 mm. We can conclude that mangroves will cause significant sediment deposition.
Furthermore, sediment transport simulations under four different mangrove removal ratios were also investigated. Riverbed deposition ranged between 10.5 mm and 122.7 mm, with the average value equals to 33.0 mm. The reduction in sediment deposition is about 5 mm when the removal ratio reaches 20%. Long-term sediment transport simulation is still under investigation.
4. Figures & Tables
Fig. 2 The results of unsupervised classification of vegetation cover in Guandu mangrove wetland.
Fig. 3 TABS-2 mesh grid of the study site. The TABS-2’s mesh grid of study site. The above and below plots are the Tanshui River System and Guandu mangrove wetland, respectively. The twelve cross-sections site of Guandu mangrove wetland which were used to calculate the bed elevation changes. The numbers of twelve cross-sections were assigned orderly sequentially from upstream to downstream of Keelung River.
0 2000 4000 6000 8000 10000 12000 14000 0 10 20 30 40 50 Time (hr) D is ch arg e (c m s) Keelung River Hsin-Dan Creek Da-Han Creek
Fig.4 The 200-year flood hydrograph of Tanshui River System.
1.95 2 2.05 2.1 2.15 2.2 2.25 2.3 2.35 0 5 10 15 20 25 30 35 40 45 50 Time (hr) w ater s ur face el ev atio n (m )
Fig. 5 Temporal variations of the water surface elevations at the river mouth during a 200 years flood event.
0.0 0.2 0.4 0.6 0.8 1.0 1.2 1.4 0 5 10 15 20 25 30 35 40 45 50 Time (hr) Concentration (ppt ) Keelung River Hsin-Dan Creek Dan-Han Creek
Fig.6 The upstream sediment supplies of the Tanhsui River System, which includes. Keelung River, Hsin-Dan Creek and Dan-Han Creek, respectively.
Fig.7 The temporal variation of mangrove spread from 1986 to 2002 in Guandu mangrove wetland. 1986 1997 1998 2001 2002
The coverage area of K. candel 0 5 10 15 20 25 1975 1980 1985 1990 1995 2000 2005 year ar ea ( h a) Lin, 1994 Wang, 1999
Hsu et al., 1999 This study
Fig.8
The temporal variation of mangrove coverage area
in Guandu mangrove wetland.
The results of this study also been compared with literature review.
The coverage area of Phragmites
0 5 10 15 20 25 1975 1980 1985 1990 1995 2000 2005 year ar ea ( h a)
Lin, 1994 Wang, 1999 This study
Fig.9 The temporal variation of reed coverage area in Guandu mangrove wetland. The results of this study also been compared with literature review.
The coverage area of mudflat
0 5 10 15 20 25 30 35 1975 1980 1985 1990 1995 2000 2005 year ar ea ( h a)
Lin, 1994 This study
Fig.10
The temporal
variationof mudflat coverage area
in Guandu mangrove wetland.
The results of this study also been compared with literature review.
T he coverage area of tidal slough 0 2 4 6 8 10 12 1975 1980 1985 1990 1995 2000 2005 year ar ea ( h a)
Lin, 1994 This study
Fig.11 The temporal variation of tidal slough coverage area in Guandu mangrove wetland. The results of this study also been compared with literature review.
Temporal landscape pattern index
0 0.2 0.4 0.6 0.8 1 1.2 1984 1986 1988 1990 1992 1994 1996 1998 2000 2002 2004 year inde x va lu e
Shannon diversity index Shannon evenness index Dominance index
Fig.12
The landscape index variation of
Guandu mangrove wetland from 1986 to 2002.
The coverage area of K. candel
y = 1.2973x - 2569.5 R2 = 0.9105 0 5 10 15 20 25 30 1982 1984 1986 1988 1990 1992 1994 1996 1998 2000 2002 year area (ha)
0 20 40 60 80 100 120 140 -400 -300 -200 -100 0 100 200 300 400 cross-sectional distance (m) bed elevat ion changes (m m )
sec #1 sec #2 sec #3 sec #4 sec #5 sec #6
sec #7 sec #8 sec #9 sec #10 sec #11 sec #12
Fig. 14 Spatial variations of the riverbed
elevation
under a 200-year flood in the Guandu mangrove wetlandTable2 The information of study area of aerial photograph
Study area Year Accuracy
Guandu 1986 0.5m* 0.5m Guandu 1997 0.5m* 0.5m Guandu 1998 0.5m* 0.5m Guandu 2000 0.5m* 0.5m Guandu 2001 0.5m* 0.5m Guandu 2002 0.5m* 0.5m
Table2 The accuracy of GIS-based auto-detecting technique
Item True value (m2) Measured value(m2) Absolute error (m2
) Relative error (%)
Mangrove area 285,802 238,184 47,618 16.7
*
Absolute error:∆A=Am−At ; Relative error:
( )
% = ∆ ×100%t A A A
5. References
Comín F.A., J. A. Romero, O. Hernández and M. Menéndez, 2001. Restoration of wetlands from abandoned rice fields for nutrient removal, and biological community and landscape diversity. Restoration Ecology 9(2): 201-208 pp.
Chow, V.T., 1973. Open-Channel Hydraulics, MacGraw_Hill International Editions.
Duda T. and Canty M. J., 2002, Unsupervised classification of satellite imagery: choosing a good algorithm, Int. J. Remote Sensing 23(11), pp. 2193–221.
Froneman A., M.J. Mangnall, R.M. Little and T.M. Crowe, 2001. Waterbird assemblages and associated habitat characteristics of farm ponds in the Western Cape. South Africa.
Biodiversity and Conservation 10: 251-270.
Hong S.Y. and C.J. Chen, 1994. GIS-based technique and remote sensing technique application on land-use classification in Western-South coast, Taiwan, Essays of the conference on coastal wetlands ecology and conservation, pp.180-195.
Hsu M.H., C.R. Wu and J.C. Fu, 1999. The influence of mangrove growth on flood stage of Keelung River, Journal of Chinese Agriculture Engineering 45(2):1-10.
Hulshoff R. M., 1995. Landscape indices describing a Dutch landscape, Landscape Ecology, vol. 10 no. 2 pp 101-111.
Lee, H.Y. and S.S. Shih, 2004. Impacts of vegetation changes on the hydraulic and sediment transport characteristics in Guandu mangrove wetland, Ecological Engineering 23(2):85-94. Li H. and J. F. Reynolds, 1993. A new contagion index to quantify spatial patterns of landscapes, Landscape Ecology, vol. 8 no. 3 pp 155-162.
Li, R.m. and H.W. Shen, 1973. Effect of Tall Vegetations on flow and sediment. Journal of
Hydraulic Division, ASCE, 99:793-814 pp.
Lin M.C., 1994. The relations between landscape changes and avian communities in Guandu, Taiwan, Master degree thesis, National Taiwan University.
Lin, H.J., K.T. Shao, W.L. Chow, C.J.W. MAA, H.L. Hsieh, W.L. Wu, L.L. Severinghaus and W.T. Wang, 2003. Biotic communities of freshwater marshes and mangroves in relation to saltwater incursions: implications for wetland regulation. Biodiversity and Conservation 12: 647-665 pp.
Moisen, G.G., T.S. Frescino, 2002, Comparing five modeling techniques for predicting forest characteristics, Ecological Modeling 157, pp.209-225.
Shoji Fukuoka and Koh-ichi Fujita, 1991. Flow Resistence due to the Momentum Transport Caused by Submerged Vegetation in the River Course, IAHR, pp9-13.
SMS 7.0 User’s manual, 2000. Open-Channel Flow and Sedimentation. Environmental Modeling Research Laboratory, Brigham Young University.
Taipei City Government, 2000. The management research report of Guandu Natural Park and Guandu Natural Reserve (II), Taiwan, R.O.C.
Teal, J.M., 1962. Energy flow in the salt marsh ecosystem of Georgia. Ecology 43: 614–624. Wang, I.C., 1999, An ecological study of estuarine wetlands-A case study of the changing vegetations of Guandu mangrove swamp, Master degree thesis, National Taiwan University. Water Resources Agency, Taiwan, 1996. The hydraulic model study of Tanshui River System and Taipei flood protection project, Taiwan, R.O.C.