應用芬頓法降解四環素及其反應機制之研究
70
0
0
全文
(2) 論文口試委員審定書. i.
(3) 摘要 四環素(Tetracycline)是一種廣效性抗生素,因其抗菌範圍廣泛,除了常被用於 治療人類疾病的藥物,也做為養殖漁業的藥浴或畜牧產業飼料添加劑,以預防疾病 感染及提高生長速度,因此在自然水體及廢水中經常檢測出四環素的成分,使其成 為廣受關注的新興污染物之一。根據前人研究顯示,四環素曾於廢水處理廠中被檢 測出來,而較常見的處理方式有物理性活性碳吸附去除法及薄膜過濾法和化學氧 化法處理。截至目前為止已有研究團隊針對光芬頓法及電芬頓法對含有四環素的 廢水進行降解,雖然效果幾乎達到完全降解及礦化,但現地應用上較耗能且難以將 此方法用於大規模的水體。另外,過去研究顯示,芬頓法在酸性環境下有良好的降 解效率,但是要調整大規模水體的酸鹼值較為困難,增加現地應用的困難度,且廢 水中通常含有多種可能影響芬頓法的有機共溶質。爰此,本研究旨在探討芬頓法試 劑濃度以及共溶質分別在酸性及中性環境下對芬頓法降解四環素的影響,除了傳 統芬頓法之外,本研究亦應用探討過一硫酸鹽(peroxymonosulfate, PMS)和過二硫酸 鹽(peroxydisulfate, PDS)透過亞鐵離子活化並降解四環素,並比較不同氧化劑對降 解效率的影響。 實驗結果顯示,芬頓試劑濃度越高,降解效率越高,在酸性環境下降解效率達 到 79.6%,而在中性環境下達到 46.7%。比較不同氧化劑影響降解的實驗中,過氧 化氫顯示最佳的去除效果,且 PMS 的氧化能力略高於 PDS。在酸性條件下當共溶 質存在時,環糊精及腐植酸在 50 M 的芬頓試劑濃度下可提高四環素的降解效率, 但將過氧化氫的濃度提高至 100 M 時,於共溶質存在下四環素降解減少,表示因 為共溶質消耗的氫氧自由基多於生成。在中性環境下,共溶質會與四環素結合,在 ii.
(4) 反應過程中結合的分子會將四環素釋回溶液中,造成觀察到的降解效率有下降的 趨勢。. 關鍵字:高級氧化、有機共溶質、芬頓法、四環素、新興污染物. iii.
(5) ABSTRACT Tetracycline has been detected oftentimes in wastewater and natural water bodies. Previous studies showed high levels of removal efficiency of organic contaminants by Fenton process in the acidic environment, which, however, seemed impractical because of the infeasibility of pH adjustment. Meanwhile, wastewater usually contains a variety of NOMs that may affect the efficiency of the Fenton process. Thus, the present study aimed to investigate the effects of experimental parameters and coexisting organic materials on the degradation of tetracycline by Fenton process in the acidic and neutral environment. In addition to the classic Fenton process, the degradation process by peroxymonosulfate (PMS) and peroxydisulfate (PDS), that could also be activated by the ferrous ions, was also applied to the removal of tetracycline, and the degradation efficiencies from different oxidation processes were compared. The results showed that the higher Fenton reagent concentrations led to a higher degradation efficiency, which was up to 79.6% in acidic condition, and decreased to 46.7% in neutral condition. Among the investigated oxidants, hydrogen peroxide showed the best removal and PMS demonstrated a stronger oxidizing ability than PDS. At the presence of coexisting organic macromolecules, the overall degradation efficiency decreased with the magnitude of 510%. The -cyclodextrin enhanced the degradation efficiency at the reagent concentrations of 50 M both for ferrous ion and hydrogen peroxide in acidic condition. The tetracycline degradation was found decreasing at the presence of macromolecules, implying that the macromolecules consumed more •OH than produced.. Keywords: Advanced oxidation process, Coexisting organic macromolecules, Degradation, Fenton process, Tetracycline iv.
(6) CONTENTS 論文口試委員審定書 ........................................................................................................i 摘要 .................................................................................................................................. ii ABSTRACT .....................................................................................................................iv CONTENTS ......................................................................................................................v LIST OF FIGURES ....................................................................................................... viii LIST OF TABLES .............................................................................................................x Chapter 1. Introduction ..............................................................................................1. 1.1. Background .....................................................................................................1. 1.2. Research objectives ........................................................................................3. Chapter 2 2.1. 2.2. 2.3. Literature Review ....................................................................................4 Tetracycline antibiotics ...................................................................................4. 2.1.1. Emerging Contaminants ........................................................................4. 2.1.2. Tetracycline antibiotics..........................................................................4. 2.1.3. Environmental hazards caused by tetracycline antibiotics ....................5. 2.1.4. Tetracycline ...........................................................................................5. The treatment of wastewater containing tetracycline .....................................6 2.2.1. Activated carbon adsorption..................................................................6. 2.2.2. Biological treatment ..............................................................................6. 2.2.3. Membrane filtration...............................................................................7. Fenton process (Chemical oxidation method) ................................................7 2.3.1. Fenton process by H2O2/Fe(II) ..............................................................7. 2.3.2. Photo-Fenton process ............................................................................9. 2.3.3. Electro-Fenton process ..........................................................................9 v.
(7) 2.4. Persulfate ........................................................................................................9 2.4.1. Fe2+ activated PDS oxidation process .................................................10. 2.4.2. Fe2+ activated PMS oxidation process ................................................. 11. 2.5. Natural organic matter ..................................................................................13 2.5.1. Natural organic matter in water bodies ...............................................13. 2.5.2. Citric acid ............................................................................................13. 2.5.3. Humic substance .................................................................................14. 2.5.4. Cyclodextrin ........................................................................................15. Chapter 3. Materials and Methods ..........................................................................16. 3.1. Research Framework ....................................................................................16. 3.2. Chemicals and apparatus ..............................................................................17 3.2.1. Experimental chemicals and materials ................................................17. 3.2.2. Experimental equipment .....................................................................18. 3.3. Experimental procedures ..............................................................................19 3.3.1. Experimental process ..........................................................................19. 3.3.2. Experimental solutions preparation .....................................................20. 3.3.3. Analytical methods ..............................................................................20. 3.3.4. Experimental procedures .....................................................................22. Chapter 4 4.1. 4.2. Results and Discussion ...........................................................................23 Degradation of tetracycline by Fenton process ............................................23. 4.1.1. Effect of reagents concentration in same [Fe2+]/[H2O2] ratio .............23. 4.1.2. Effect of ferrous ion ............................................................................24. 4.1.3. Effect of hydrogen peroxide ................................................................26. Effect of Fe2+ on tetracycline removal by persulfates ..................................27 4.2.1. Degradation efficiency between different oxidants .............................27 vi.
(8) 4.3. Organic macromolecules on the tetracycline removal ..................................29 4.3.1. Effect of pH environment ....................................................................29. 4.3.2. Degradation efficiency at the presence of organic macromolecules ...30. 4.4. Mechanism of Tetracycline degradation by Fenton ......................................33 4.4.1. Tetracycline degradation by Classic Fenton process ...........................33. 4.4.2. Tetracycline degradation at the presence of organic macromolecules in acidic environment ..............................................................................36. Chapter 5. Conclusion ..............................................................................................41. REFERENCE ..................................................................................................................42 APPENDIX A. Data analysis of the degradation of tetracycline by Fenton process ......46 APPENDIX B. Data analysis of the degradation of tetracycline by Fe 2+ activated persulfates ........................................................................................................................52 APPENDIX C. Data analysis of the degradation of tetracycline by Fenton process in neutral environment .........................................................................................................55 APPENDIX D. Data analysis of the degradation of tetracycline by Fenton with coexisting macromolecules ...............................................................................................................56. vii.
(9) LIST OF FIGURES. Figure 2.1 Reaction mechanism in Fenton process without the presence of target organic compounds. .....................................................................................................8 Figure 2.2 The reaction mechanism in Fe2+ activated PDS without the presence of target organic compounds. ......................................................................................10 Figure 2.3 The reaction mechanism in Fe2+ activated PMS without the presence of target organic compounds. ......................................................................................12 Figure 2.4 Model of HA structure ...................................................................................15 Figure 3.1 Research framework.......................................................................................16 Figure 3.2 Experimental procedure of the present study .................................................19 Figure 3.3 The calibration curve of Tetracycline. ............................................................21 Figure 4.1 The degradation efficiency of tetracycline by Fenton process in same reagents ratio. ..............................................................................................................23 Figure 4.2 The degradation efficiency of tetracycline by Fenton process in different Fe2+ concentration.................................................................................................25 Figure 4.3 The degradation efficiency of tetracycline by Fenton process in different H 2O2 concentration.................................................................................................26 Figure 4.4 The degradation of Tetracycline by three oxidants in different reagents concentration ratio. .......................................................................................28 Figure 4.5 The degradation of Tetracycline by Fenton process in different pH. .............29 Figure 4.6 The degradation of Tetracycline by Fenton process at pH 3 with coexisting organic macromolecules. ..............................................................................31 Figure 4.7 The degradation of Tetracycline by Fenton process at pH 7 with coexisting viii.
(10) organic macromolecules. ..............................................................................32 Figure 4.8 The mass spectrum of tetracycline degradation by Fenton Process at pH 3 for samples collected before reaction (A), 30 seconds (B) and 300 seconds (C) after reaction started. ....................................................................................34 Figure 4.9 The mass spectrum of tetracycline degradation by Fenton Process at pH 7 for samples collected before reaction (A), 30 seconds (B) and 300 seconds (C) after reaction started. ....................................................................................35 Figure 4.10 The mass spectrum of citrate presented tetracycline degradation by Fenton Process at pH 3 for samples collected before reaction (A), 30 seconds (B) and 300 seconds (C) after reaction started. .........................................................37 Figure 4.11 The mass spectrum of humic acid presented tetracycline degradation by Fenton Process at pH 3 for samples collected before reaction (A), 30 seconds (B) and 300 seconds (C) after reaction started. ............................................38 Figure 4.12 The mass spectrum of -cyclodextrin presented tetracycline degradation by Fenton Process at pH 3 for samples collected before reaction (A), 30 seconds (B) and 300 seconds (C) after reaction started. ............................................39. ix.
(11) LIST OF TABLES. Table 3.1 Chemical and physical properties of Tetracycline ...........................................17 Table 3.2 Experimental chemicals ...................................................................................18 Table 3.3 Experimental equipment ..................................................................................18 Table 3.4 HPLC analytical condition of Tetracycline......................................................21. x.
(12) Chapter 1. 1.1. Introduction. Background In the past few decades, contaminants of emerging concern (CEC) have become an. important issue in assuring the environmental quality, and drug residues is one of the important categories that contribute the prevalence of emerging contaminants in the environment. When drug residues are released into the aquatic environment, they may pose a serious threat to the ecosystem and some of them are endocrine disruptors which impact the survival of biological communities in the water bodies. Moreover, these drug residues may enter human food chains through source water abstraction and drinking water distribution systems (Sauvé and Desrosiers, 2014). Meanwhile, tetracycline (TC), listed as the essential medicine by the World Health Organization, is known as a broadspectrum antibiotic often used to treat a number of infections and become the first line treatment for many diseases. It is also used as the medicated bath of aquaculture and a feed additive of livestock farming to prevent disease and increase growth rate (OcampoPérez et al., 2015). Due to its extensive application recently, tetracycline has been detected in natural water bodies and wastewater, becoming one of the emerging and concerning contaminants. Many reported studies indicated the detection of tetracycline antibiotics in the effluents discharged from wastewater treatment plants in Taiwan and around the world. Although remained in a relatively low concentration range, the tetracycline residue in the ambient environment still attracts a lot of attention because it is difficult to biodegrade and may accumulate in the environment. TC was removed mostly through the activated carbon adsorption or membrane filtration, and might also be treated by chemical oxidation 1.
(13) (Lin et al., 2009; Zhang et al., 2015; Zhou et al., 2009). Previous studies showed that photo-Fenton process and electro-Fenton processes can almost completely degrade tetracycline in wastewater (Barhoumi et al., 2017; Yamal-Turbay et al., 2013). Since the photo- and electro-Fenton processes require additional energy input, they are considered relatively expensive and difficult to be installed for in-situ treatment. The classic Fenton process utilizes the reaction of hydrogen peroxide and ferrous ions to produce hydroxyl radicals to degrade the target contaminants (Fan et al., 2011). The Fenton process was found to be highly efficient at the condition of pH 3. For the real practice of wastewater treatment, maintaining the in-situ environment at acidic condition is highly infeasible, and many coexisting organic matters may compete with the target compounds for the oxidants, affecting the removal of tetracycline. This study aimed to explore the tetracycline degradation by Fenton process both in acidic and neutral environment and to investigate the role of coexisting organic macromolecules in the degradation process. Tetracycline was selected as the target compound and the degradation efficiencies for the experimental results conducted at various concentrations of Fenton reagents were compared.. 2.
(14) 1.2. Research objectives In this study, Fenton process and Fe2+ activated persulfate (PDS and PMS) were used. to degrade tetracycline (TC). Humic acid, citrate, and -cyclodextrin as the coexisting macromolecules were added in the degradation process. The experimental parameters were adjusted to investigate the tetracycline degradation rate under a variety of scenarios. The objectives of the study are as follows: 1. The Fenton process is used to degrade the tetracycline both in the acidic and neutral environment and the removal efficiencies of different reagent dosages were observed to evaluate the optimal reagent ratio. 2. The Fenton Process at the optimal reagent dosage was applied to the Fe2+activated persulfate processes to investigate the degradation rate of tetracycline. 3. The tetracycline degradation by Fenton process at the presence of macromolecules in the acidic and neutral environment were investigated and the role of coexisting organic macromolecules was explored.. 3.
(15) Chapter 2. Literature Review. 2.1. Tetracycline antibiotics. 2.1.1. Emerging Contaminants. Emerging contaminants can be classified into naturally-occurring or man-made substances, and they have been confirmed to be or suspected to be present in various environments. Meanwhile, pharmaceutical products and its derivatives have been identified as an important category of the concerning emerging contaminants. They may act as strong endocrine disruptors in the environment and have toxicity or long-term effects on the metabolism of living organisms. So far, very few studies established the complete monitoring systems for the emerging contaminants. Thus, emerging contaminants remain to have significant potential risks to human health and environmental ecology (Sauvé and Desrosiers, 2014).. 2.1.2. Tetracycline antibiotics. Tetracycline antibiotics (TCs) are a group of broad-spectrum antibiotic compounds that have a common basic chemical structure of four aromatic/hydrocarbon rings. The first tetracycline antibiotic, chlortetracycline, was found from Streptomyces aureofaciens (S. aureofaciens) by Dr. Benjamin Duggar (Duggar, 1948). With the advancement of analytical chemistry, tetracycline antibiotics can be classified into natural and semisynthetic categories. Tetracycline, chlortetracycline, oxytetracycline, and demeclocycline are often used TCs that exist in nature. Tetracycline exhibited strong activity against a wide range of microorganisms including gram-positive and gram-negative bacteria, spirochetes, chlamydiae, rickettsiae, actinomyces, and Ameoba. Moreover, the low cost 4.
(16) of tetracycline makes it not only being used as antibiotic for human diseases treatments but also served as aquaculture medicated bath and animal husbandry feed additives to prevent diseases and increase the growth rate (Ocampo-Pérez et al., 2015).. 2.1.3. Environmental hazards caused by tetracycline antibiotics. Tetracycline antibiotics have chromaticity and antibacterial effects and it is difficult to be biodegraded in the ambient water bodies (Zhou et al., 2009). Moreover, environmental microorganisms present drug resistance due to a long-term exposure to antibiotics. Contaminant residues can be harmful to humans or organisms that are at the top of the food chains through biomagnification. Tetracycline antibiotics enter the environment via pharmaceutical use, animal husbandry behavior, and discarding unused or expired drugs, so their residues are often detected in the wastewater treatment plants. Lin et al. (2009) showed that TCs were detected in four secondary wastewater treatment plants in Taipei, Taiwan. The observed concentrations of TCs in surface water ranged from 0.11 to 4.2 μg/L, and those in the effluents of wastewater treatment plants (WWTPs) ranged from 46 to 1300 ng/L for tetracycline, 270 to 970 ng/L for chlortetracycline, and 240 ng/L for oxytetracycline (Ocampo-Pérez et al., 2015).. 2.1.4. Tetracycline. Tetracycline was originally made from bacteria of the Streptomyces type. Because of its low production cost and wide range of antibacterial effects, tetracycline becomes the first line medicine for many diseases and also is listed in the WHO Model List of Essential Medicines. Tetracycline can penetrate the bacteria cell through the pore of plasma membrane by passive diffusion, and bind to the 16sRNA on the microbial 5.
(17) ribosomal 30S subunit, inhibiting protein synthesis by blocking the attachment of charged aminoacyl-tRNA to the A site on the ribosome (Connell et al., 2003). Thus, the bacterial cells were unable to grow without proteins to achieve the antibacterial effects.. 2.2. The treatment of wastewater containing tetracycline. 2.2.1. Activated carbon adsorption. Activated carbon (AC) has a relatively large specific surface area and many suitable pores, and is widely used as an adsorbent for treating aqueous antibacterial agents (Hoseinzadeh Hesas et al., 2013). The target contaminants form a equilibrated surface layer on the AC particle. The contaminants are removed by adsorption through capturing the target compounds in the pores. However, the manufacturing process of activated carbon leads to high cost and uses non-renewable raw materials (Theydan and Ahmed, 2012). To regenerate the activated carbon, it is requited to wash the spent AC with high heat or chemicals to degrade the organic matters adsorbed on the AC surface. The study showed that the maximum adsorption of tetracycline by AC was 1121.5 mg/g (Zhang et al., 2015) and 1340.8 mg/g for oxytetracycline (Sun et al., 2012).. 2.2.2. Biological treatment. The biological treatment process removes organic pollutants through microbial decomposition, however, tetracycline antibiotics exhibit an antibacterial effect which may inhibit the growth of the microorganisms. Thus, it is not suitable to treat TC-containing wastewater through biological treatment.. 6.
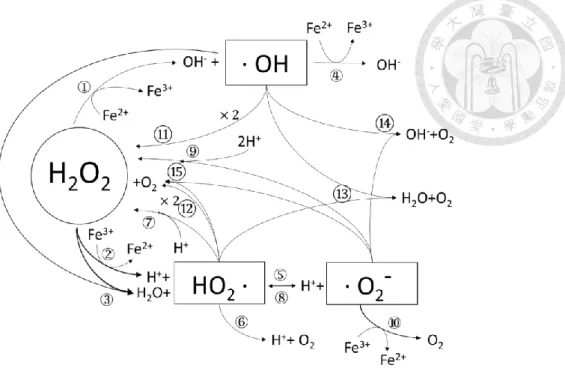
(18) 2.2.3. Membrane filtration. The pore size on the membrane surface and the structure of the membrane are the key factors controlling the efficiency in screening out particles or molecules in membrane filtration processes. They can be classified into reverse osmosis (RO), nanofiltration (NF), ultrafiltration (UF) and microfiltration (MF) according to the particle size that can be screened out from small to large. However, the retained particles in the membrane may cause clogging after a long term operation period, which decreases the removal efficiency.. 2.3. Fenton process (Chemical oxidation method). 2.3.1. Fenton process by H2O2/Fe(II). Fenton process is an advanced oxidation process which catalyzes hydrogen peroxide by ferrous ion and produce hydroxyl radicals that have a strong oxidative ability to degrade the organic contaminants into carbon dioxide and water without contaminant selectivity (Fan et al., 2011). Fenton process is a chain reaction, which works best when the pH is close to 3. In the process, hydrogen peroxides react with ferrous ions to form hydroxyl radicals, ferric ions, and hydroxide ions. Hydrogen peroxide can still react with hydroxyl radicals to produce ·HO2 radicals and reduce the ferric ions to ferrous ions, so the chain reactions remain until the hydrogen peroxide is consumed completely or by the addition of the quenching solution (Fan et al., 2011).. 7.
(19) Figure 2.1 Reaction mechanism in Fenton process without the presence of target organic compounds. The reaction equation of Fenton process: Reaction ① Fe2+ + H2O2 ·OH + OH– + Fe3+. K(M-1S-1) 63. Ref. Metelitsa (1971). ② H2O2 + Fe3+ ·HO2 + H+ + Fe2+. 0.01. Walling and Goosen (1973). ③ H2O2 + ·OH H2O + ·HO2. 2.7×10⁷. Christensen et al. (1982). ④ Fe2+ + ·OH OH– + Fe3+. 3.2×10⁸. Stuglik and PawełZagórski (1981). ⑤ ·HO2 H+ + ·O2–. 1.58×10⁻⁵(S-1). Bielski et al. (1985). ⑥ ·HO2 + Fe2+ + H+ H2O2 + Fe3+. 1.2×10⁶. Jayson et al. (1969). ⑦ ·HO2 + Fe3+ O2 + H+ + Fe2+. 3.1×10⁵. Rush and Bielski (1985). ⑧ ·O2– + H+ ·HO2. 1.0×10¹⁰. Bielski et al. (1985). ⑨ ·O2– + Fe2+ + 2H+ H2O2 + Fe3+. 1.0×10⁷. Rush and Bielski (1985). ⑩ ·O2– + Fe3+ O2 + Fe2+. 5.0×10⁷. Rothschild and Allen (1958). ⑪ ·OH + ·OH H2O2. 4.2×10⁹. Sehested et al. (1969). ⑫ ·HO2 + ·HO2 H2O2 + O2. 8.3×10⁵. Bielski et al. (1985). ⑬ ·OH + ·HO2 H2O + O2. 1.0×10¹⁰. Sehested et al. (1969). ⑭ ·OH + ·O2– O2 + OH–. 1.0×10¹⁰. Sehested et al. (1969). ⑮ ·HO2 + ·O2– (+ H+) H2O2 + O2. 9.7×10⁷. Bielski et al. (1985). 8.
(20) 2.3.2. Photo-Fenton process. The Fenton process may increase the production of ferric hydroxide sludge when treating real wastewater at neutral condition. In order to improve the disadvantage of Fenton process, photo-Fenton process was introduced to reduce the ferric ions to ferrous ions by photoelectric effect under UV light irradiation (Yamal-Turbay et al., 2013). However, the operating cost and energy spent for photo-Fenton process is high, making the treatment method difficult to apply to the in situ treatment.. 2.3.3. Electro-Fenton process. The electro-Fenton process employs the same principle as the Fenton process that degrade the organic contaminants by strong oxidative hydroxyl radicals formed by the reaction between hydrogen peroxide and ferrous irons. The electro-Fenton process applies an electric field which can oxidize the organic pollutants at the anode and reduce the ferric ions to ferrous ions at the cathode to react with hydrogen peroxide continuously in the acidic environment (Nidheesh and Gandhimathi, 2012). As described in the previous paragraph, the application of the electro-Fenton process requires electrical energy and increase operation cost, thereby limiting the practical application of this method.. 2.4. Persulfate Although the Fenton process is effective in removing organic contaminants, there. are several disadvantages such as iron sludge production, hydrogen peroxide consumption and pH dependency. Recent studies showed many successful cases in which peroxydisulfate (PDS, S2O82-) and peroxymonosulfate (PMS, SO52-) were applied to onsite wastewater treatment (Kaur and Crimi, 2014; Zhao et al., 2014). Persulfates have the 9.
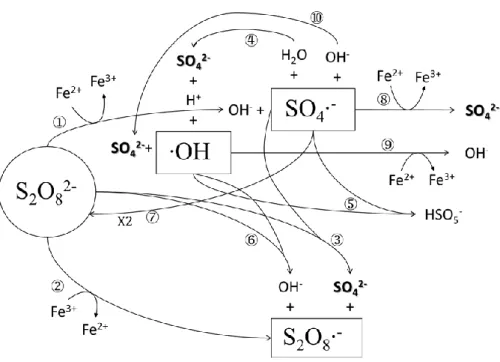
(21) ability to decompose contaminants such as polychlorinated biphenyls (PCBs) (Fan et al., 2014; Fang et al., 2013), chlorophenol (Rastogi et al., 2009), polycyclic aromatic hydrocarbons (PAHs) (Gryzenia et al., 2009), and BTEX (Liang et al., 2008).. 2.4.1. Fe2+ activated PDS oxidation process. As indicated in the study by (Wang et al., 2019), the reaction mechanism in Fe2+ activated PDS without the presence of target organic compounds was shown in Figure 2.2. In the reaction system, PDS is activated by Fe2+ to form sulfate radicals (SO4•−) that may react with H2O to form hydroxyl radicals or with PDS to form peroxydisulfate radicals.. Figure 2.2 The reaction mechanism in Fe2+ activated PDS without the presence of target organic compounds.. The reaction equation of Fe2+ activated PDS oxidation process (Wang et al., 2019): 10.
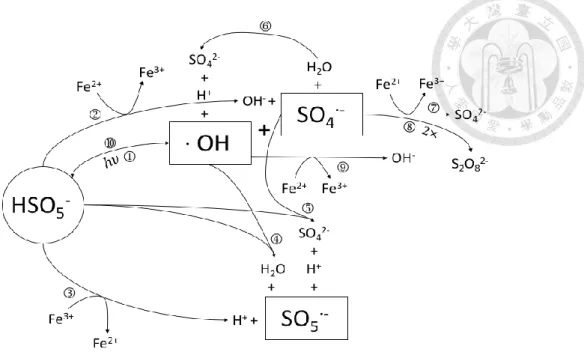
(22) Reaction. K(M-1S-1). ① Fe2+ + S2O82− → Fe3+ + SO4•− + SO42−. 17. ② Fe3+ + S2O82− → Fe2+ + S2O8•− ③ SO4•− + S2O82− → S2O8•− + SO42−. 1.2×10⁶. ④ SO4•− + H2O → H+ + SO42− + HO•. 200. ⑤ SO4•− + HO• → HSO5−. 1.0×10¹⁰. ⑥ HO• + S2O82− → S2O8•− + OH−. 1.4×10⁷. ⑦ ·SO4•− + SO4•− → S2O82−. 8.1×10⁸. ⑧ Fe2+ + SO4•− → Fe3+ + SO42−. 4.6×10⁹. ⑨ Fe2+ + HO• → Fe3+ + OH−. 4.8×10⁸. ⑩ SO4•− + OH− → SO42− + HO• (Alkaline pH). 6.5×10⁷. ⑪ Fe3+ + RH → Fe2+ + R•+ H+. 2.4.2. Fe2+ activated PMS oxidation process. The reaction mechanism in Fe2+ activated PMS without the presence of target organic compounds was shown in Figure 2.3. PMS can activated by light or Fe2+ to form sulfate radicals (SO4•−) and peroxymonosulfate radicals (SO5•−), and these radicals may react with H2O to form hydroxyl radicals. These radicals may react with each other or other species, resulting in the complexity in the PMS activation system.. 11.
(23) Figure 2.3 The reaction mechanism in Fe2+ activated PMS without the presence of target organic compounds.. The reaction equation of Fe2+ activated PMS oxidation process: Reaction ① HSO5− → ·OH + SO4•− ② HSO5− + Fe2+ → OH− + SO4•− + Fe3+ ③ HSO5− + Fe3+ → H+ + SO5•− + Fe2+ ④ HSO5− + ·OH → H2O + SO5•− ⑤ HSO5− + SO4•− → SO42− + H+ + SO5•− ⑥ SO4•− + H2O → SO42− + H+ + ·OH ⑦ SO4•− + Fe2+ → SO42− + Fe3+ ⑧ SO4•− + SO4•− → S2O82− ⑨ ·OH + Fe2+ → Fe3+ + OH− ⑩ ·OH + SO4•− → HSO5− 12.
(24) 2.5. Natural organic matter. 2.5.1. Natural organic matter in water bodies. The natural organic matter (NOM) includes all kinds of natural-occurring dissolved and particulate organic molecules. The sources of NOM in natural water bodies are the metabolic products, excretions and residues of animals and plants in the environment. The NOM in water can be classify by the size; (1) particulate organic matter (POM) is a kind of NOM with a particle size larger than 0.45μm, which can be removed by wastewater treatment and water purification processes; (2) dissolved organic matter (DOM) is a class of NOM with a particle size smaller than 0.45μm, which is difficult to remove by conventional wastewater treatment process (Leenheer and Croué, 2003).. 2.5.2. Citric acid. Citric acid (2-Hydroxypropane-1,2,3-tricarboxylic acid) is a kind of organic acid found in plants and soil. It is a natural preservative produced by citrus fruits and commonly used as industrial chelating agents, household cleaners, and food additives. Meanwhile, the best operating pH of the Fenton process is 3 (Velásquez et al., 2014). However, when the pH increased, ferrous and ferric ions may precipitate and decrease the efficiency of Fenton process. To prevent the precipitation, chelating agent such as EDTA (Ethylenediaminetetraacetic acid), NTA (Nitrilotriacetic acid), and citrate was added to maintain the soluble form of Fe(II) and Fe(III) at neutral pH (Ling et al., 2017). Since EDTA is poor in biodegradability and environmentally persistent and NTA is a carcinogen, (Rastogi et al., 2009), the citrate is considered more suitable for use as a chelating agent in water and wastewater treatment.. 13.
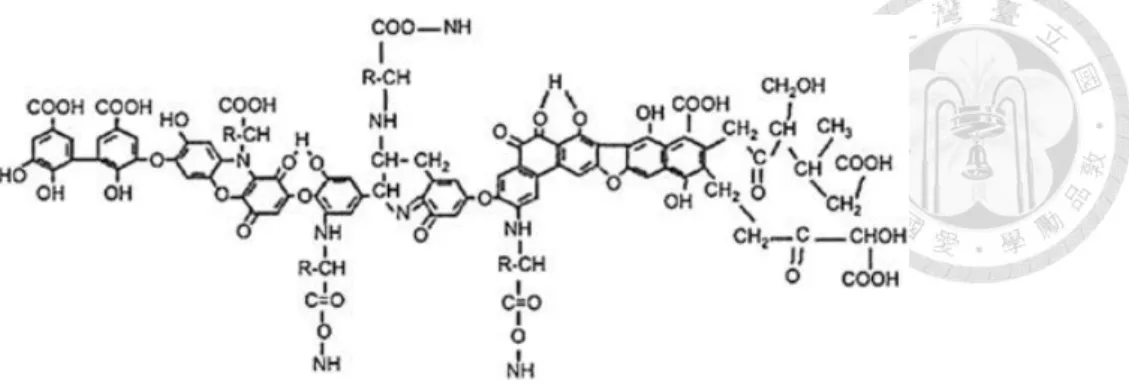
(25) 2.5.3. Humic substance. Humic substances are weakly acidic (pKa= 3~5) and hydrophobic, which consist of mainly humic acid and fluvic acid. The molecular weight ranges from hundreds to tens of thousands Daltons, which makes humic substances a group of heterogeneous compounds with a lot of functional groups. In addition, humic substances are in negatively charged colloidal forms in natural water bodies and are difficult to decompose by microorganisms. Humic substances can be classified into the following three categories according to its solubility and molecular weight (Aiken, 1985): ⚫ Humin: the molecular weight is up to 300,000 Da and is insoluble in any aqueous solution. ⚫ Humic acid (HA): insoluble when pH<2 in aqueous solution, molecular weight between 1,000~100,000 Da. ⚫ Fulvic acid (FA): the molecular weight is between 200~2,000 Da and containing more acidic functional groups (-COOH) and soluble in aqueous solution. Humic acids are composed of molecules rich in both acidic functional groups such as carboxyl and phenolic groups, and hydrophobic moieties such as alkyl chains and aromatic cores (Ikeya et al., 2015). Hydrophilic active groups such as carboxyl and phenolic groups are easily dissociated in water to form negatively charged poly-anionic compounds, which cause humic acid to form stable complexes with metal ions (de Melo et al., 2016). However, the chemical composition of HAs is different depending on geographical region, climate and time, so it is difficult to accurately delineate its structure. A simulated structure of humic acid is shown in Figure 2.4 (Mirza et al., 2011).. 14.
(26) Figure 2.4 Model of HA structure Based on its structural formula, humic acid can be divided into hydrophilic and hydrophobic parts. The hydrophilic part is composed of phenolic group and carboxyl group; the hydrophobic part is composed of aliphatic and aromatic. Hydrophilic phenolic groups and reactive functional groups such as carboxyl groups are easily to dissociate in water to form negatively charged poly-anions, which cause humic acid to form stable complexes with metal ions (De Melo et al, 2016).. 2.5.4. Cyclodextrin. Produced from starch, cyclodextrins are a family of cyclic oligosaccharides consisting of a macrocyclic ring of glucose subunits. Cyclodextrins are used in food, pharmaceutical, and chemical industries, as well as agriculture and environmental engineering. Cyclodextrin is easily hydrolyzed under acidic conditions, and the interior of the toroid is regarded as less hydrophilic than the aqueous environment according to their structure, which enable them to host other hydrophobic molecules. The following three typical cyclodextrins contain six to eight glucose monomers in a ring, creating a cone shape: ⚫ -cyclodextrin: 6 glucose subunits ⚫ -cyclodextrin: 7 glucose subunits ⚫ -cyclodextrin: 8 glucose subunits 15.
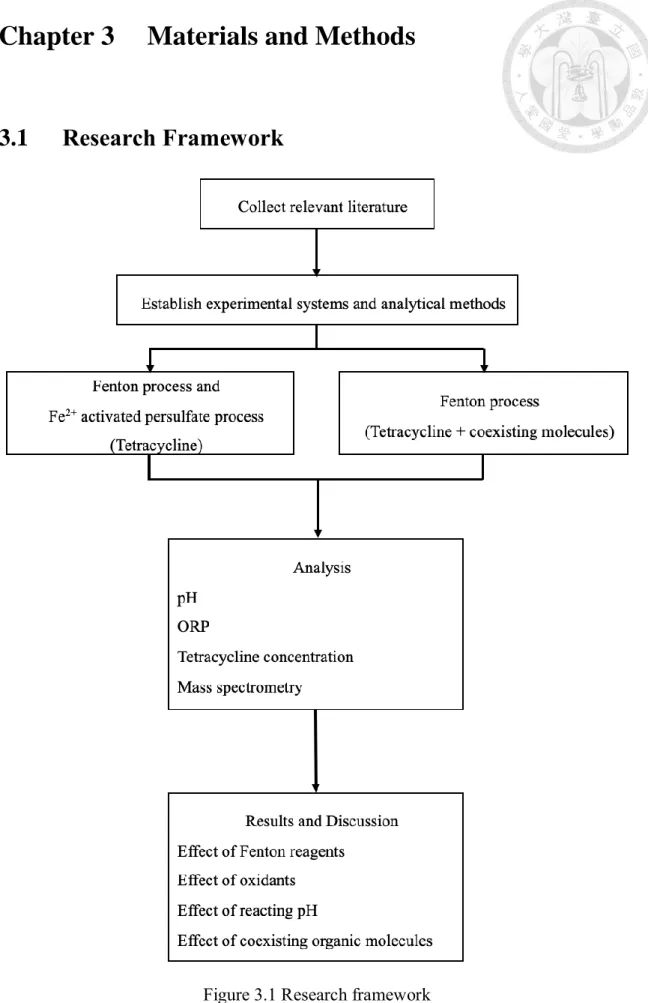
(27) Chapter 3. 3.1. Materials and Methods. Research Framework. Figure 3.1 Research framework 16.
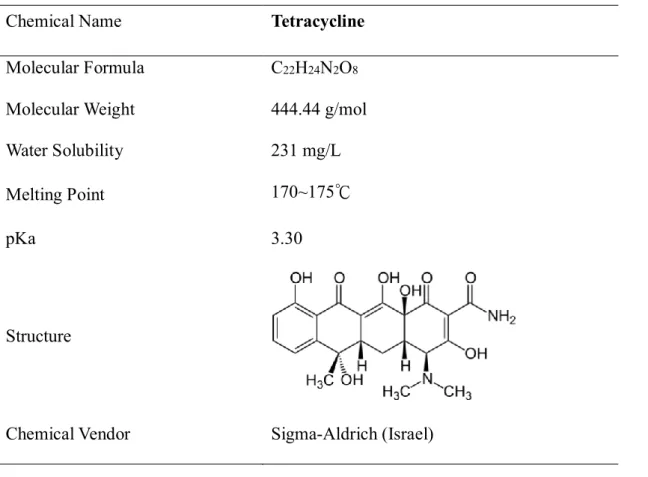
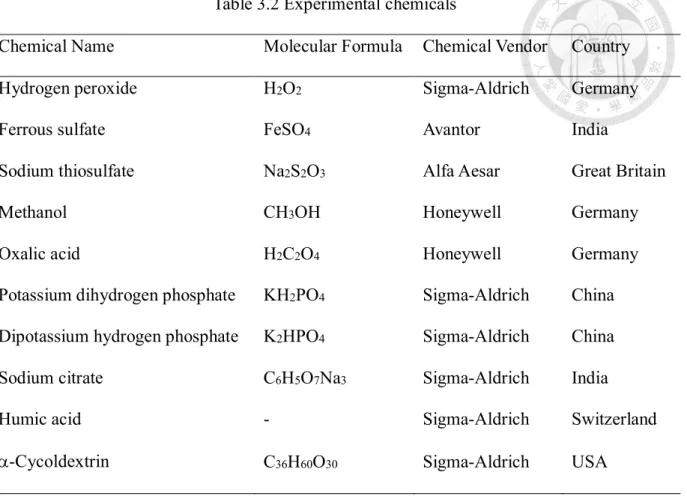
(28) 3.2. Chemicals and apparatus. 3.2.1. Experimental chemicals and materials. The chemical and physical properties, structure of tetracycline were listed in Table 3.1. All chemicals used were reagent grade, including hydrogen peroxide, ferrous sulfate, methanol, oxalic acid, potassium dihydrogen phosphate, dipotassium hydrogen phosphate, sodium citrate, humic acid and cyclodextrin (details please refer to Table 3.2).. Table 3.1 Chemical and physical properties of Tetracycline Chemical Name. Tetracycline. Molecular Formula. C22H24N2O8. Molecular Weight. 444.44 g/mol. Water Solubility. 231 mg/L. Melting Point. 170~175℃. pKa. 3.30. Structure. Chemical Vendor. Sigma-Aldrich (Israel). 17.
(29) Table 3.2 Experimental chemicals Chemical Name. Molecular Formula. Chemical Vendor. Country. Hydrogen peroxide. H2O2. Sigma-Aldrich. Germany. Ferrous sulfate. FeSO4. Avantor. India. Sodium thiosulfate. Na2S2O3. Alfa Aesar. Great Britain. Methanol. CH3OH. Honeywell. Germany. Oxalic acid. H2C2O4. Honeywell. Germany. Potassium dihydrogen phosphate. KH2PO4. Sigma-Aldrich. China. Dipotassium hydrogen phosphate. K2HPO4. Sigma-Aldrich. China. Sodium citrate. C6H5O7Na3. Sigma-Aldrich. India. Humic acid. -. Sigma-Aldrich. Switzerland. -Cycoldextrin. C36H60O30. Sigma-Aldrich. USA. 3.2.2. Experimental equipment. Tetracycline was detected by HPLC. ORP and pH meters were employed during the experimental process to collect data. The precision of the electronic balance was up to 0.1 mg. The AOP experiments were conducted at the rotating speed of 600 rpm during the experiment. Table 3.3 Experimental equipment Name. Vendor. Country. High Performance Liquid Chromatography. Thermo Fisher. USA. pH meter. HOTEC. Taiwan. ORP meter. HOTEC. Taiwan. 18.
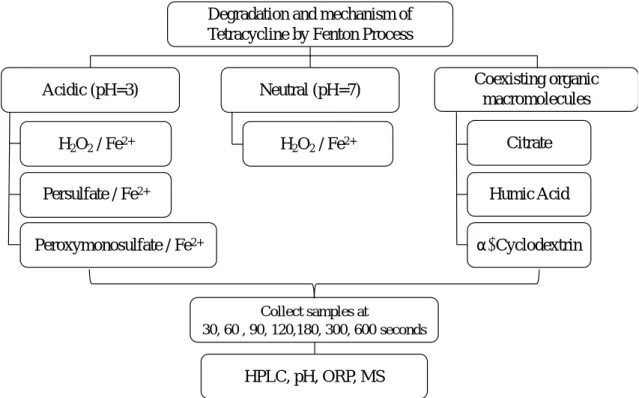
(30) Electronic Balance. Shimadzu. Japan. Magnetic Stirrer. Clean. Taiwan. 3.3. Experimental procedures. 3.3.1. Experimental process. This study aimed to investigate the degradation of tetracycline by Fenton process in acidic and neutral environment to explore the reagent ratio of Fe 2+ to H2O2 with best removal efficiency. The oxidant in Fenton process was replaced by persulfate and peroxymonosulfate in both pH conditions to investigate the degradation of tetracycline. Moreover, the addition of coexisting organic macromolecules, including citrate, humic acid and cyclodextrin, were conducted to explore the impact to the Fenton system. Degradation and mechanism of Tetracycline by Fenton Process Acidic (pH=3). Neutral (pH=7). H2O2 / Fe2+. H2O2 / Fe2+. Persulfate / Fe2+. Coexisting organic macromolecules Citrate Humic Acid a- Cyclodextrin. Peroxymonosulfate / Fe2+. Collect samples at 30, 60 , 90, 120,180, 300, 600 seconds. HPLC, pH, ORP, MS. Figure 3.2 Experimental procedure of the present study. 19.
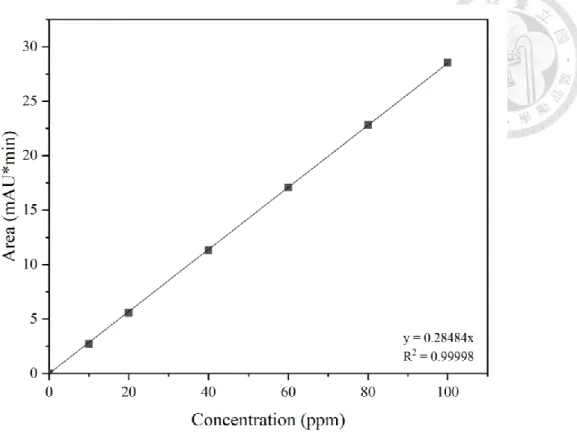
(31) 3.3.2. Experimental solutions preparation. Tetracycline solution was prepared every time immediately prior to experimentation. 25mg tetracycline powder were dissolved in 1L deionized water to make 100ppm tetracycline stock solution. The concentrations of tetracycline in the calibration curve preparation were dilute from the 100 ppm stock solution. For the experiments in neutral condition, 0.2 M 10 mL phosphate buffer was added to adjust the pH at 7. In acidic Fenton system, a ferrous sulfate stock solution of 5 mM was prepared weekly, and the solution was acidified to pH 2 by sulfuric acid and was kept in 4℃ refrigerator. The H2O2 stock solution was dilute from 30% H2O2 to 5 mM and stored in brown bottle at 4℃to prevent degradation. The humic acid stock solution was prepared in alkaline environment by NaOH addition, and stirred for an hour to fully dissolve the humic acid. The solution has to stand still for another hour, and filtered through the 0.45 μm glass fiber filter. The 1000 ppm humic stock solution has to store in dark bottle in 4℃ refrigerator.. 3.3.3. Analytical methods. Tetracycline concentrations were quantified by Thermo Scientific Ultimate 3000 HPLC with Thermo Scientific Acclaim 120 C18 5µm 120Å (4.6 X 250mm) column and UV detector. The mobile phase condition was listed in Table 3.4. The calibration curve was showed in Figure 3.3. Both the pH and the ORP value were measured by the electrode method. Before measurement, the pH meter were calibrated with the pH standard solution 4.01/ 7.00/10.01 and the ORP meter calibrated by ORP standard solution 220mV.. 20.
(32) Figure 3.3 The calibration curve of Tetracycline.. Table 3.4 HPLC analytical condition of Tetracycline Column Temperature. 30°C. Flow rate. 1.7 mL/min. Sample Volume. 20 L. Wavelength. 360 nm. Time (min). Methanol (%). 0.01M Oxalic acid (%). 0. 15. 85. 4. 30. 70. 5. 50. 50. 6. 75. 25. 8. 50. 50. 9. 30. 70. 11. 15. 85. Mobile Phase Gradient. 21.
(33) 3.3.4. Experimental procedures. The initial concentration of tetracycline solution was 50 ppm. The acidic FeSO4 was added in 500 mL tetracycline solution at the given experimental conditions. Sulfuric acid was used to adjust the pH and the magnetic stirrer at 600 rpm was used for mixing. The degradation experiment started by the addition of hydrogen peroxide, persulfate, or peroxymonosulfate into the solution, and the pH and ORP values were measured during the process. Samples were collected at the beginning and 30, 60, 90, 120, 180, 300, 600 seconds after the reaction taking place. All the samples were quenched by sodium thiosulfate immediately after collection, and were filtered through 0.22 µm filter and analyzed by HPLC. The initial concentration of tetracycline solution was 50 ppm, in which phosphate buffer was added for pH control around 6.9 to 7. The Fenton process started by adding the oxidant and quenched by Na2S2O3. Samples were collected at specific time and filtered before analyzed by HPLC. The coexisting organic macromolecules were added in the initial tetracycline solution. In the acidic environment, the pH value was adjusted to 3; the pH was controlled around 6.9 to 7 by phosphate buffer in neutral experiments. The Fenton degradation started by adding hydrogen peroxide in the solution and the reaction was quenched by adding Na2S2O3 when samples were collected. Samples were filtered and analyzed by HPLC.. 22.
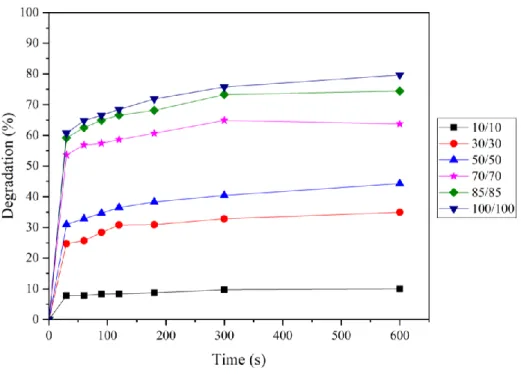
(34) Chapter 4. Results and Discussion. 4.1. Degradation of tetracycline by Fenton process. 4.1.1. Effect of reagents concentration in same [Fe2+]/[H2O2] ratio. In the tetracycline degrade by Fenton process, the solution pH was around 3 and the initial concentration of tetracycline was 50 ppm. The Fenton reagents concentrations were 10, 30, 50, 70, 85, 100 M at the [Fe2+]/[H2O2] ratio of 1. The results are shown in Figure 4.1. During the first 30 seconds after the reaction took place, the degradation proceeded fast, and the reaction became slow after 30 seconds. The highest degradation percentage was 79.6% when Fe2+ and H2O2 were both 100 M. The removal efficiencies were 10.0%, 35.0%, 44.3%, 63.8%, and 74.5% at the H2O2 concentrations of 10, 30, 50, 70, 85 M, respectively. The more reagents added in the system, the higher degradation efficiency was observed.. Figure 4.1 The degradation efficiency of tetracycline by Fenton process in same reagents ratio. 23.
(35) 4.1.2. Effect of ferrous ion. Two hydrogen peroxide concentrations were chosen and the results were shown in Figure 4.2. During the first 30 seconds of the reaction, tetracycline has been degraded rapidly, and the decomposition became slow in the following 10 minutes. The removal efficiencies were 34.0%, 40.2%, 44.3%, 51.7%, 53.9%, and 58.3% at the Fe2+ concentrations of 10, 30, 50, 70, 85, 100 M, respectively. As shown in Figure 4.2B, the removal efficiency was 79.6% after 10 minutes when the concentrations of both Fenton agents were 100 M. The removal efficiencies were 49.2%, 56.7%, 71.0%, 69.0%, and 75.8% at the Fe2+ concentrations of 10, 30, 50, 70, 85 M, respectively. The ferrous ions catalyzed the hydrogen peroxides to produce hydroxyl radicals, and the production rate increased when the ferrous ion concentration increased, making the degradation rate faster. However, excessive ferrous ions might interact with hydroxyl radicals and cause the consumption of hydroxyl radicals, making the enhancement in removal efficiency less obvious or exhibiting a decreasing fashion.. 24.
(36) Figure 4.2 The degradation efficiency of tetracycline by Fenton process in different Fe2+ concentration. (A) [H2O2] = 50 M. (B) [H2O2] = 100 M.. 25.
(37) 4.1.3. Effect of hydrogen peroxide. At the ferrous ion concentration of 10 M, the concentration of hydrogen peroxide was varied (i.e., [Fe2+]/[H2O2] ratios were 1:1, 1:5, and 1:10) in the degradation experiments and the results were shown in Figure 4.3. Because of the low concentration of ferrous ions, the reaction proceeded at the first 30 seconds and was slowed down afterwards. The maximum tetracycline removal was 49.17% when the hydrogen peroxide was 100 M, 34.0% for 50 M hydrogen peroxide, and 10.0% for 10 M hydrogen peroxide, respectively. With the presence of Fe2+, the more H2O2 concentration resulted in a more efficient tetracycline removal because of more hydroxyl radicals production.. Figure 4.3 The degradation efficiency of tetracycline by Fenton process in different H2O2 concentration.. 26.
(38) 4.2. Effect of Fe2+ on tetracycline removal by persulfates. 4.2.1. Degradation efficiency between different oxidants. In the PDS and PMS activated by Fe2+ experiments, the pH of the solution was controlled around 3. Three concentration combinations were applied and the results were shown in Figure 4.4. The results indicated that the degradation by hydrogen peroxide showed the best removal efficiency and the peroxymonosulfate showed a stronger oxidizing ability than peroxydisulfate. However, the removal efficiency increased in the first 30 seconds and remained stable until 10 minutes while the degradation reaction continued steadily in the case of hydrogen peroxide and peroxydisulfate. While the Fe2+ and PDS concentration were both 100 M, the degradation pattern exhibited a different fashion from that in the Fenton process. (Figure 4.4C) The degradation could be classified into two part: (1) fast stage: from the reaction start to 90 seconds, ferrous ions activated persulfate and produced sulfate radicals to degrade tetracycline rapidly; (2) slow stage: the reaction constants of sulfate radicals with other intermediate compounds were higher than with the target compound. As the consumption of involving radicals increased, the degradation of tetracycline reduced. Sulfate radicals produced in the Fe2+/PDS and Fe2+/PMS systems might react not only with target compounds but also with ferrous ions, oxidizing ferrous ions to ferric ions to decrease the sulfate radicals production, leading to a lower removal efficiency than that of the classic Fenton process. In addition, the reaction of reducing ferric ions to ferrous ions in the Fe2+/PDS and Fe2+/PMS systems impacts the degradation of tetracycline in the investigated system significantly.. 27.
(39) Figure 4.4 The degradation of Tetracycline by three oxidants in different reagents concentration ratio. (A) [Fe2+] = 50 M and [oxidants] = 50 M. (B) [Fe2+] = 50 M and [oxidants] = 100 M. (C) [Fe2+] = 100 M and [oxidants] = 100 M. 28.
(40) 4.3. Organic macromolecules on the tetracycline removal. 4.3.1. Effect of pH environment. Fenton process was reported to have better treatment efficiency to operate in acidic environment, and the removal efficiency in neutral condition was still low. Two experiments were conducted to investigate the effect of pH and the results were shown in Figure 4.5. The degradation at neutral pH was decreased in general. At the first 30 seconds, the degradation was fast, and became slow afterwards. At [Fe2+] = 50 M, the higher H2O2 concentration resulted in better tetracycline removal. The maximum removal was found around 46.7% at neutral environment and 71.0% at acidic condition.. Figure 4.5 The degradation of Tetracycline by Fenton process in different pH.. 29.
(41) 4.3.2. Degradation efficiency at the presence of organic macromolecules. In this study, citrate, humic acid and -cyclodextrin were added in the Fenton process to simulate impact of the coexisting organic macromolecules on the degradation. In the presence of citrate in acidic condition, the degradation efficiency was markedly lower than those in the absence of citrate (Figure 4.6). A coexisting organic macromolecule may compete with the target compound and facilitate the hydroxyl radical production, resulting in a possible change in organic removal efficiency. In Figure 4.6A, at the presence of -cyclodextrin in [Fe2+]/[H2O2] = 50 M /50 M, the coexisting organic macromolecules have increased the degradation efficiency than that in the classic Fenton process, but the degradation efficiency decreased in [Fe2+]/[H2O2] = 50 M /100 M (Figure 4.6B). The humic acid molecules may capture the tetracycline molecules in acidic condition, leading to the decrease in tetracycline concentration. At the presence of coexisting organic macromolecules in neutral condition, the initial drop in tetracycline concentration implied that the macromolecules might chelate with tetracycline before degradation taking place (Figure 4.7). In Figure 4.7A, the competition between tetracycline and citrate or humic acid were obvious. While the coexisting organic molecules was degraded by hydroxyl radicals, the combined tetracycline molecules might be released back to the solution, causing the degradation efficiency to increase slightly.. 30.
(42) Figure 4.6 The degradation of Tetracycline by Fenton process at pH 3 with coexisting organic macromolecules. (A) [Fe2+] = 50 M and [H 2O2] = 50 M. (B) [Fe2+] = 50 M and [H2O2] = 100 M.. 31.
(43) Figure 4.7 The degradation of Tetracycline by Fenton process at pH 7 with coexisting organic macromolecules. (A) [Fe2+] = 50 M and [H 2O2] = 50 M. (B) [Fe2+] = 50 M and [H2O2] = 100 M.. 32.
(44) 4.4. Mechanism of Tetracycline degradation by Fenton. 4.4.1. Tetracycline degradation by Classic Fenton process. In this study, tetracycline was degraded by classic Fenton process at pH 3 and 7 and the samples were collected at 0, 30, 300 seconds after the reaction took place, which were analyzed by ESI-MS using negative mode to investigate the m/z ratio between 150 to 1000. The m/z ratio of tetracycline was around 443.14. The results are shown in Figure 4.8 and Figure 4.9. The concentration of tetracycline decreased during the reaction, and it molecular structure decomposed to smaller intermediates. The peaks of m/z ratio between 200 to 300 were inferred as those intermediates, and the intensity increased as the reaction proceded.. 33.
(45) Intens. x104. 190417_pH3 CF1-1_negl_3_01_33158.d: -MS, 0.2-0.5min #12-30. (A). 1.25. 1.00 443.1408 0.75 563.0853 0.50 216.9112 0.25. 0.00 x10⁴ 1.50. 705.0142. 846.9417. 190417_pH3 CF1-2_negl_2_01_33156.d: -MS, 0.2-0.5min #11-28. (B). 1.25. 1.00. 0.75. 0.50. 443.1409. 216.9106 278.8216. 563.0864 0.25. 402.8019 325.1833. 0.00 x10⁴ 1.50. 705.0130. 846.9414. 190417_pH3 CF1-3_negl_1_01_33154.d: -MS, 0.2-0.5min #10-28. (C). 1.25. 1.00. 0.75. 0.50 216.9099. 443.1399. 278.8212. 563.0853. 0.25 325.1820. 402.8005. 705.0109. 846.9390. 0.00 200. 300. 400. 500. 600. 700. 800. 900. m/z. Figure 4.8 The mass spectrum of tetracycline degradation by Fenton Process at pH 3 for samples collected before reaction (A), 30 seconds (B) and 300 seconds (C) after reaction started.. 34.
(46) Intens. x104. 190417_pH7 CF 1-1_negl_15_01_33182.d: -MS, 0.2-0.6min #11-34. (A) 443.1399. 4. 3. 2 232.9031 194.9475 1. 400.1353 273.0764. 622.6791. 0 x104. 190417_pH7 CF 1-2_negl_14_01_33180.d: -MS, 0.2-0.5min #12-29. (B) 4. 443.1403. 3. 2. 232.9035 194.9477. 1 271.0617. 622.6801. 0 x104. 190417_pH7 CF 1-3_negl_13_01_33178.d: -MS, 0.2-0.5min #12-29. (C) 4. 3. 2. 443.1399. 232.9033 194.9477. 1 271.0619. 622.6792. 0 200. 300. 400. 500. 600. 700. 800. 900. m/z. Figure 4.9 The mass spectrum of tetracycline degradation by Fenton Process at pH 7 for samples collected before reaction (A), 30 seconds (B) and 300 seconds (C) after reaction started.. 35.
(47) 4.4.2. Tetracycline degradation at the presence of organic macromolecules in acidic environment. In this study, citrate, humic acid and -cyclodextrin were used as the coexisting organic macromolecules in the Fenton process to enhance the target compound degradation. Samples were collected at 0, 30, 300 seconds after the reaction took place. Analysis similar to those without co-existing macro-organicmolecules. The m/z ratio of tetracycline, citrate, -cyclodextrin were around 443.14, 190.02, 971.28 under negative mode, respectively. In Figure 4.10, the intensity of tetracycline decreased significantly in the first 30 seconds and the decreasing trend changed to a slower fashion from 30 to 300 seconds. However, the intensity of citrate before reaction was lower than the others, indicating that citrate and tetracycline might form chelating complexes which increased the observed intensity. The humic acid is a macromolecule with various functional groups, so its respective signal might not be observed in Figure 4.11. Due to the huge molecular structure of humic acids, it might adsorb aqueous tetracycline, causing a decrease in tetracycline concentration before Fenton reaction taking place. However, in acidic environment the intensity of tetracycline mass spectroscopy exhibited a decreasing trend after the reaction took place. In Figure 4.12, the intensity of -cyclodextrin has decreased, inferring that -cyclodextrin might act as another target compound and consumed hydroxyl radicals.. 36.
(48) Intens. x104. 190417_pH3 C 2-1_negl_6_01_33164.d: -MS, 0.2-0.6min #12-33. (A). 1.25. 1.00 191.0205. 443.1401. 0.75. 0.50 563.0846. 248.8633 0.25. 504.2932 0.00 x10⁴ 1.50. 1.25. 705.0130. 846.9393. 190417_pH3 C 2-2_negl_5_01_33162.d: -MS, 0.2-0.5min #13-27. (B) 191.0209. 1.00. 0.75. 443.1408. 0.50. 260.8734 402.8010. 0.25. 0.00 x10⁴ 1.50. 1.25. 563.0857 504.9347. 705.0131. 846.9398. 190417_pH3 C 2-3_negl_4_01_33160.d: -MS, 0.2-0.4min #13-26. (C) 191.0209. 1.00. 0.75. 443.1401. 0.50. 260.8735. 563.0854 402.8014. 0.25. 705.0127. 846.9402. 0.00 200. 300. 400. 500. 600. 700. 800. 900. m/z. Figure 4.10 The mass spectrum of citrate presented tetracycline degradation by Fenton Process at pH 3 for samples collected before reaction (A), 30 seconds (B) and 300 seconds (C) after reaction started.. 37.
(49) Intens. x104. 190417_pH3 HA 3-1_negl_9_01_33170.d: -MS, 0.2-0.5min #14-27. (A). 1.25 443.1404 1.00. 0.75 585.0677 0.50 276.8511 358.1265. 0.25. 705.0130. 216.9112 0.00 x10⁴ 1.50. 868.9228. 966.8982. 190417_pH3 HA 3-2_negl_8_01_33168.d: -MS, 0.2-0.4min #14-25. (B). 1.25. 1.00 443.1405 0.75 260.8732. 0.50. 563.0853 402.8003. 0.25. 705.0131. 182.8878 0.00 x10⁴ 1.50. 846.9428. 190417_pH3 HA 3-3_negl_7_01_33166.d: -MS, 0.2-0.5min #12-27. (C). 1.25. 1.00. 443.1403. 0.75. 0.50. 260.8727 563.0857. 0.25. 216.9096. 402.7994 705.0130. 846.9392. 0.00 200. 300. 400. 500. 600. 700. 800. 900. m/z. Figure 4.11 The mass spectrum of humic acid presented tetracycline degradation by Fenton Process at pH 3 for samples collected before reaction (A), 30 seconds (B) and 300 seconds (C) after reaction started.. 38.
(50) Intens. x104. 190417_pH3 AC 4-1_negl_12_01_33176.d: -MS, 0.2-0.4min #13-26. (A). 443.1406. 1.25. 1.00. 0.75. 248.8652. 358.1266. 0.25 216.9095 0.00 x10⁴ 1.50. 971.2876. 563.0851. 0.50. 705.0129. 846.9412. 909.2603. 190417_pH3 AC 4-2_negl_11_01_33174.d: -MS, 0.2-0.4min #13-25. (B). 1.25. 1.00 443.1412 0.75 278.8206. 0.50. 971.2880 563.0851. 0.25. 0.00 x10⁴ 1.50. 214.8591. 676.0576. 765.1873. 897.2248. 190417_pH3 AC 4-3_negl_10_01_33172.d: -MS, 0.2-0.4min #13-26. (C). 1.25. 1.00. 443.1395. 0.75. 0.50. 278.8209. 971.2864. 589.0685 0.25 676.0574. 765.1921. 839.7120. 915.9443. 0.00 200. 300. 400. 500. 600. 700. 800. 900. m/z. Figure 4.12 The mass spectrum of -cyclodextrin presented tetracycline degradation by Fenton Process at pH 3 for samples collected before reaction (A), 30 seconds (B) and 300 seconds (C) after reaction started.. 39.
(51) According to the literature, Wang and Wang (2018) compared the trimethoprim degradation by Fenton process to the Fe(II)-activated persulfate process. The result has showed that hydrogen peroxide caused a better degradation efficiency than that in the peroxydisulfate process, which was similar to the results obtained in this study. Moreover, many studies used UV-activated persulfate to degrade organic compounds. Delavaran Shiraz et al. (2018) proved that both UV and ferrous ions activated PDS at the same time and degraded catechol up to 99.1%. However, UV irradiation was not employed in this study, causing the degradation efficiency of Fe2+ activated PDS lower than that in classic Fenton process. A previous study demonstrated that humic acid might act as another target compound, and facilitate the reduction of ferric ions to ferrous ions to increase hydroxyl radicals production, resulting in a higher degradation efficiency (Fan et al., 2013). However, in this study, the degradation efficiency decreased because macromolecules consumed the oxidants. Although the coexisting molecules competes with target compounds in the process, the suitable target compound may form the complex that assisted the electron transfer activity between ferric and ferrous ions to enhance the removal efficiency by generating more hydroxyl radicals.. 40.
(52) Chapter 5. Conclusion. In the tetracycline degradation by Fenton process, the more reagents were added, the higher degradation efficiency occurred. The best reagent concentration ratio to operate Fenton process was [Fe2+]/[H2O2] = 100 M /100 M, causing 79.6% degradation of tetracycline in acidic condition. The concentration of hydrogen peroxide and ferrous ions affected the hydroxyl radical production. Comparing to the degradation experiments of persulfate degradation, hydrogen peroxide showed the best removal efficiency, and peroxymonosulfate showed a stronger oxidizing ability than peroxydisulfate. Sulfate radicals may not only interact with target compound but also with ferrous ion. The degradation pattern of peroxydisulfate was different from that in Fenton process, in which fast stage and slow stage occurred in sequence. In the neutral environment, the degradation efficiency by Fenton process decreased. The maximum removal was 46.7% when [Fe2+]/[H2O2] = 100 M /100 M. In the presence of coexisting organic macromolecules, citrate showed a lower removal efficiency than that without citrate; humic acid interacted with tetracycline in the beginning, leading to a decrease in tetracycline concentration; -cyclodextrin showed a better removal efficiency in [Fe2+]/[H2O2] = 50 M /50 M in acidic condition. In neutral condition, macromolecules might chelate with tetracycline and the degradation efficiency increased slightly because the tetracycline molecules combined with coexisting organic molecules might be released back during the degradation process.. 41.
(53) REFERENCE Aiken, G.R. (1985). Humic substances in soil, sediment, and water : geochemistry, isolation, and characterization (New York (N.Y.) : Wiley). Barhoumi, N., Olvera-Vargas, H., Oturan, N., Huguenot, D., Gadri, A., Ammar, S., Brillas, E., and Oturan, M.A. (2017). Kinetics of oxidative degradation/mineralization pathways of the antibiotic tetracycline by the novel heterogeneous electro-Fenton process with solid catalyst chalcopyrite. Applied Catalysis B: Environmental 209, 637-647. Bielski, B.H.J., Cabelli, D.E., Arudi, R.L., and Ross, A.B. (1985). Reactivity of HO2/O−2 Radicals in Aqueous Solution. Journal of Physical and Chemical Reference Data 14, 1041-1100. Christensen, H., Sehested, K., and Corfitzen, H. (1982). Reactions of hydroxyl radicals with hydrogen peroxide at ambient and elevated temperatures. The Journal of Physical Chemistry 86, 1588-1590. Connell, S.R., Tracz, D.M., Nierhaus, K.H., and Taylor, D.E. (2003). Ribosomal protection proteins and their mechanism of tetracycline resistance. Antimicrobial agents and chemotherapy 47, 3675-3681. de Melo, B.A.G., Motta, F.L., and Santana, M.H.A. (2016). Humic acids: Structural properties and multiple functionalities for novel technological developments. Materials Science and Engineering: C 62, 967-974. Delavaran Shiraz, A., Takdastan, A., and Borghei, S.M. (2018). Photo-Fenton like degradation of catechol using persulfate activated by UV and ferrous ions: Influencing operational parameters and feasibility studies. Journal of Molecular Liquids 249, 463-469. Duggar, B.M. (1948). AUREOMYCIN: A PRODUCT OF THE CONTINUING SEARCH FOR NEW ANTIBIOTICS. Annals of the New York Academy of Sciences 51, 177-181. Fan, C., Horng, C.-Y., and Li, S.-J. (2013). Structural characterization of natural organic matter and its impact on methomyl removal efficiency in Fenton process. Chemosphere 93, 178-183. Fan, C., Tsui, L., and Liao, M.C. (2011). Parathion degradation and its intermediate formation by Fenton process in neutral environment. Chemosphere 82, 229-236. Fan, G., Cang, L., Fang, G., Qin, W., Ge, L., and Zhou, D. (2014). Electrokinetic delivery 42.
(54) of persulfate to remediate PCBs polluted soils: Effect of injection spot. Chemosphere 117, 410-418. Fang, G., Gao, J., Dionysiou, D.D., Liu, C., and Zhou, D. (2013). Activation of Persulfate by Quinones: Free Radical Reactions and Implication for the Degradation of PCBs. Environmental Science & Technology 47, 4605-4611. Gryzenia, J., Cassidy, D., and Hampton, D. (2009). Production and accumulation of surfactants during the chemical oxidation of PAH in soil. Chemosphere 77, 540545. Hoseinzadeh Hesas, R., Wan Daud, W.M.A., Sahu, J.N., and Arami-Niya, A. (2013). The effects of a microwave heating method on the production of activated carbon from agricultural waste: A review. Journal of Analytical and Applied Pyrolysis 100, 111. Ikeya, K., Sleighter, R.L., Hatcher, P.G., and Watanabe, A. (2015). Characterization of the chemical composition of soil humic acids using Fourier transform ion cyclotron resonance mass spectrometry. Geochimica et Cosmochimica Acta 153, 169-182. Jayson, G.G., Keene, J.P., Stirling, D.A., and Swallow, A.J. (1969). Pulse-radiolysis study of some unstable complexes of iron. Transactions of the Faraday Society 65, 2453-2464. Kaur, K., and Crimi, M. (2014). Release of Chromium from Soils with Persulfate Chemical Oxidation. Groundwater 52, 748-755. Leenheer, J.A., and Croué, J.-P. (2003). Peer Reviewed: Characterizing Aquatic Dissolved Organic Matter. Environmental Science & Technology 37, 18A-26A. Liang, C., Huang, C.-F., and Chen, Y.-J. (2008). Potential for activated persulfate degradation of BTEX contamination. Water Research 42, 4091-4100. Lin, A.Y., Yu, T.H., and Lateef, S.K. (2009). Removal of pharmaceuticals in secondary wastewater treatment processes in Taiwan. J Hazard Mater 167, 1163-1169. Ling, L., Zhang, D., Fan, C., and Shang, C. (2017). A Fe(II)/citrate/UV/PMS process for carbamazepine degradation at a very low Fe(II)/PMS ratio and neutral pH: The mechanisms. Water Research 124, 446-453. Metelitsa, D.I. (1971). Mechanisms of the Hydroxylation of Aromatic Compounds. Russian Chemical Reviews 40, 563-580. Mirza, M.A., Ahmad, N., Agarwal, S.P., Mahmood, D., Khalid Anwer, M., and Iqbal, Z. (2011). Comparative evaluation of humic substances in oral drug delivery. Results 43.
(55) in Pharma Sciences 1, 16-26. Nidheesh, P.V., and Gandhimathi, R. (2012). Trends in electro-Fenton process for water and wastewater treatment: An overview. Desalination 299, 1-15. Ocampo-Pérez, R., Leyva-Ramos, R., Rivera-Utrilla, J., Flores-Cano, J.V., and SánchezPolo, M. (2015). Modeling adsorption rate of tetracyclines on activated carbons from aqueous phase. Chemical Engineering Research and Design 104, 579-588. Rastogi, A., Al-Abed, S.R., and Dionysiou, D.D. (2009). Effect of inorganic, synthetic and naturally occurring chelating agents on Fe(II) mediated advanced oxidation of chlorophenols. Water Research 43, 684-694. Rothschild, W.G., and Allen, A.O. (1958). Studies in the Radiolysis of Ferrous Sulfate Solutions: III. Air-Free Solutions at Higher pH. Radiation Research 8, 101-110. Rush, J.D., and Bielski, B.H.J. (1985). Pulse radiolytic studies of the reactions of HO2/O2 with Fe(II)/Fe(III) ions. The reactivity of HO2/O2 with ferric ions and its implication on the occurrence of the Haber-Weiss reaction. J Phys Chem; (United States), Medium: X; Size: Pages: 5062-5066. Sauvé, S., and Desrosiers, M. (2014). A review of what is an emerging contaminant. Chemistry Central journal 8, 15-15. Sehested, K., Bjergbakke, E., Lang Rasmussen, O., and Fricke, H. (1969). Reactions of H2O3 in the pulse-irradiated Fe(II)-O2 system, Vol 51. Stuglik, Z., and PawełZagórski, Z. (1981). Pulse radiolysis of neutral iron(II) solutions: oxidation of ferrous ions by OH radicals. Radiation Physics and Chemistry (1977) 17, 229-233. Sun, Y., Yue, Q., Gao, B., Li, Q., Huang, L., Yao, F., and Xu, X. (2012). Preparation of activated carbon derived from cotton linter fibers by fused NaOH activation and its application for oxytetracycline (OTC) adsorption. Journal of Colloid and Interface Science 368, 521-527. Theydan, S.K., and Ahmed, M.J. (2012). Optimization of preparation conditions for activated carbons from date stones using response surface methodology. Powder Technology 224, 101-108. Velásquez, M., Santander, I.P., Contreras, D.R., Yáñez, J., Zaror, C., Salazar, R.A., Pérez-Moya, M., and Mansilla, H.D. (2014). Oxidative degradation of sulfathiazole by Fenton and photo-Fenton reactions. Journal of Environmental Science and Health, Part A 49, 661-670. Walling, C., and Goosen, A. (1973). Mechanism of the ferric ion catalyzed decomposition 44.
(56) of hydrogen peroxide. Effect of organic substrates. Journal of the American Chemical Society 95, 2987-2991. Wang, S., and Wang, J. (2018). Trimethoprim degradation by Fenton and Fe(II)-activated persulfate processes. Chemosphere 191, 97-105. Wang, S., Wu, J., Lu, X., Xu, W., Gong, Q., Ding, J., Dan, B., and Xie, P. (2019). Removal of acetaminophen in the Fe2+/persulfate system: Kinetic model and degradation pathways. Chemical Engineering Journal 358, 1091-1100. Yamal-Turbay, E., Jaén, E., Graells, M., and Pérez-Moya, M. (2013). Enhanced photoFenton process for tetracycline degradation using efficient hydrogen peroxide dosage. Journal of Photochemistry and Photobiology A: Chemistry 267, 11-16. Zhang, D., Yin, J., Zhao, J., Zhu, H., and Wang, C. (2015). Adsorption and removal of tetracycline from water by petroleum coke-derived highly porous activated carbon. Journal of Environmental Chemical Engineering 3, 1504-1512. Zhao, L., Hou, H., Fujii, A., Hosomi, M., and Li, F. (2014). Degradation of 1,4-dioxane in water with heat- and Fe2+-activated persulfate oxidation. Environmental Science and Pollution Research 21, 7457-7465. Zhou, J.L., Zhang, Z.L., Banks, E., Grover, D., and Jiang, J.Q. (2009). Pharmaceutical residues in wastewater treatment works effluents and their impact on receiving river water. Journal of Hazardous Materials 166, 655-661.. 45.
(57) APPENDIX A. Data analysis of the degradation of tetracycline by Fenton process Tetracycline concentration (ppm) [FeSO4] = 10 M H2O2 concentration (M). Reaction time (s). 10. 0. 48.1382. 48.7170. 46.2000. 30. 44.3794. 34.2679. 24.1410. 60. 44.3606. 34.1836. 24.0896. 90. 44.1244. 34.0146. 23.9675. 120. 44.1013. 33.6656. 23.6971. 180. 43.9437. 33.0272. 23.6639. 300. 43.4365. 32.7109. 23.5932. 600. 43.3230. 32.1562. 23.4826. 30. 50. 70. 85. 100. Tetracycline degradation efficiency (%) [FeSO4] = 10 M H2O2 concentration (M). Reaction time (s). 10. 0. 0.00. 0.00. 0.00. 30. 7.81. 29.66. 47.75. 60. 7.85. 29.83. 47.86. 90. 8.34. 30.18. 48.12. 120. 8.39. 30.90. 48.71. 180. 8.71. 32.21. 48.78. 300. 9.77. 32.86. 48.93. 600. 10.00. 33.99. 49.17. 30. 50. 46. 70. 85. 100.
(58) Tetracycline concentration (ppm) [FeSO4] = 30 M Reaction time (s). H2O2 concentration (M) 10. 30. 50. 70. 85. 100. 0. 45.8872. 45.6451. 46.6009. 30. 34.5379. 32.0763. 23.3229. 60. 34.1148. 31.0175. 22.7682. 90. 32.8650. 30.0336. 22.7620. 120. 31.7407. 29.5479. 22.2876. 180. 31.7143. 28.5839. 21.2807. 300. 30.8239. 28.2565. 20.8756. 600. 29.8463. 27.2757. 20.1816. Tetracycline degradation efficiency (%) [FeSO4] = 30 M Reaction time (s). H2O2 concentration (M) 10. 30. 50. 0. 0.00. 0.00. 0.00. 30. 24.73. 29.73. 49.95. 60. 25.66. 32.05. 51.14. 90. 28.38. 34.20. 51.16. 120. 30.83. 35.27. 52.17. 180. 30.89. 37.38. 54.33. 300. 32.83. 38.10. 55.20. 600. 34.96. 40.24. 56.69. 47. 70. 85. 100.
(59) Tetracycline concentration (ppm) [FeSO4] = 50 M Reaction time (s). H2O2 concentration (M) 10. 30. 50. 70. 85. 100. 0. 45.4421. 45.3665. 30. 31.3720. 19.0783. 60. 30.5097. 18.6013. 90. 29.6874. 18.1179. 120. 28.8528. 16.9340. 180. 28.0351. 16.2170. 300. 27.0485. 15.1377. 600. 25.3342. 13.1696. Tetracycline degradation efficiency (%) [FeSO4] = 50 M Reaction time (s). H2O2 concentration (M) 10. 30. 50. 70. 85. 100. 0. 0.00. 0.00. 30. 30.96. 57.95. 60. 32.86. 59.00. 90. 34.67. 60.06. 120. 36.51. 62.67. 180. 38.31. 64.25. 300. 40.48. 66.63. 600. 44.25. 70.97. 48.
(60) Tetracycline concentration (ppm) [FeSO4] = 70 M Reaction time (s). H2O2 concentration (M) 10. 30. 50. 70. 85. 100. 0. 44.4190. 44.7940. 46.6152. 30. 27.3876. 20.7632. 23.8376. 60. 26.8686. 19.3257. 23.0105. 90. 25.4040. 19.0744. 21.3069. 120. 25.3066. 18.5121. 20.3151. 180. 24.6277. 17.6177. 18.8823. 300. 23.1797. 15.7342. 17.7943. 600. 21.4739. 16.2359. 14.4685. Tetracycline degradation efficiency (%) [FeSO4] = 70 M Reaction time (s). H2O2 concentration (M) 10. 30. 50. 70. 0. 0.00. 0.00. 0.00. 30. 38.34. 53.65. 48.86. 60. 39.51. 56.86. 50.64. 90. 42.81. 57.42. 54.29. 120. 43.03. 58.67. 56.42. 180. 44.56. 60.67. 59.49. 300. 47.82. 64.87. 61.83. 600. 51.66. 63.75. 68.96. 49. 85. 100.
(61) Tetracycline concentration (ppm) [FeSO4] = 85 M Reaction time (s). H2O2 concentration (M) 10. 30. 50. 70. 85. 100. 0. 46.0775. 44.6179. 44.3596. 30. 28.4512. 18.2099. 23.2006. 60. 27.1741. 16.7311. 21.0238. 90. 26.2739. 15.6412. 18.9645. 120. 25.5950. 14.9115. 18.0735. 180. 25.0045. 14.2169. 17.0181. 300. 23.1772. 11.9108. 13.9421. 600. 21.2591. 11.3999. 10.7249. 85. 100. Tetracycline degradation efficiency (%) [FeSO4] = 85 M Reaction time (s). H2O2 concentration (M) 10. 30. 50. 70. 0. 0.00. 0.00. 0.00. 30. 38.25. 59.19. 47.70. 60. 41.03. 62.50. 52.61. 90. 42.98. 64.94. 57.25. 120. 44.45. 66.58. 59.26. 180. 45.73. 68.14. 61.64. 300. 49.70. 73.30. 68.57. 600. 53.86. 74.45. 75.82. 50.
(62) Tetracycline concentration (ppm) [FeSO4] = 100 M Reaction time (s). H2O2 concentration (M) 10. 30. 50. 70. 85. 100. 0. 42.7009. 43.5852. 30. 25.9660. 17.1126. 60. 24.7249. 15.3323. 90. 23.6380. 14.5931. 120. 23.2067. 13.7300. 180. 22.1496. 12.2478. 300. 21.0496. 10.5798. 600. 17.8164. 8.8829. Tetracycline degradation efficiency (%) [FeSO4] = 100 M Reaction time (s). H2O2 concentration (M) 10. 30. 50. 70. 85. 100. 0. 0.00. 0.00. 30. 39.19. 60.74. 60. 42.10. 64.82. 90. 44.64. 66.52. 120. 45.65. 68.50. 180. 48.13. 71.90. 300. 50.70. 75.73. 600. 58.28. 79.62. 51.
(63) APPENDIX B. Data analysis of the degradation of tetracycline by Fe2+ activated persulfates Tetracycline concentration (ppm) [FeSO4] = 50 M, [oxidants] = 50 M oxidants. Reaction time (s). H2O2. PDS. PMS. 0. 45.4421. 45.5456. 45.8665. 30. 31.3720. 38.1063. 30.8044. 60. 30.5097. 37.3225. 30.3180. 90. 29.6874. 36.2653. 29.8776. 120. 28.8528. 35.6109. 29.6975. 180. 28.0351. 34.6120. 29.5595. 300. 27.0485. 33.8019. 28.6199. 600. 25.3342. 31.8519. 28.3071. Tetracycline degradation efficiency (%) [FeSO4] = 50 M, [oxidants] = 50 M oxidants. Reaction time (s). H2O2. PDS. PMS. 0. 0.00. 0.00. 0.00. 30. 30.96. 16.33. 32.84. 60. 32.86. 18.05. 33.90. 90. 34.67. 20.38. 34.86. 120. 36.51. 21.81. 35.25. 180. 38.31. 24.01. 35.55. 300. 40.48. 25.78. 37.60. 600. 44.25. 30.07. 38.28. 52.
(64) Tetracycline concentration (ppm) [FeSO4] = 50 M, [oxidants] = 100 M oxidants. Reaction time (s). H2O2. PDS. PMS. 0. 45.3665. 44.6934. 45.8792. 30. 19.0783. 28.8883. 21.3571. 60. 18.6013. 28.6141. 20.3459. 90. 18.1179. 28.0635. 19.6604. 120. 16.9340. 26.1208. 19.5639. 180. 16.2170. 25.5751. 19.4739. 300. 15.1377. 22.9654. 19.0635. 600. 13.1696. 22.0977. 18.5505. Tetracycline degradation efficiency (%) [FeSO4] = 50 M, [oxidants] = 100 M oxidants. Reaction time (s). H2O2. PDS. PMS. 0. 0.00. 0.00. 0.00. 30. 57.95. 35.36. 53.45. 60. 59.00. 35.98. 55.65. 90. 60.06. 37.21. 57.15. 120. 62.67. 41.56. 57.36. 180. 64.25. 42.78. 57.55. 300. 66.63. 48.62. 58.45. 600. 70.97. 50.56. 59.57. 53.
(65) Tetracycline concentration (ppm) [FeSO4] = 100 M, [oxidants] = 100 M oxidants. Reaction time (s). H2O2. PDS. PMS. 0. 43.5852. 43.9555. 43.6411. 30. 17.1126. 25.6191. 17.8606. 60. 15.3323. 22.6480. 17.1479. 90. 14.5931. 20.2063. 16.9634. 120. 13.7300. 19.8831. 16.8298. 180. 12.2478. 19.3377. 16.8217. 300. 10.5798. 19.1919. 16.6921. 600. 8.8829. 18.7506. 16.4375. Tetracycline degradation efficiency (%) [FeSO4] = 100 M, [oxidants] = 100 M oxidants. Reaction time (s). H2O2. PDS. PMS. 0. 0.00. 0.00. 0.00. 30. 60.74. 41.72. 59.07. 60. 64.82. 48.48. 60.71. 90. 66.52. 54.03. 61.13. 120. 68.50. 54.77. 61.44. 180. 71.90. 56.01. 61.45. 300. 75.73. 56.34. 61.75. 600. 79.62. 57.34. 62.33. 54.
(66) APPENDIX C. Data analysis of the degradation of tetracycline by Fenton process in neutral environment Tetracycline concentration (ppm) [FeSO4] = 50 M H2O2 concentration (M). Reaction time (s). 50. 100. 0. 33.7711. 32.6075. 30. 23.6945. 18.1256. 60. 23.6213. 18.1225. 90. 23.3035. 17.9222. 120. 23.2379. 17.6528. 180. 22.8573. 17.6452. 300. 22.6704. 17.5312. 600. 22.5552. 17.3815. Tetracycline degradation efficiency (%) [FeSO4] = 50 M H2O2 concentration (M). Reaction time (s). 50. 100. 0. 0.00. 0.00. 30. 29.84. 44.41. 60. 30.05. 44.42. 90. 31.00. 45.04. 120. 31.19. 45.86. 180. 32.32. 45.89. 300. 32.87. 46.24. 600. 33.21. 46.69 55.
(67) APPENDIX D. Data analysis of the degradation of tetracycline by Fenton with coexisting macromolecules Tetracycline concentration (ppm) [FeSO4] = 50 M, [H2O2] = 50 M, pH = 3 [Coexisting organic macromolecules] = 50 M. Reaction time (s). Citrate. Humic acid. -cyclodextrin. 0. 42.8392. 26.7809. 45.5197. 30. 30.4878. 16.4247. 27.1379. 60. 29.7855. 15.6997. 26.5974. 90. 29.1013. 15.2187. 26.3139. 120. 28.5523. 14.9793. 26.2288. 180. 28.2972. 14.8947. 26.0744. 300. 27.8021. 14.6321. 25.9717. 600. 26.4715. 14.5004. 24.5688. Tetracycline degradation efficiency (%) [FeSO4] = 50 M, [H2O2] = 50 M, pH = 3 [Coexisting organic macromolecules] = 50 M. Reaction time (s). Citrate. Humic acid. -cyclodextrin. 0. 0.00. 0.00. 0.00. 30. 28.83. 38.67. 40.38. 60. 30.47. 41.38. 41.57. 90. 32.07. 43.17. 42.19. 120. 33.35. 44.07. 42.38. 180. 33.95. 44.38. 42.72. 300. 35.10. 45.36. 42.94. 600. 38.21. 45.86. 46.03. 56.
數據
+7
Outline
相關文件
In the second quarter of 2003, the average number of completed units in each building was 11, which was lower than the average value for 2002 (15 units). a The index of
6 《中論·觀因緣品》,《佛藏要籍選刊》第 9 冊,上海古籍出版社 1994 年版,第 1
The first row shows the eyespot with white inner ring, black middle ring, and yellow outer ring in Bicyclus anynana.. The second row provides the eyespot with black inner ring
Isakov [Isa15] showed that the stability of this inverse problem increases as the frequency increases in the sense that the stability estimate changes from a logarithmic type to
Robinson Crusoe is an Englishman from the 1) t_______ of York in the seventeenth century, the youngest son of a merchant of German origin. This trip is financially successful,
fostering independent application of reading strategies Strategy 7: Provide opportunities for students to track, reflect on, and share their learning progress (destination). •
An elementary energy method is introduced in [18] based on a macro-micro decomposition of the equation into macroscopic and microscopic components to analyze the
(c) Draw the graph of as a function of and draw the secant lines whose slopes are the average velocities in part (a) and the tangent line whose slope is the instantaneous velocity
