Comparison of Recapture Rates and Estimates of Fishing and Natural
Mortality Rates of Japanese Eel Anguilla japonica between Different
Origins and Marking Methods in a Mark-Recapture Experiment in the
Kaoping River, Southern Taiwan
Yu-Jia Lin1, Su-Lean Chang2, Mei-Yu Chang1, Shih-Huan Lin1, Tzyy-Ing Chen2, Mao-Sen Su2,
Wei-Cheng Su3, and Wann-Nian Tzeng1,*
1Institute of Fisheries Science, College of Life Science, National Taiwan University, Taipei 106, Taiwan 2Division of Biotechnology, Fisheries Research Institute, Pingtung 928, Taiwan
3Fisheries Research Institute, Keelung 202, Taiwan
(Accepted January 18, 2010)
Yu-Jia Lin, Su-Lean Chang, Mei-Yu Chang, Shih-Huan Lin, Tzyy-Ing Chen, Mao-Sen Su, Wei-Cheng Su, and Wann-Nian Tzeng (2010) Comparison of recapture rates and estimates of fishing and natural mortality
rates of Japanese eel Anguilla japonica between different origins and marking methods in a mark-recapture experiment in the Kaoping River, southern Taiwan. Zoological Studies 49(5): 616-624. In total, 100 wild
Japanese eels marked by microchips, 146 by pectoral fin clipping, and 100 cultured eels marked by microchips and 436 by caudal fin clipping were released in the lower reach of the Kaoping River, southern Taiwan. Recapture rates of marked wild eels did not significantly differ between individuals marked by microchips and pectoral fin clipping (p = 0.51), but did differ between cultured eels marked by microchips and caudal fin clipping (p = 0.01). For wild and cultured eels marked by microchips, cultured eels had a significantly higher recapture rate than wild eels (p < 0.001), and eel length at release did not affect the recapture rates (p = 0.38). According to the Akaike information criterion corrected for the sample size, estimates of fishing and natural mortality rates differed between pectoral fin clipping and microchips in wild eels. However, neither rate differed between pectoral fin clipping and microchip in cultured eels. Both eel origin and marking method might influence the recapture rate and mortality rate estimates. Different behaviors of cultured eels in the wild and reaction to the marking process are possible reasons. Higher mortality rates of wild eels marked by pectoral fin clipping were unexpected, probably due to a size-related mortality rate, behavioral changes, or mortality associated with pectoral fin clipping. http://zoolstud.sinica.edu.tw/Journals/49.5/616.pdf
Key words: Japanese eel, Mark-recapture, Recapture rate, Mortality rates.
*To whom correspondence and reprint requests should be addressed. Tel: 886-2-33662887. Fax: 886-2-23639570. E-mail:[email protected]
T
he Japanese eel Anguilla japonica is acatadromous fish, widely distributed in northeastern Asia (Tesch 2003). Eels are of high commercial value, with heavy exploitation of elvers in estuaries to meet the demands for eel culture (Tzeng 1984, Tzeng and Chang 2001). Yellow and silver eels are also exploited by fishermen because of the high price of wild eels (Tatsukawa 2003, Lin and Tzeng 2008). However, the population of A. japonica has
dramatically declined since the 1970s (Ringuet et al. 2002, Tatsukawa 2003, Dekker 2003). Hence, improved management and conservation of eels are strongly urged (Stone 2003).
Knowledge of the fishing and natural mortality rates is essential for successfully managing a fish resource, and mark-recapture experiments are widely used to estimate fishing and natural mortality rates of animals of different taxonomic
groups (Seber 1982, Lebreton 1992, Schwarz and Seber 1999). However, the design of mark-recapture experiments sometimes has to be modified due to practical limitations. The recapture rate may be influenced by such modifications, and additional variability may enter into the estimation of mortality rates (Lebreton 1992, Zabel 2005).
First, the fish may be from the wild or from culture ponds. Fish marked and released are generally collected from an experimental area, but in practice, fish from rearing ponds are used at times, either to increase the number of fish released or to evaluate differences in behavior and survival of reared fish in the wild environment (Saloniemi et al. 2004). Second, the fish may be marked by different marks or tags. Some kinds of marks, like fin clipping, are economical and easily applied (McFarlane et al. 1990), but they may produce only limited information. Other tags, like coded wire tags (CWTs), contain more information (e.g., individual identities). However, their expensive price and relative larger size may prevent their wide application. One possible compromise is to mark a certain number of fish using informative tags (e.g., CWTs) and the rest by the more-economical fin clipping (Hammer and Blankenship 2001, Labonne and Gaudin 2005). But the effects of using different marks on the conclusions of mark-recapture experiments are little known (Briand et al. 2005).
To estimate fishing and natural mortality rates for the Japanese eel, a mark-recapture experiment was conducted in the lower reach of the Kaoping River, southern Taiwan, in Aug. 2006. The released eels differed in their origin (wild and cultured) and marking method (microchip or fin clipping). In this study, the recapture rates and estimated fishing and natural mortality rates were compared between the different origins and marking methods to elucidate their possible influences on the mark-recapture experiment.
MATERIALS AND METHODS Study area
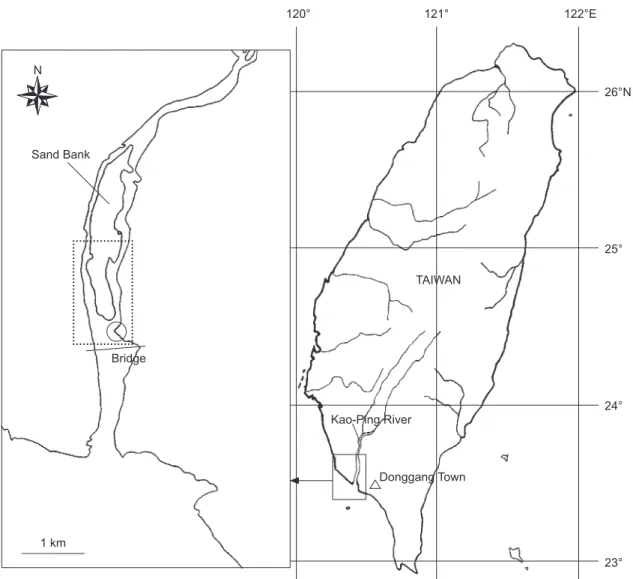
The Kaoping River is the largest river in southern Taiwan (120°50'E, 22°40'N, Fig. 1) with a length of about 171 km and drainage area
of 3256 km2. The annual precipitation cycle is
characterized by a dry season (Oct. to Mar.) and a rainy season (Apr. to Sept.), which produces highly fluctuating water levels in the middle reaches, but
generally water levels are relatively stable in the lower reaches of the river (Shiao et al. 2003). The lower reach is one of the most important fishing grounds for elvers, as well as for yellow and silver eels in Taiwan (Lin and Tzeng 2008). The fishing
area is approximately 1.2 km2 (Han and Tzeng,
2006). The mean water temperature of the fishing area ranges from lows of 21-23°C in winter to a high of 28°C in midsummer (Chen 2005). Its mean salinity is around 15‰ and ranges 10‰-32‰. Collection of wild and cultured eels for marking
In total, 246 wild eels were collected by fishermen using shrimp nets from the fishing grounds in the lower reach. A shrimp net is an elongated trap composed of 25 netted cells. Its length is around 7.2 m with several openings. Usually 20 shrimp nets are interconnected in a line, and they are deployed in the afternoon and retrieved the next morning. Details of gear information and selectivity are given in our previous study (Lin and Tzeng 2008). Wild eels were collected from Kaoping River and acclimated in outdoor ponds at the Fisheries Research Institute of Taiwan, Donggang Town for 2 mo before marking. The water temperature of the ponds was not controlled, and the salinity was kept at 15‰, similar to that at the release site. Their total lengths (TLs) ranged 21.1-86.1 cm, and total weights (TW) ranged 5-915 g.
In total, 536 cultured eels were collected from 2 nearby outdoor freshwater culture ponds in Donggang Town. They were reared from elver stage for more than 2 yr and had longer total lengths (46-92.5 cm) and higher total weights (127-1326 g) than the wild eels (Table 1). Three months before marking, the salinity of the ponds in the eel farms was gradually increased from 0‰ to 15‰ for 1 mo, and then remained at 15‰ for another 2 mo. During this acclimatization period, these cultured eels were fed common feed as usual. The cultured eels were sent to the institute 1 wk before marking and reared in ponds with conditions as close as possible to those of wild eels.
Mark, release, and recapture
All eels were anesthetized with 2-pheno-xyethanol, and their total length and weight were measured to the nearest 0.1 cm and 1 g, respectively. They were then marked either with
system, AVID, CA, USA) or by fin clipping. Each microchip has a unique code and is approximately 15 mm long and 3 mm in radius. Only eels of > 40 cm were chosen for microchip injection because they were large enough. The microchip was injected into the dorsal musculature below the dorsal fin of 100 wild and 100 cultured eels (Simon and Dörner 2005). After injection, the chips were checked immediately with a multimode reader (Power Track IV, AVID). If the code failed to be recognized or was read incorrectly, this microchip was discarded and a new one was used on the same eel to ensure readability.
Pectoral fin clipping (P-FC) was applied to the remaining wild eels, while caudal fin clipping (C-FC) was applied to the remaining cultured eels. The pectoral or caudal fin was clipped to the
base using surgical scissors. After marking, the eels were allowed to recuperate in outdoor ponds for 2 d, and no loss of microchip or death due to marking occurred. Therefore, the short-term death rate due to marking and the short-term tag loss rate could be neglected.
The marked eels were released on the fishing grounds on 15 Aug. 2006 (Fig. 1). After release, eels were collected from the fishing ground by 3 cooperating fishermen, all using the same type of gear. All eels caught were anesthetized on ice, transferred to the Donggang laboratory, their total lengths and weights were measured to the nearest 0.1 cm and 1 g, respectively, and the presence of marks (microchips or clipped fins) was identified.
Fig. 1. Donggang Town (open triangle), the fishing ground for Japanese eel Anguilla japonica in the lower reach of the Kaoping River
(enclosed area) in southern Taiwan. The open circle indicates the release site. Scale bar = 1 km.
26°N 25° 24° 23° Donggang Town Kao-Ping River TAIWAN 122°E 121° 120° Sand Bank Bridge 1 km N
Comparison of recapture rates and time
Recapture rates, defined as the total number of recaptures divided by the total number released, were compared first and then the mortality rates were estimated (Lebreton et al. 1992). Considering recapture to be a binomial process, the recapture of eels with different marks was separately tested in wild (P-FC vs. CHIP) and cultured eels (C-FC vs. CHIP) by logistic regression analyses. The influence of origin on the recapture rates was possibly confounded by eel length at release since cultured eels were larger than wild eels (Table 1). Thus the effects of origin and length at release on the recaptures of eels marked by CHIP were also examined by logistic regression analyses (Dodson 2002). In addition, the apparent distribution of recapture times was also compared among marking methods and origins using the Kolmogorov-Smirnov (KS) test. The maximum-likelihood estimates of recapture rates and the corresponding 95% confidence intervals (CIs) from a profile likelihood (Lebreton et al. 1992) were also calculated. The above computations were
performed using SAS® (vers. 8.01, SAS Institute,
Chicago, IL, USA).
Estimation of mortality rates and model selection
After release, eels were continuously collected, without re-release to the fishing ground. To estimate fishing (F) and natural mortality rates (M) using this type of data, Gulland (1955) proposed a likelihood function:
L = m[1 - (F + M) (1 - eF -(F+M)T)]N-n Fne-(F+M) Σ
i=1 n
ti;
where N is the number of fish tagged and
released, n is the number recaptured, ti is the
recapture time for recaptured fish i, m is the combination constant = N!/n!(N-n)!, and T is the last recapture time. F and M were estimated by maximizing L using a nonlinear optimization in R (vers. 2.7.2, Owen 2006). Details of Gulland’s method can be found in Seber (1982), Hearn et al. (1987), Farebrother (1988), and Leigh (1988).
Comparisons of the mortality rate estimates between different marking methods and origins were done by model selection (Lebreton et al. 1992, Burnham et al. 1995, Buckland et al. 1997). Different models associated with different hypotheses about the effects of origins and marking methods on estimates of F and M values were constructed, and the corresponding maximized likelihood values were calculated. Interaction terms were not used because the marks applied differed between origins. The Akaike information criterion corrected for sample
size (AICc) was calculated to select the best
model fitting the data. AIC weights (WAICc) were
calculated to represent the weight of evidence in favor of 1 model being the best given the observed data.
RESULTS Number of eels recaptured
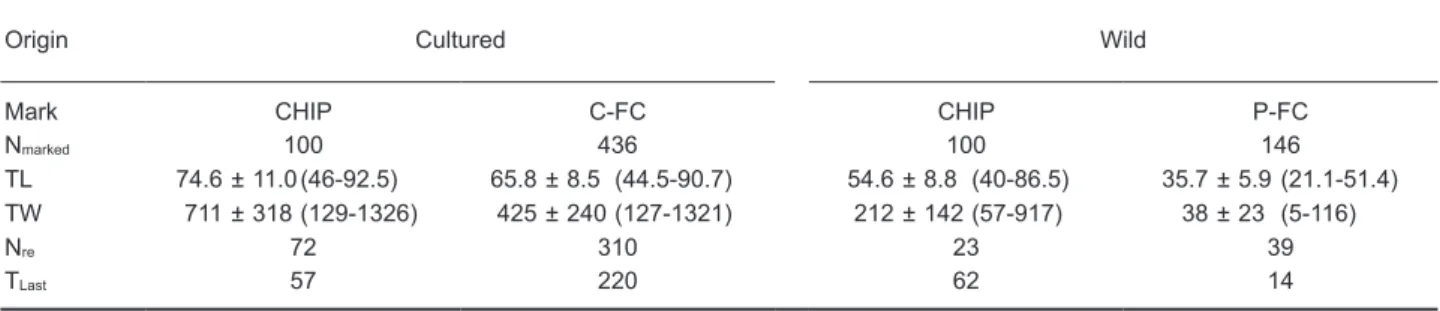
In total, 444 of 782 eels were recaptured, including 72 cultured eels with CHIP, 310 cultured eels with C-FC, 23 wild eels with CHIP, and 39 wild eels with P-FC from the release until Dec. 2008 (Table 1). The 1st recaptures occurred the day after release. The recapture rate substantially Table 1. Mean ± SD (range in brackets), total length (TL, cm), total weight (TW, g), and number of Anguilla
japonica marked and released (Nmarked). Nre is the number of eels recaptured, and TLast is the time elapsed
from the release to the last recapture (d). Eels were from the wild (Wild) or culture ponds (Cultured) and were marked by a microchip (CHIP) or caudal fin or pectoral fin clipping (C-FC or P-FC)
Origin Cultured Wild
Mark CHIP C-FC CHIP P-FC
Nmarked 100 436 100 146
TL 74.6 ± 11.0 (46-92.5) 65.8 ± 8.5 (44.5-90.7) 54.6 ± 8.8 (40-86.5) 35.7 ± 5.9 (21.1-51.4) TW 711 ± 318 (129-1326) 425 ± 240 (127-1321) 212 ± 142 (57-917) 38 ± 23 (5-116)
Nre 72 310 23 39
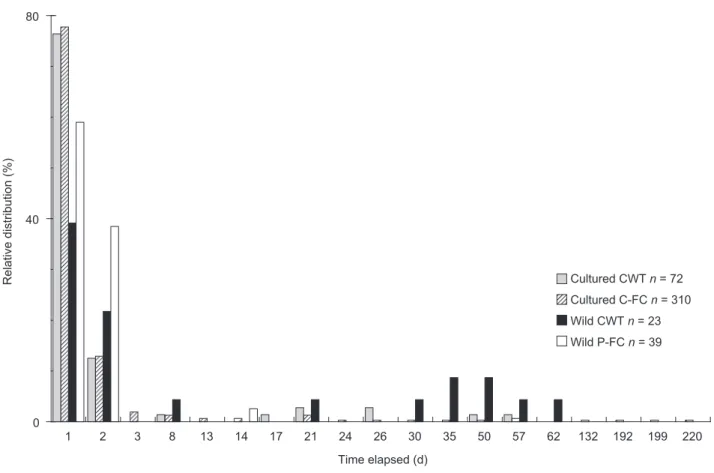
decreased with time (Fig. 2). Most eels (more than 90%) were recaptured during the 1st 8 d, but occasional recaptures occurred up to day 60 after release. Despite continued fishing, few eels were recaptured after 2 mo, except for 4 cultured eels with CHIPs that were recaptured at 132-220 d after release (Fig. 2).
Different recapture rates and times between marking methods and origins
Recapture rates did not significantly differ between wild eels marked by CHIP and P-FC
(logistic regression, Wald χ2 = 0.43, p = 0.51).
The recapture rate of wild eels (pooled marking methods) was 25.2% (95% CI: 20.1%-30.9%). Cultured eels marked by CHIP had a significantly higher recapture rate (72%, 95% CI: 65%-78%) than cultured eels marked by C-FC (58%, Wald
χ2 = 6.89, p = 0.01). For wild and cultured eels
marked by CHIP, the recapture rate of wild eels (23%) was significantly smaller than that of
cultured eels (logistic regression, Wald χ2 = 17.56,
p < 0.001). But the eel length at release did not
significantly affect the recapture of eels marked by
CHIP (Wald χ2 = 0.79, p = 0.38). Meanwhile, the
distributions of recapture times significantly differed between wild eels marked by CHIP and P-FC (KS test, p = 0.042). But they did not significantly differ between cultured eels marked by CHIP and C-FC (p = 0.81).
Model selection for fishing and natural mortality rates
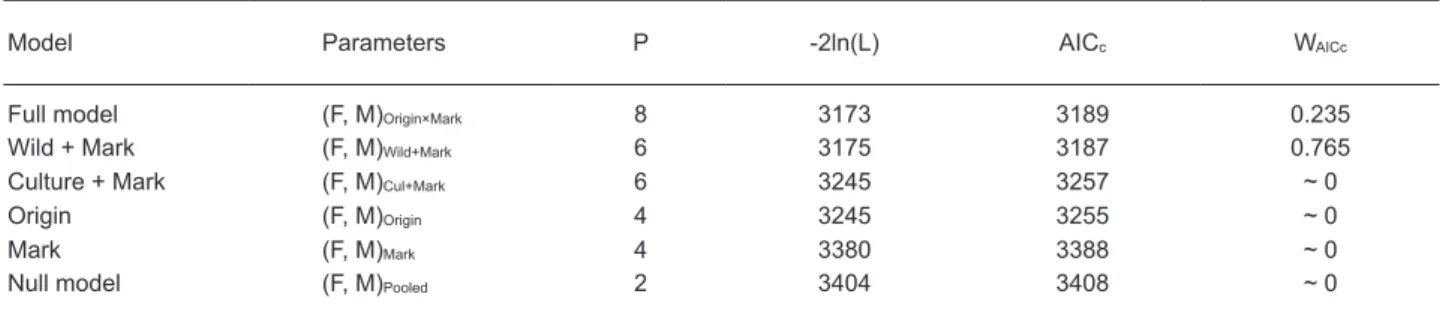
The best model was the wild + mark model, namely the parameters differed among marking methods in wild eels but not among cultured eels,
according to the AICc (Table 2). The full model
was the 2nd-best model, but the weights were
much smaller (WAICc = 0.235). This indicated
that the estimates of F and M were influenced by both eel origins and marking methods. Marking effects (CHIP vs. P-FC) were apparent in wild eels but appeared much smaller in cultured eels. According to the best model selected, estimates of
F and M (95% CIs) were 0.024 (0.015-0.036) and
0.079 (0.055-0.111) yr-1 for wild eels marked by
0 40 80
1 2 3 8 13 14 17 21 24 26 30 35 50 57 62 132 192 199 220 Time elapsed (d)
Relative distribution (%) Cultured CWT n = 72
Cultured C-FC n = 310 Wild CWT n = 23 Wild P-FC n = 39
Fig. 2. Relative distribution of recapture dates for recaptured eels by eel origins and marking method (CHIP, microchip; C-FC, caudal
CHIP, 0.254 (0.177-0.357) and 0.698 (0.526-0.918)
yr-1 for wild eels marked by P-FC, and 0.243
(0.207-0.284) and 0.098 (0.081-0.113) yr-1 for
cultured eels, respectively (Table 3). DISCUSSION
Different recapture rates between origins and marking methods
For eels marked with CHIPs, cultured eels had a higher recapture rate than did wild eels, while the length at release was not significant. Wild eels released had previously been caught by shrimp nets, and of course they were large enough to be vulnerable again. Net avoidance by marked eels was also found not to be significant for wild European eels (Dekker 1989). Nearly all cultured eels exceeded the median length of the catch (410 mm, Lin and Tzeng 2008), implying that they were possibly fully vulnerable to the fishing gear. Therefore, it is reasonable that the length at release did not affect the recapture rate. Thus, behavioral differences between wild and cultured eels are possible reasons accounting for their different recapture rates.
Wild eels were possibly better accustomed to finding natural shelter, such as crevices under rocks or to bury themselves in the sand or mud bottom (Dou and Tsukamoto 2003, Aoyama et al. 2005). The inexperienced cultured eels were not as familiar with the wild habitats, and they might have chosen all possible shelters, including shrimp nets. Therefore, cultured eels were likely more vulnerable to the fishing gear, leading to the higher recapture rate, especially in the first 2d after release (Fig. 2).
Cultured eels marked by C-FC had a smaller recapture rate than cultured eels marked with CHIPs. Once they were not caught by the fishing gear and had found suitable habitats, they probably were more sedentary until the caudal fin had fully recovered. The recapture of cultured C-FC eels after 6 mo possibly supports this explanation. But the exact reason is not clear. In addition, why the recapture rate was not affected by the marking method in wild eels is still unknown, possibly also due to behavioral differences between wild and cultured eels.
Table 2. Number of parameters (P), -2 log likelihood values (-2 ln(L)), Akaike information criterion corrected
for the sample size (AICc) and corresponding weights (WAICc, ~ 0 indicates < 10-5) for estimates of the fishing
and natural mortality rates. Wild + Mark indicates model parameters for wild eels with different marking methods, while Cul + Mark is for cultured eels
Model Parameters P -2ln(L) AICc WAICc
Full model (F, M)Origin×Mark 8 3173 3189 0.235
Wild + Mark (F, M)Wild+Mark 6 3175 3187 0.765
Culture + Mark (F, M)Cul+Mark 6 3245 3257 ~ 0
Origin (F, M)Origin 4 3245 3255 ~ 0
Mark (F, M)Mark 4 3380 3388 ~ 0
Null model (F, M)Pooled 2 3404 3408 ~ 0
Table 3. Estimates of corresponding 95% confidence interval (in parentheses) of fishing (F) and natural (M) mortality rates (yr-1)
Origin Wild Cultured
Marking method CHIP P-FC Pooled
F 0.024 (0.015-0.036) 0.254 (0.177-0.357) 0.243 (0.207-0.284) M 0.079 (0.055-0.111) 0.698 (0.526-0.918) 0.098 (0.081-0.113) CHIP, microchip; P-FC, pectoral fin clipping.
Different recapture times and estimates of mortality rates between origins and marking methods
The distribution of recapture times and the best model for F and M showed consistent patterns in that they differed between marking methods in wild eels while they did not differ in cultured eels. This is expected because F and
M were estimated from the recapture time, which
reflects the recapture history. The F value of the cultured eels was about 10 times higher and the M value was 24% higher. A higher F value in cultured eels was due to the high number of recaptures and short recapture times, which were probably related to the activity of seeking suitable shelter. Cultured eels were still being caught after 2 mo (Fig. 2). This may imply that cultured eels might also have the ability to adapt to and survive in the wild environment. Cultured eels that escaped in July 2004 due to Typhoon Mindulle could be found in eel catches in 2005 and 2006 (Chu et al. 2006, Lin and Tzeng 2008), which also supports the ability of cultured eels to survive in the study area.
Higher F and M values for wild eels marked by P-FC were unexpected because the recapture rates of wild eels marked by CHIP and P-FC did not significantly differ. More than 97% of wild eels marked by P-FC were recaptured in the 1st 2 d after release, and none was recaptured after 2 wk (Fig. 2), which consequently resulted in the high values of F and M. Pectoral fin regeneration (Coombs et al. 1990, Rogers et al. 2005) seems unlikely because the recapture period from release to last recapture was short (14 d after release). Emigration of marked eels causes overestimation of fishing mortality and underestimation of the natural mortality (Seber 1982), which appears insufficient to explain the observed higher values for both F and M. Possible explanations are (1) size-dependent mortality (The body sizes of wild eels marked by P-FC were smaller than those by CHIP, and these small-sized wild eels probably experienced higher mortality than larger eels.) and (2) behavioral change resulting from the pectoral fin clipping. Wild eels with a clipped pectoral fin might be less able to escape shrimp nets due to impaired mobility thus resulting in higher fishing mortality. The remainder that escaped the nets might be less active while recovering from the clipping, or may have a smaller home range than wild eels marked by CHIP. Hence, they were not available for subsequent samplings. However, the evidence in this study is insufficient to draw firm
conclusions.
Validity of the assumptions in the mark-recapture experiments
The fishing efforts remained stable throughout the study period (Lin and Tzeng 2008), so the assumption of a constant F seems reasonable. However, it is unclear whether it is reasonable to assume a constant M. Thus the estimate of M is regarded as an average of the eels of all age and size groups in this period.
Most of recaptures occurred in the 1st wk, implying that marked eels probably did not have enough time to mix with the wild population. If the sampling were random, then the non-random distribution of the marked population may have little influence on the vital statistics (Ricker 1975). The fishermen did not concentrate their efforts on specific regions, but deployed their shrimp nets parallel and evenly along the riverside (Lin and Tzeng 2008). Therefore, the sampling by shrimp nets is considered random to some degree, and the estimates and F and M might not have been seriously affected.
All A. japonica marked by CHIP, C-FC, or P-FC survived during the 2-d recovery period, so the short-term tag-associated mortality was 0. The long-term mortality due to marking was found to be small for A. anguilla and A. rostrata (Thomassen et al. 2000, Caron et al. 2003, Simon and Dörner 2005). Therefore, long-term mortality due to injection of a microchip was probably small for A.
japonica. However, the long-term mortality due to
fin-clipping is unclear.
The instantaneous loss rate of microchips was also 0 in this study because the loss was checked after injection and during the 2 d recovery period. The microchip was injected following Simon and Dörner (2005), who found the long-term tag loss rate to be negligible. Thus the long-term tag loss rate for the microchip was probably small.
On the other hand, the long-term loss rate of fin clipping depends on the regeneration of the clipped fin and the disappearance of identifiable scars. For common carp in tropical Bangalore, most fish with clipped pectoral and caudal fins could be still identified even after 6 mo (Basavaraju et al. 1998). Most of the eels were recaptured within 2 mo after release, which might be relatively short for the clipped fins to regenerate without identifiable scars. The recapture of C-FC cultured eels after 220 d also implies that the fins had not fully regenerated, and clipped eels could still be
identified.
Marked or tagged anguillids are sedentary and are usually recaptured near the release site (Oliveira 1997, Baras et al. 1998, Aoyama et al. 2002, Jellyman and Sykes 2003, Laffaille et al. 2005). A preliminary study was conducted in a place 1 km upstream of the fishing ground on 28 Sept. 2005 that 198 wild and 519 cultured eels were marked and released. The recapture rate in the fishing ground after 180 d was extremely low (5.55% for wild and 1.5% for cultured eels), implying that A. japonica had fairly restricted movement from the nearby upstream site to the study area.
Estimates of F and M for A. japonica
F values of wild eels likely ranged 0.015-0.351
yr-1, while using Pauly’s empirical formula (Pauly
1980) and growth parameters from otolith data (Lin and Tzeng 2009), M was estimated to be 0.294
yr-1 for the study area. This estimate of M was
between the values of wild eels marked by CHIP
and P-FC. F and M were 0.31 and 0.23 yr-1 for A.
anguilla on the Swedish coast (Svedäng 1999) and
0.27 and 0.25 yr-1 for A. rostrata in Chesapeake
Bay, USA (Weeder and Uphoff 2003). However, comparable studies or reports about F or M for yellow-eel stage A. japonica from other regions are not available. Thus it is still unclear whether our estimates of F and M are reasonable or not. Subsequent studies or estimations from other approaches (e.g., length-frequency data) may be feasible in the future.
CONCLUSIONS
The recapture rate, recapture time, and fishing and natural mortality rates of Anguilla
japonica in the lower reach of the Kaoping River
in southern Taiwan were influenced by eel origins and marking methods applied. Wild eels marked by pectoral fin clipping had higher estimates of fishing and natural mortality rates than wild eels marked by microchips. On the contrary, fishing and natural mortality rates appeared to be less influenced by the use of microchips or caudal fin clipping in cultured eels. Behavioral differences in wild eels rather than size differences are a possible reason explaining the lower recapture rate of cultured eels. The higher mortality rate of wild eels marked by pectoral fin clipping was probably associated with size-related mortality, changes in
behavior, or additional mortality due to pectoral fin clipping. However, the aspects in which cultured eels differed from wild ones and whether pectoral fin clipping influenced the mortality rate, behavior, or both of wild eels are still unclear.
Acknowledgments: This study was financially supported by the National Science Council of Taiwan (NSC94-2313-B-002-070, NSC95-2313-B-002-027, and NSC96-2313-B-002-008). We are thankful to colleagues in the Fishery Biology Laboratory, Institute of Fisheries Science, National Taiwan University and the cooperative fishermen for specimen collection and measurement. Special thanks go to B.M. Jessop, B. Knights, and anonymous reviewers for providing valuable comments and suggestions on this manuscript.
REFERENCES
Aoyama J, S Sasai, MJ Miller, A Shinoda, A Nakamura, K Kawazu, K Tsukamoto. 2002. A preliminary study of the movement of yellow and silver eels, Anguilla japonica, in the estuary of the Fukui River, Japan, as revealed by acoustic tracking. Hydrobiologia 470: 31-36.
Aoyama J, A Shinoda, S Sasai, MJ Miller, K Tsukamoto. 2005. First observations of the burrows of Anguilla japonica. J. Fish Biol. 67: 1534-1543.
Baras E, D Jeandrain, B Serouge, JC Philippart. 1998. Seasonal variations in time and space utilization by ratio-tagged yellow eels Anguilla anguilla (L.). Hydrobiologia
371/372: 187-198.
Basavraju Y, BS Devi Renuka, G Mukthayakka, L Reddy Pirishotham, GC Mair, EE Roderick, DJ Penman. 1998. Evaluation of marking and tagging methods for genetic studies in carp. J. Biosci. 23: 585-593.
Briand C, D Fatin, E Feuteun, G Fontenelle. 2005. Estimating the stock of glass eels in an estuary by mark-recapture experiments using vital dyes. Bull. Fr. Pêche Piscic.
378-379: 23-46.
Buckland ST, KP Burnham, NH Augustin. 1997. Model selection: an integral part of inference. Biometrics 53:
603-618.
Burnham KP, GC White, DR Anderson. 1995. Model selection strategy in the analysis of capture-recapture data. Biometrics 51: 888-898.
Caron F, G Verreault, E Rochard. 2003. Estimation of the population size, exploitation rate and escapement of silver-phase American eels in the St. Lawrence watershed. In: DA Dixon, ed. Biology, management, and protection of catadromous eels. Am. Fish. Soc. Symp.
33: 235-242.
Chen PH. 2005. Distribution, growth and reproduction of splendid ponyfish, Leiognathus splendens (Cuvier 1829) in the coastal waters off southern Taiwan. Master’s thesis, National Sun Yat-sen Univ., Kaohsiung, Taiwan.
Chu YW, YS Han, CH Wang, CF You, WN Tzeng. 2006. The sex-ratio reversal of the Japanese eel Anguilla japonica
in the Kaoping River of Taiwan: the effect of cultured eels and its implication. Aquaculture 261: 1230-1238.
Coombs KA, JK Bailey, CM Herbinger, GW Friars. 1990. Evaluation of various external marking techniques for Atlantic salmon. In C Parker, AE Giorgi, RC Heidinger, DB Jester Jr, ED Prince, GA Winans, eds. Fish-marking techniques. Am. Fish. Soc. Symp. 7: 142-146.
Dekker W. 1989. Death rate, recapture frequency and changes in sizes of tagged eels. J. Fish Biol. 34: 769-777.
Dekker W. 2003. Epilogue: worldwide decline of eel resources necessitates immediate action. Fisheries 28: 28-30.
Dodson AJ. 2002. An introduction to generalized linear models. 2nd ed. Boca Raton, FL: Chapman and Hall/ CRC Press.
Dou SZ, K Tsukamoto. 2003. Observations on the nocturnal activity and feeding behavior of Anguilla japonica glass eels under laboratory conditions. Environ. Biol. Fish. 67:
389-395.
Farebrother RW. 1988. Maximum likelihood estimates of mortality rates from single-release tagging studies. J. Cons. Int. Explor. Mer. 44: 229-234.
Gulland JA. 1955. On the estimation of population parameters from marked members. Biometrika 42: 269-270.
Hammer SA, HL Blankenship. 2001. Cost comparison of marks, tags and mark-with-tag combinations used in salmonid research. North Am. J. Aquacult. 63: 171-178.
Han YS, WN Tzeng. 2006. Use of the sex ratio as a means of resources assessment for the Japanese eel Anguilla japonica: a case study in the Kaoping River of Taiwan. Zool. Stud. 45: 255-263.
Hearn WS, R Sandland, J Hampton. 1987. Robust estimation of the natural mortality rate in a completed tagging experiment with variable fishing intensity. J. Cons. Int. Explor. Mer. 43: 107-117.
Jellyman DJ, JRE Sykes. 2003. Diel and seasonal movements of radio-tagged fish freshwater eels, Anguilla spp., in two New Zealand streams. Environ. Biol. Fish. 66: 143-154.
Labonne J, P Gaudin. 2005. Exploring population dynamics patterns in a rare fish, Zingel asper, through capture-mark-recapture methods. Conserv. Biol. 19: 463-472.
Laffaille P, A Acou, J Guillouët. 2005. The yellow European eel (Anguilla anguilla L.) may adopt a sedentary lifestyle in inland freshwaters. Ecol. Freshw. Fish 14: 191-196.
Lebreton JD, KP Burnham, J Clobert, DR Anderson. 1992. Modeling survival and testing biological hypotheses using marked animals: a unified approach with case studies. Ecol. Monogr. 62: 67-118.
Leigh GM. 1988. A comparison of estimates of natural mortality from fish tagging experiments. Biometrika 75:
347-353.
Lin YJ, WN Tzeng. 2008. Effects of shrimp net and cultured eels on the wild population of Japanese eel Anguilla japonica in Kao-Ping River, Taiwan. J. Fish. Soc. Taiwan
35: 61-73.
Lin YJ, WN Tzeng. 2009. Validation of annulus in otolith and estimation of growth rate for Japanese eel Anguilla japonica in tropical southern Taiwan. Environ. Biol. Fishes
84: 79-87.
McFarlane GA, RS Wydoski, ED Prince. 1990. Historical review of the development of external tags and marks. In C Parker, AE Giorgi, RC Heidinger, DB Jester Jr, ED Prince, GA Winans, eds. Fish-marking techniques. Am. Fish. Soc. Symp. 7: 9-29.
Oliveira K. 1997. Movements and growth rates of yellow-phase American eels in the Annaquatucket River, Rhode Island. Trans. Am. Fish. Soc. 126: 638-646.
Owen WJ. 2006. The R guide. Version 2.2. Department of Mathematics and Computer Science, University of Richmond.
Pauly D. 1980. On the interrelationships between natural mortality, growth parameters and mean environmental temperatures in 175 fish stocks. J. Cons. Int. Explor. Mer.
39: 175-192.
Ricker WE. 1975. Computation and Interpretation of Biological Statistics of Fish Populations. Fish. Res. Bd. Can. Bull.,
191: 95 p.
Ringuet S, F Muto, C Raymakers. 2002. Eels: their harvest and trade in Europe and Asia. TRAFFIC Bull. 19: 2-27.
Rogers MW, MJ Hansen, TD Beard Jr. 2005. Relationships between recapture rates from different gears for estimating walleye abundance in northern Wisconsin lakes. North Am. J. Fish. Manage. 25: 195-202.
Saloniemi I, E Jokikokko, I Kallio-Nyberg, E Jutila, P Pasanen. 2004. Survival of reared and wild Atlantic salmon smolts: size matters more in bad years. ICES J. Mar. Sci. 61:
782-787.
Schwarz CJ, GAF Seber. 1999. Estimating animal abundance: review III. Stat. Sci. 14: 427-456.
Seber GAF. 1982. Estimation of animal abundance. 2nd ed. London: Charles Griffin and Company.
Shiao JC, Y Iizuka, CW Chang, WN Tzeng. 2003. Disparities in habitat use and migratory behavior between tropical eel Anguilla marmorata and temperate eel A. japonica in four Taiwanese rivers. Mar. Ecol. Prog. Ser. 261: 233-242.
Simon J, H Dörner. 2005. Marking the European eel with oxytetracycline, alizarin red and coded wire tags: an evaluation of methods. J. Fish Biol. 67: 1486-1491.
Stone R. 2003. Freshwater eels are slip-sliding away. Science
302: 221-222.
Svedäng H. 1999. Vital population statistics of the exploited eel stock on the Swedish west coast. Fish. Res 40:
251-265.
Tatsukawa K. 2003. Eel resources in East Asia. In K Aida, K Tsukamoto, K Yamauchi, eds. Eel biology. Tokyo: Springer Press, pp. 293-298.
Tesch FW. 2003. The eel, 3rd ed. Oxford, UK: Blackwell Science.
Thomassen S, MI Pederse, G Holdensgaard. 2000. Tagging the European eel Anguilla anguilla (L.) with coded wire tags. Aquaculture 185: 57-61.
Tzeng WN. 1984. An estimate of the exploitation rate of Anguilla japonica elvers immigrating into the coastal waters off Shuang-Chi River, Taiwan. Bull. Inst. Zool., Academia Sinica 23(2): 173-180
Tzeng WN, CW Chang. 2001. Stock status and management prospect of freshwater eel Anguilla spp. in Taiwan. J. Taiwan Fish. Res. 9: 251-258.
Weeder JA, JHJ Uphoff. 2003. Effect of changes in growth and eel pot mesh size on American eel yield per recruit estimates in upper Chesapeake Bay. In AD Dixon, ed. Biology, management, and protection of catadromous eels. Am. Fish. Soc. Symp. 33: 169-176.
Zabel RW, T Wagner, JL Congleton, SG Smith, JG Williams. 2005. Survival and selection of migrating salmon from capture-recapture models with individual traits. Ecol. Appl. 15: 1427-1429.