Copepod diversity in the water masses of the southern East China
Sea north of Taiwan
Chang-tai Shih
a,b,), Tai-Sheng Chiu
b aResearch DiÕision, Canadian Museum of Nature, Ottawa, K1P 6P4, Canada b
Department of Zoology, National Taiwan UniÕersity, Taipei 106, Taiwan Revised 22 May 1997; accepted 26 September 1997
Abstract
The warm oceanic current Kuroshio and the continental shelf water of the East China Sea meet in the western North Pacific, north of Taiwan and form an upwelling when they converge. The intrusion of the Kuroshio westward over the East China Sea shelf thus results in complicated exchanges of waters between these two water masses. We studied the copepods in the plankton collection taken from an east–west transect crossing these waters in April 1995 when the intrusion of the Kuroshio over the East China Sea shelf was beginning to retreat. The taxonomy of copepods was carefully treated and erroneous species records reported in the literature were guarded against. We evaluated the copepod diversity, the association of copepod species, and the association of stations in these water masses. q 1998 Elsevier Science B.V. All rights reserved.
Keywords: water masses; zooplankton; Copepoda; East China Sea; Kuroshio; species association
1. Introduction
The present study is a part of the interdisciplinary
Ž .
research KEEP-II on the oceanographic exchange processes between the Kuroshio and the East China Sea shelf water. The KEEP-II study area is boxed approximately by the coordinates 26810XN 121850XE, 24850XN 123810XE, 25850XN 121830XE, and 24840XN 122840XE.
The Kuroshio, a North Pacific warm current, orig-inates from the North Equatorial Current east of the
)
Corresponding author. Present address: Institute of Oceano-graphy, National Taiwan University, Taipei, Taiwan 106. Fax:
Ž .
q886 2 363-6837. E-mail: [email protected]
Philippines and flows northward along the east coast of Taiwan. Northeast of Taiwan, it approaches a sharply curved break at the boundary of the East China Sea shelf where a year-round upwelling is formed before the Kuroshio runs northeastward along
Ž .
the shelf edge Chern et al., 1990; Liu et al., 1992 . The location of the upwelling varies, dependent on the degree of the Kuroshio intrusion onto the East
Ž .
China Sea shelf Chern and Wang, 1989 . The
wa-Ž .
ters of the Kuroshio KUR and East China Sea
ŽECS exchange and mix MIX, the upwelling verti-. Ž .
Ž .
cally in the KEEP-II study area Chern et al., 1990 . Some reports on the biological oceanography of
Ž
the KEEP-II area, including ichthyoplankton Chiu,
.
1991; Chiu and Hsyu, 1994 , biomass and
biochemi-0924-7963r98r$19.00 q 1998 Elsevier Science B.V. All rights reserved.
Ž . PII S 0 9 2 4 - 7 9 6 3 9 7 0 0 0 5 3 - 5
Ž
cal composition of zooplankton Chen and Chen,
. Ž .
1992 , phytoplankton Chen, 1995 , and primary
Ž .
productivity Shiah et al., 1995 , have been pub-lished lately. The taxonomy of copepods is, how-ever, relatively unknown despite the dominance of these animals in zooplankton, both by species
diver-Ž .
sity and numerical abundance. Tan 1967 reported 42 copepod species from his northern stations near
Ž .
our transect. Tseng 1972 studied Candaciidae taken from north of Taiwan, superimposing with our sta-tions. A list of the copepods collected from the Kuroshio downstream of our sampling sites was
Ž .
given by He and Yang 1990 .
Our objectives were to examine the copepod species diversity in the study area, to evaluate the species association among the copepods, and to cor-relate the copepod distribution with the areal water masses.
2. Material and methods
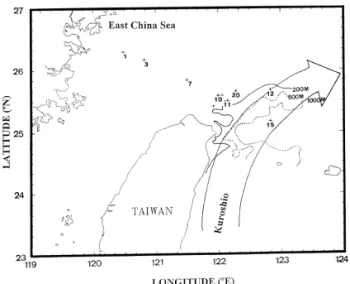
Our samples were collected from eight stations on a transect extending from 25810XN and 122851XE to 26818XN and 120829XE during cruise 416 in April
Ž .
1995 on board the Ocean Research I Fig. 1 . This transect passed through the water masses KUR, MIX, ECS, and the coastal water of the East China Sea
Fig. 1. Localities of stations of Ocean Research I cruise 416 in April 1995 with depth contours of 200, 500, and 1000 m.
ŽCOAST , and crossed various depths from the Oki-.
Ž .
nawa Trough ) 1000 m to the continental slope
Ž200–1000 m to the East China Sea shelf - 200. Ž .
m .
We collected the samples with a Bongo plankton net of 60 cm mouth diameter and 500 mm mesh. A flowmeter was mounted at the centre of the mouth opening. The net was towed obliquely from near the bottom to the surface if the bottom depth was 200 m or less, and from 200 m to the surface if the depth was more than 200 m. The samples were preserved in seawater with 5% formalin. At each station prior to plankton tow, temperature and salinity as func-tions of depth were obtained from lowering a
Sea-Ž .
Bird conductivity–temperature–depth CTD instru-ment from surface to near bottom.
In the laboratory, each sample was split by a Folsom splitter until the subsample contained 300– 500 specimens. Copepods were sorted and identified to species. The number, sex, and copepodite stage of the specimens of each species in the sample were recorded. General references for identification were
Ž . Ž .
Chen and Zhang 1965 and Chen et al. 1974 , but original and revisional references were consulted.
We used the Shannon diversity index to check the species diversity and Simpson’s evenness to measure the relative abundance of species in each station, and in stations of a water mass. The species association of the twenty most abundant species was measured by normalized Euclidean distances. The Spearman rank correlation coefficient between the stations with the UPGMA method was used to illustrate station association. All of the above statistical analyses
fol-Ž .
lowed Rholf 1989 . We selected the species
Žhereafter the selected species which accounted for.
1% or more of the total number of specimens in at least one station to calculate the Shannon diversity index, Simpson’s evenness and Spearman’s rank cor-relation coefficients.
3. Results 3.1. Water masses
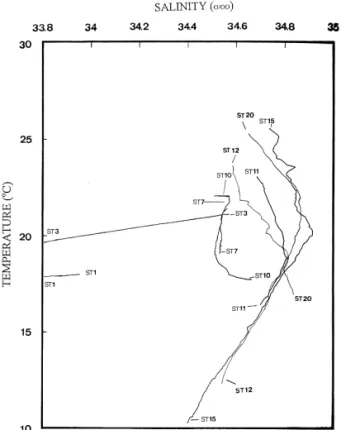
The temperature–salinity curves of the stations are shown in Fig. 2 and four types of waters are
Fig. 2. The temperature–salinity curves of cruise 416 stations showing four different types of water masses.
readily recognized. Stations 1 and 3 have low tem-perature and salinity, typically of the COAST. Sta-tions 7 and 10 are the ECS characterized by moder-ate temperature and salinity. Stations 15 and 20 belong to the KUR marked by high temperature and salinity. Stations 11 and 12 exhibit temperatures and salinity intermediate between the KUR and ECS, signifying the MIX
3.2. Systematics and species diÕersity
We found from the samples 113 species of cope-pods belonging to 43 genera and 22 families: 79 species of Calanoida, 5 species of Cyclopoida, 1 species of Harpacticoida, and 28 species of Poe-cilostomatoida. Calanus sinicus, Paracalanus
ac-uleatus, Temora discaudata, and Oncaea Õenusta
occurred in all stations. 33 species were found only once, including eight of the ten species of
Scolecith-Ž
ricidae. Number of the selected species boldfaced
.
species in Table 1 and Shannon diversity index
varied from 16 and 1.3904 in station 1 to 36 and 3.1315 in station 20. When the stations were lumped according to the water masses where they were located, the Shannon diversity index and Simpson’s evenness increased eastward from the COAST to
Ž
ECS, MIX and KUR Shannon diversity index: 2.2502, 2.6668, 2.8752, and 3.2750; Simpson’s
.
evenness: 0.6375, 0.7513, 0.8332, and 0.9504 .
3.3. Species association
The species association of the twenty most abun-dant species was measured by normalized Euclidean distances. A dendrogram showing the species associ-ation is illustrated in Fig. 3. Species with similar horizontal distribution formed a cluster or close clus-ters. For instance, Oncaea Õenusta and Temora
dis-caudata form a cluster, to which Calanus sinicus is
joined. These three species are common to all water masses. Several species, absent from or rare in the COAST andror ECS but relatively common and abundant in MIX and KUR, e.g., Oithona setigera,
Pleuromamma gracilis, Lucicutia flaÕicornis,
( )
Corycaeus Agetus flaccus, and Clausocalanus liÕidus, are joined to close clusters at the bottom of
the dendrogram.
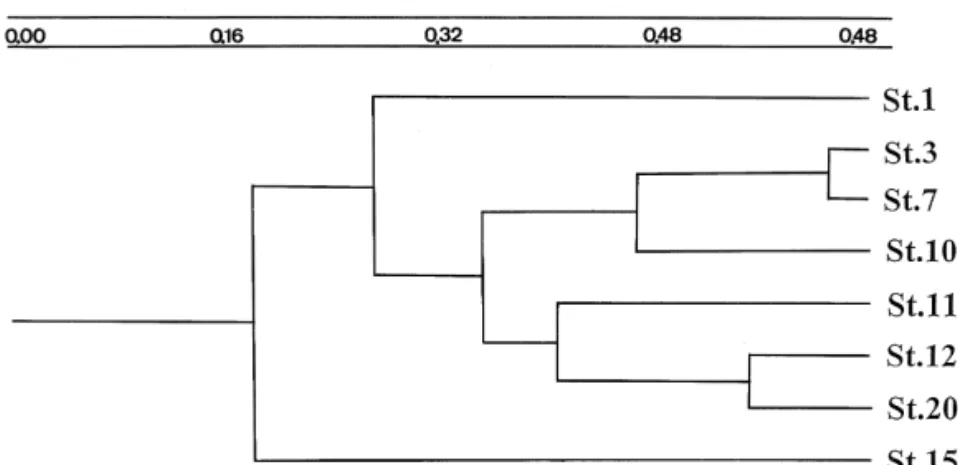
3.4. Station association
Stations 1 and 15 are at the two ends of the
Ž .
dendrogram Fig. 4 indicating most dissimilar cope-pod compositions between these two stations. It is apparent that in general the farther the stations are located from each other, the larger the distance is between them in this dendrogram, being a strong reflection of the association between the copepod faunas and water masses.
4. Discussion
Results of the biological studies in the KEEP-II program have shown a correlation between the biotic
Ž .
abundance and the water masses. Chiu 1991 and
Ž .
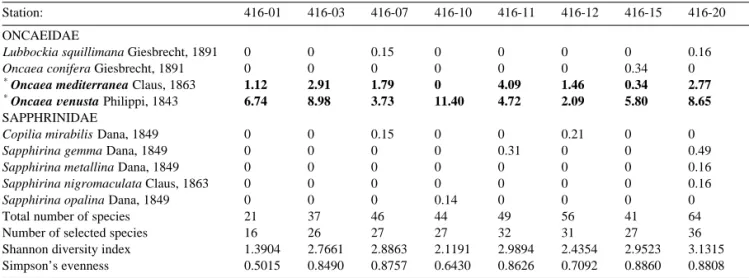
Table 1
Copepod species, % of the total number of specimens in the station, and other collection data
Station: 416-01 416-03 416-07 416-10 416-11 416-12 416-15 416-20 X X X X X X Ž . Latitude N 26818 26810 25851 25835 25829 25840 25810 25839 X X X X X X X X Ž . Longitude E 120829 120849 121829 121859 122811 122851 122851 122817 Ž . Date 1995–04– 16 16 15 17 17 19 20 19
Starting time of haul 16:40 13:20 21:37 17:13 14:52 02:19 19:45 12:49
Ž . Water depth m 53 74 76 119 255 699 1953 112 No. of specimens 1336 1648 1342 23072 2544 15344 2256 9808 3 Ž . Water filtered m 76.47 60.70 67.74 87.41 145.57 140.90 199.91 236.11 3 Specimensrm 18.62 27.15 19.81 263.95 17.48 108.90 11.29 41.54 CALANOIDA ACARTIIDAE Ž .
Acartia bifilosa Giesbrecht, 1888 U 1.12 0.24 0 0.43 0.31 0 1.71 0
Acartia danae Giesbrecht, 1889 0 0 0.45 0.29 0 0 1.02 0.65
Acartia erythraea Giesbrecht, 1889 0 0 0 0 1.26 0 0 0
Acartia negligens Dana, 1849 0 0 1.49 0 0 0 0 0.81
Acartia pacifica Steuer, 1915U 0.56 0 0 0 0 0 0 0
AETIDEIDAE
Aetideus giesbrechti Cleave, 1904 0 0 0.15 0 0.63 0.21 0 0.16
Gaetanus sp. 0 0 0 0 0 0.10 0 0
AUGAPTILIDAE
Ž .
Haloptilus longicornis Claus, 1865 0 0 0 0 1.86 0 0 1.63
Ž
Haloptilus oxycephalus Giesbrecht, 0 0 0 0 0.31 0 0 0
.
1892 CALANIDAE
)
Calanus sinicus Brodsky, 1962 52.25 11.17 6.71 29.19 9.12 31.91 4.44 0.33
Ž
Canthocalanus pauper Giesbrecht, 0.56 0.73 0.75 0.58 0.63 1.46 0 0.65
.
1888
)
Ž
Cosmocalanus darwinii Lubbock, 0 0.97 2.83 0.58 0.94 3.65 7.51 1.14
.
1860
Ž .
Mesocalanus tenuicornis Dana, 1849 0 0 0 0 3.77 0 0 0
)
Ž .
Nannocalanus minor Claus, 1863 0 2.18 1.34 1.59 1.26 2.92 1.71 3.26
Ž .
Neocalanus gracilis Dana, 1849 0 0.24 0 0 0 0 0 1.31
Ž .
Undinula zulgaris Dana, 1849 0 1.46 0 0 0 0.63 1.02 0
CANDACIIDAE
Candacia bipinnata Giesbrecht, 1892 0 0 0.15 0 0.94 0.10 0.34 0.49
Ž .
Candacia catula Giesbrecht, 1889 0 0.24 0.15 0.14 0.31 0.31 0 0
Ž .
Candacia curta Dana, 1849 0 0 0.15 0 0 0.10 0.34 0
Candacia discaudata Scott, 1909 0 0.24 0 0.14 0 0 0 0
Ž .
Candacia pachydactyla Dana, 1849 0 0 0 0 0 0 0 0.16
Ž .
Paracandacia bispinosa Claus, 1863 0 0 0 0 0 0.31 0.68 0.49
Ž
Paracandacia simplex Giesbrecht, 0 0 0.15 0 0 0 0 0.16
.
1888
Ž .
Paracandacia truncata Dana, 1849 0 0.24 0 0 0 0.10 0.68 0.33
CENTROPAGIDAE
Ž .
Centropages furcatus Dana, 1849 0.56 0 0 0.43 0.31 0 0 0
Centropages longicornis Mori, 1932U 0 0 0 0.14 0 0 0 0
CLAUSOCALANIDAE
)
Ž
Clausocalanus arcuicornis Dana, 0 5.58 1.19 0.14 3.46 4.48 1.02 1.79
.
1849
Clausocalanus farrani Sewell, 1929 0 0 0.45 0 0.63 0.73 1.37 0.81
Ž .
Clausocalanus furcatus Brady, 1883 0 0 0.30 0.87 0.94 0.83 1.02 0.33
)
Clausocalanus lizidus Frost & 0 0 0 0.29 4.40 0 0.34 0.16
Ž .
Table 1 continued
Station: 416-01 416-03 416-07 416-10 416-11 416-12 416-15 416-20
Ž
Clausocalanus mastigophorus Claus, 0 0 0.15 0 0 1.15 0 1.79
.
1863 U
)
Clausocalanus minor Sewell, 1929U 0 0 5.07 1.30 0 1.15 2.39 1.79
EUCALANIDAE
Ž .
Eucalanus elongatus Dana, 1849 0 0 0 0 0.31 0 0 0
Paraeucalanus attenuatus Dana, 1849 0 0 0.15 0.29 0 0.21 0.68 0
Rhincalanus nasutus Giesbrecht, 1888 0 0 0 0.14 0 0.42 0 0.98
Ž .
Rhincalanus rostrifrons Dana, 1852 0 3.15 1.19 0.29 0.31 0.31 0 1.47
Ž .
Subeucalanus crassus Giesbrecht, 1888 0 0.24 0.60 0.14 0.31 0.10 0 0.33
)
Ž .
Subeucalanus mucronatus Giesbrecht, 1888 0.56 4.13 3.28 3.03 0.63 0.83 0 7.01
Ž .
Subeucalanus pileatus Giesbrecht, 1888 0 0 0 1.83 0.31 0 0 0
Ž .
Subeucalanus subcrassus Giesbrecht, 1888 0 0.73 0 0 0.31 0.31 0 1.31
Ž .
Subeucalanus subtenuis Giesbrecht, 1888 2.81 0 0 0 0.31 0 0 0
EUCHAETIDAE
Euchaeta concinna Dana, 1849 0 0.24 0.30 0 0 0 0 0
Euchaeta indica Wolfenden, 1905 0 0 0.15 0 0 0 0 0
Ž .
Euchaeta longicornis Giesbrecht, 1888 0 0 0.45 0 0 0 0 0
Euchaeta media Giesbrecht, 1888 0 0 0 0 0 0.21 0 0
Euchaeta plana Mori, 1937 0 0.73 0.45 0 0 0 0 0
)
Euchaeta rimana Bradford, 1974 0 1.46 1.19 0.58 1.89 0.10 2.73 0.65
Ž .
Pareuchaeta russelli Farran, 1936 0 0 0 0.14 0 0 0 0
HETERORHABDIDAE
Ž .
Heterorhabdus papilliger Claus, 1863 0 0 0 0 0.94 0.10 0.68 0.98
LUCICUTIIDAE
)
Ž .
Lucicutia flazicornis Claus, 1863 0 0.24 1.04 0.14 3.14 1.04 5.80 2.77
MECYNOCERIDAE
.
Mecynocera clausi Thompson, 1888 0 0 0.15 0 0 0 0.34 0
METRIDINIDAE
Ž .
Pleuromamma abdominalis Lubbock, 1856 0 0 0 0 0.63 0.31 3.07 0
)
Ž .
Pleuromamma gracilis Claus, 1863 0 0 0 0 0.63 3.55 5.80 0.81
Ž .
Pleluromamma robusta Dahl, 1893 0 0 0.15 0 0.31 0.10 0.68 0.16
Ž .
Pleuromamma xiphias Giesbrecht, 1889 0 0 0 0 0 0 4.10 0
PARACALANIDAE
Acrocalanus gibber Giesbrecht, 1888 0 1.21 1.49 0.72 0.31 0.42 0 0.98
Acrocalanus gracilis Giesbrecht, 1888 0.56 0.24 0 0.87 0 0.73 0 1.96
Acrocalanus monachus Giesbrecht, 1888 0 0 0 0.14 0 0 1.02 0
Ž .
Calocalanus paÕo Dana, 1849 0 0 0 0 0.31 0.10 0.34 0.49
)
Paracalanus aculeatus Giesbrecht, 1888 1.69 6.55 0.60 7.65 1.26 4.28 1.71 0.65
Ž .
Paracalanus parzus Claus, 1863 1.12 0 0 0 0 1.15 0 0
Paracalanus serrulus Shen & Lee, 1963U 0 0 0 0 0.31 0 0 0
PONTELLIDAE
Ž .
Calanopia elliptica Dana, 1849 0 0.24 0 0 0 0 0 0
Calanopia minor Scott, 1902 0 0.24 0.30 0 0 0 0 0
Ž .
Labidocera acuta Dana, 1849 0.56 0.24 0 0.14 0 0.31 0 0
Labidocera minuta Giesbrecht, 1889 0 0.24 0 0 0 0.10 0 0
Ž .
Pontellina plumata Dana, 1849 0.56 0 0.30 0.14 0 0 0 0.16
SCOLECITHRICIDAE
Scaphocalanus echinatus Farran, 1905 0 0 0 0 0 0 0 0.16
Ž .
Scolecithricella abyssalis Giesbrecht, 1888 U 0 0 0 0 0 0 0 0.16
Ž .
Scolecithricella bradyi Giesbrecht, 1888 0 0 0 0 0.63 0 0 0.16
Ž .
Scolecithricella dentata Giesbrecht, 1892 0 0 0 0 0 0 0 0.16
Scolecithricella longispinosa Chen & Zhang, 1965 0 0 0 0 0 0.10 0 0
Ž .
Ž .
Table 1 continued
Station: 416-01 416-03 416-07 416-10 416-11 416-12 416-15 416-20
)
Ž .
Scolecithrix danae Lubbock, 1856 0.56 1.46 2.68 0.29 0 0.31 0 0.16
Scolecithrix nicobarica Sewell, 1929 0 0 0 0 0 0 0 0.32
Scottocalanus helenae Scott, 1909 0 0 0 0 0 0 0.34 0
Ž .
Scottocalanus securifrons Scott, 1893 0 0 0 0 0 0.42 0 0
TEMORIDAE
)
Ž .
Temora discaudata Giesbrecht, 1889 0.56 0.73 0.45 2.60 0.31 0.52 0.34 0.49
)
Ž .
Temora turbinata Dana, 1849 7.30 6.07 5.96 2.17 0.94 2.50 0 4.89
CYCLOPOIDA OITHONIDAE
Oithona longispina Nishida, 1976U 0 0 0 0.14 0 0 0 0
Oithona plumifera Baird, 1843 0.56 0 0.30 0 0.63 0 0 0
)
Ž .
Oithona setiger Dana, 1849 0 0 0.15 0 11.01 2.40 6.48 4.40
)
Oithona similis Claus, 1866 0 1.46 3.58 0 0 0 0 0
Oithona tenuis Rosendorn, 1913 0 0 0 0 0 0 0 0.33
HARPACTICOIDA CLYTEMNESTRIDAE
Clytemnestra scutellata Dana, 1847 0 0 0 0.14 0 0 0 0
POECILOSTOMATOIDA CORYCAEDAE
)
( )
Corycaeus Agetus flaccus Giesbrecht, 0 0.24 0.15 0 5.03 1.56 2.73 3.10
1891
( )
Corycaeus Agetus limbatus Brady, 1883 0.56 0 0 0 0 0 0 2.12
( ) Ž
Corycaeus Agetus typicus Kroyer, 0 0 0 0 0 0 1.02 0
.
1849 U
) ( )
Corycaeus Corycaeus crassiusculus 0 3.64 0.89 0.43 0 0 0.34 1.47
Dana, 1849
( )
Corycaeus Corycaeus speciosus Dana, 1.12 0.97 0 0.87 1.57 0.83 0.34 0.49
1849
( )
Corycaeus Corycaeus Õiretus Dana, 1849 0 0 0 0.14 0 0.10 0.34 0.16
( )
Corycaeus Ditrichocorycaeus asiaticus 0 1.21 0 0 0 0 0 0.16
Dahl, 1894
( )
Corycaeus Ditrichocorycaeus dahli 0 0 0 0.87 0 0.73 0 0
Tanaka, 1957
( )
Corycaeus Ditrichocorycaeys erythraeus 0 0 0 0.14 0 0 0 0.16
Cleve, 1901U
( )
Corycaeus Ditrichocorycaeus lubbockii 0 0.73 0 0 0 0 0 0.16
Giesbrecht, 1891
( )
Corycaeus Onychocorycaeus agilis Dana, 0 0 0.60 0 0 0.10 0 0
1849
( )
Corycaeus Onychocorycaeus catus Dahl, 0 0 0 1.01 0.63 0.10 0 0.49
1894
( )
Corycaeus Onychocorycaeus giesbrechti 0 0 0 0 0 0.52 0.34 0
Dahl, 1894
( )
Corycaeus Onychocorycaeus pacificus 0.56 0 0.89 1.15 0.31 0.94 0.68 0.16
Dahl, 1912U
( )
Corycaeus Urocorycaeus furcifer Claus, 0 0 0 0 0.31 0.10 0 0
1863
( )
Corycaeus Urocorycaeus lautus Dana, 0 0 0 0 0.31 0 0.34 0
1849
( )
Corycaeus Urocorycaeus longistylis Dana, 0 0 0 0 0 0 0 0.49
1849U
Ž .
Farranula carinatus Giesbrecht,1891 U 0 0 0 0 0.31 0 0 0
Ž .
Ž .
Table 1 continued
Station: 416-01 416-03 416-07 416-10 416-11 416-12 416-15 416-20
ONCAEIDAE
Lubbockia squillimana Giesbrecht, 1891 0 0 0.15 0 0 0 0 0.16
Oncaea conifera Giesbrecht, 1891 0 0 0 0 0 0 0.34 0
)
Oncaea mediterranea Claus, 1863 1.12 2.91 1.79 0 4.09 1.46 0.34 2.77
)
Oncaea zenusta Philippi, 1843 6.74 8.98 3.73 11.40 4.72 2.09 5.80 8.65
SAPPHRINIDAE
Copilia mirabilis Dana, 1849 0 0 0.15 0 0 0.21 0 0
Sapphirina gemma Dana, 1849 0 0 0 0 0.31 0 0 0.49
Sapphirina metallina Dana, 1849 0 0 0 0 0 0 0 0.16
Sapphirina nigromaculata Claus, 1863 0 0 0 0 0 0 0 0.16
Sapphirina opalina Dana, 1849 0 0 0 0.14 0 0 0 0
Total number of species 21 37 46 44 49 56 41 64
Number of selected species 16 26 27 27 32 31 27 36
Shannon diversity index 1.3904 2.7661 2.8863 2.1191 2.9894 2.4354 2.9523 3.1315
Simpson’s evenness 0.5015 0.8490 0.8757 0.6430 0.8626 0.7092 0.8860 0.8808
Species in boldface: the selected species, i.e., species with 1% or more of the total number of specimens in one or more stations. Species with asterisk: one of the twenty most abundant species in the whole collection.
Ž .
Species followed by a tick U : new records for the study area.
fish eggs, larval fishes, and zooplankton was higher
Ž .
in the midshelf stations ECS than in the upwelling
ŽMIX or oceanic stations KUR . Shiah et al. 1995. Ž . Ž .
observed that the normalized productivity measured by the 14C assimilation method was higher in the
MIX than in the COAST and KUR. Similarly Chen
Ž1995. recorded high primary productivity in the MIX and low primary productivity in the KUR.
Ž .
Chen and Chen 1992 reported that zooplankton biomass was positively correlated with upwelling
Fig. 3. Dendrogram of the twenty most abundant species measured by Euclidean distances showing the degree of relative dissimilarity of distribution between species in the water masses of the KEEP-II study area.
Fig. 4. Dendrogram of station associations calculated from Spearman’s rank correlation coefficients showing the degree of similarity in copepod faunas between stations.
indicators such as low temperature and high NO -N3
and chlorophyll a. In our collection, the copepod
Ž 3.
density number of individualsrm in the four wa-ter masses showed a decreasing order from ECS to MIX, COAST and KUR. The present study thus confirms that the biotic abundance is generally higher in the ECS and MIX and lower in the COAST and KUR.
The present work has expanded our knowledge on the copepods of the KEEP-II study area. Some
Ž .
species reported by Tan 1967 , for instance, Calanus
Ž
finmarchicus and C. helgolandicus North Atlantic
.
species, see Shih, 1979 , and Pseudocalanus gracilis
Ž
and P. minutus boreal or temperate species, see
.
Frost, 1989 , are erroneous records. The two Calanus species probably are misidentifications of C. sinicus, and the Pseudocalanus species may belong to some species of the genus Clausocalanus. Candacia
paci-Ž .
fica and C. pectinata in Tseng 1972 are
respec-Ž
tively synonyms of C. columbiae and C. armata see
.
Grice, 1963 . Fifteen species in our collection, mostly from the KUR and MIX, are new to the study area
Žmarked with a tick in Table 1 ..
Calanus sinicus is limited to the western marginal
seas of the North Pacific, and dominant in the Yel-low and East China seas. Its southern distribution limit extends to the South China Sea, especially in
Ž
winter when the northeast monsoon prevails Chen,
.
1992 . C. sinicus is the most dominant copepod in our collection except in stations 15 and 20. In
con-trast to the large number of adult females and males and numerous younger copepodids present in the COAST, ECS and MIX stations, there were only
Ž .
small numbers of adult females and no station 20
Ž .
or very few station 15 young copepodids found in the KUR stations. The occurrence of this species in the Kuroshio is probably expatriate. C. sinicus usu-ally inhabits the water over the continental shelf but
Ž
enters the coastal water from April to June Chen,
.
1992 . Its great abundance in our station 1 confirms Chen’s observation.
Euchaeta marina is widely distributed including a
number of records from the western North Pacific
ŽMori, 1937; Chen and Zhang, 1965 . Bradford. Ž1974 established and described Euchaeta rimana..
She included many previous Pacific records of E.
Ž .
marina including Mori’s under this name. She suggested that E. marina is limited to the Atlantic Ocean and Mediterranean Sea. Our specimens con-form with E. rimana in morphology.
We compared the abundance and diversity of the copepods in our study with those reported by He and
Ž . Ž
Yang 1990 from the Kuroshio just downstream of
.
our section and adjacent waters. The numbers of copepod species found in each station range from 8
Ž . Ž .
to 94 mean 51 in He and Yang 1990 and from 21
Ž .
to 64 mean 45 in our study. The Shannon species diversity index and Simpson’s evenness in our study,
Ž
respectively varying from 1.3904 to 3.1315 mean
. Ž .
Ž .
also smaller than those of He and Yang 1990 : from
Ž .
0.8898 to 5.6524 mean 3.9529 and 0.2966 to 0.8780
Žmean 0.7205 . It should be cautioned, however, that.
He and Yang included all species in their calculation, while the present study only considered the selected species
The dendrogram of the species association depicts some relationships among the twenty most abundant
Ž .
species in our collection Fig. 3 . It links the widely
Ž
distributed species in the upper part of the
dendro-.
gram and the species that at most rarely occur in the
Ž .
coastal water the lower part of the dendrogram to
Ž
close clusters. The species from Clausocalanus
ar-.
cuicornis to Scolecithrix danae that form the
mid-dle clusters of the dendrogram are, however, lacking of traits in the distribution pattern, except that they are mostly widely distributed in subtropical and trop-ical waters around the world.
The temperature–salinity curves for stations 1 and 3 are nearly straight, showing a linear T–S relation-ship in the shallow coastal area. The low salinity and low temperature are due to freshwater runoff and cold coastal currents from the north. The higher temperature and salinity in the lower water of station 3 indicate a strong influence of the ECS. This influ-ence is reflected in the dendrogram of station associ-ation where stassoci-ation 3 joins with stassoci-ation 7 in a cluster
ŽFig. 4 . Station 20 is near the most westward part of.
the Kuroshio. The characteristic T–S curve of the KUR at station 20 confirms previous report of the
Ž
westward location of the Kuroshio intrusion Hwang
.
and Tang, 1993 . The upper part of the T–S curve in station 20, however, leans toward that of stations 11 and 12, an indication of strong influence from the MIX. This influence is also demonstrated in the dendrogram of station association where stations 20
Ž .
is linked with stations 11 and 12 not 15 to form a cluster. This close similarity in T–S curves between stations also illustrates the species composition. For instance, the composition of the species is highly similar in stations 3 and 7. There are more deepwater species belonging to the Scolecithricidae in station 20 than in other stations, probably brought up to the upper layer by the upwelled Kuroshio subsurface water. Most of these scolecithricids are known from
Ž .
the Kuroshio Chen and Zhang, 1965 . A similar distribution pattern is also found in ichthyoplankton
Ž
in the intermediate waters of KUR–MIX Chiu and
.
Lee, 1991 and some mesopelagic gonostomatid species become abundant in the vicinity of station 20
ŽChen and Chiu, 1992 ..
Acknowledgements
The National Research Council of the Republic of China is thanked for a grant to support the KEEP-II research project and a research fellowship for CtS through TSC. The Canadian Museum of Nature awarded a sabbatical leave for CtS to participate in the KEEP-II project The captain and crew of the
Ocean Research I helped us to collect the samples
and other environmental data related to this study. We are grateful for the technical and logistic support given to us by Mr. J.B. Huang, Mr. W.B. Huang, Ms. K.Z. Chang, and Ms. C.C. Chen of the Eco-nomic Fish Laboratory, National Taiwan University. Dr. Y.S. Lin, then Chairman of the Zoology Depart-ment, NTU, and his staff are credited for providing CtS with working facilities. We are very grateful to two anonymous reviewers for their constructive comments on an earlier version of the manuscript.
References
Ž . Ž
Bradford, J.M., 1974. Euchaeta marina Prestandrea Copepoda,
.
Calanoida and two closely related new species from the Pacific. Pac. Sci. 28, 159–169.
Chen, C.S., Chiu, T.S., 1992. Comparison of ichthyoplankton guild in the Kuroshio edge exchange area. Terrestr., Atmos. Oceanic Sci. 3, 335–346.
Chen, H.Y., Chen, Y.L.L., 1992. Quantity and quality of summer surface net zooplankton in the Kuroshio Current-induced up-welling northeast of Taiwan. Terrestr., Atmos. Oceanic Sci. 3, 321–334.
Ž .
Chen, Q., 1992. Zooplankton of China Seas 1 . Science Press, Beijing, 87 pp.
Chen, Q.C., Zhang, S.Z., 1965. The planktonic copepods of the
Ž
Yellow Sea and the East China Sea, I. Calanoida in Chinese,
.
with English summary . Stud. Mar. Sin. 7, 20–131.
Chen, Q.C., Zhang, S.Z., Zhu, C.S., 1974. On planktonic cope-pods of the Yellow Sea and the East China Sea, II. Cyclopoida
Ž .
and Harpacticoida in Chinese, with English summary . Stud. Mar. Sin. 9, 27–76.
Chen, Y.L.L., 1995. Phytoplankton composition and productivity in response to the upwelling of northeastern Taiwan. Proc.
Ž .
Chern, C.S., Wang, J., 1989. On the water masses at northern offshore area of Taiwan. Acta Oceanogr. Taiwan. 22, 14–32. Chern, C.S., Wang, J., Wang, D.P., 1990. The exchange of Kuroshio and East China Sea shelf water. J. Geophys. Res. 95, 16017–16023.
Chiu, T.S., 1991. Variation of ichthyoplankton density across the Kuroshio edge exchange area with implication to the water masses. Terrestr., Atmos. Oceanic Sci. 2, 147–262.
Chiu, T.S., Hsyu, Y.H., 1994. Interannual variation of ichthy-oplankton density and species composition in the waters off northeastern Taiwan. Mar. Biol. 119, 441–448.
Chiu, T.S., Lee, P.Y., 1991. Initial ichthyoplankton studies in the Kuroshio edge exchange area. Bull. Inst. Zool., Acad. Sin. 30, 261–272.
Frost, B.W., 1989. A taxonomy of the marine calanoid copepod genus Pseudocalanus. Can. J. Zool. 67, 525–551.
Ž
Grice, G.D., 1963. A revision of the genus Candacia Copepoda:
.
Calanoida with an annotated list of the species and a key for their identification. Zool. Meded. 37, 171–193.
He, D., Yang, G., 1990. Distribution of the pelagic copepods in
Ž
the Kuroshio upstream and adjacent waters in spring, 1986 in
. Ž .
Chinese, with English summary . In: Sun, X. Ed. , Essay on the Investigation of Kuroshio. Ocean Press, Beijing, pp. 329– 334.
Hwang, S.J., Tang, T.Y., 1993. Distribution of CTD Observation, Distribution of Salinity Contour, Distribution of Density Con-tour. CTD Data Bank Data Report, Regional Instrument
Cen-ter, RrV Ocean Researcher I, National Science Council, Taipei, 2, pp. 1–523.
Liu, K.K., Gong, G.C., Shyu, C.Z., Pai, S.C., Wei, C.L., Chao, S.Y., 1992. Response of Kuroshio upwelling to the onset of the northeast monsoon in the sea north of Taiwan: observa-tions and a numerical simulation. J. Geophys. Res. 97, 12511– 12526.
Mori, T., 1937. The Pelagic Copepoda from the Neighbouring Waters of Japan. Soyo Company Inc., Tokyo, 150 pp., 80 pls. Rholf, F.J., 1989. Numerical Taxonomy and Multivariate Analysis
Ž .
System version 1.50 . Exeter Publ. Ltd., New York. Shiah, F.K., Gong, G.-C., Liu, K.K., 1995. A preliminary survey
on primary productivity measured by the 14C assimilation method in the KEEP area. Acta Oceanogr. Taiwan. 34, 1–15. Shih, C.-t., 1979. East–west diversity. In: van der Spoel, S.,
Ž .
Pierrot-Bults, A.C. Eds. , Zoogeography and Diversity of Plankton. Bunge Scientific Publishers, Utrecht, pp. 87–102. Tan, T.H., 1967. On distribution of copepods in the surrounding
waters of Taiwan. Report of the Institute of Fishery Biology of Ministry of Economic Affairs and National Taiwan University,
Ž .
2 2 , pp. 14–20.
Tseng, W.Y., 1972. On Copepoda of the family Candaciidae in
Ž .
the northeast sea-waters of Taiwan. In: Sugawara, K. Ed. , The Kuroshio II. Proceedings of the Second Symposium on the Results of the Cooperative Study of the Kuroshio and Adjacent Regions, Tokyo, September 28–October 1, 1970. Saikon Publishing Comp. Ltd., Tokyo, pp. 245–259.