(Received November 12, 1999; accepted April 18, 2000)
1047 INTRODUCTION
Soldering is widely used for electronic packaging processes such as surface mount technology (SMT), pin-through-hole (PTH), ball grid array (BGA), and flip-chip (FC) interconnects. Alloys of lead-tin system are the most common solder alloys used. However, because lead can result in environmental pollution, the development of lead-free solders has become an important task for electronic industries. Even though the indium-base solders are less commonly used than traditional lead-tin or tin-based solders, they possess excellent fatigue resistance.1–3 Silver is a typical thick
film material for hybrid circuits. The solderability of indium on silver substrates depends on the reactions occurring at the In/Ag interface, and the compositions and growth kinetics of interfacial reaction products (most of which are intermetallic compounds). Also the wettability of liquid indium on the surface of silver substrates will likely be influenced by the formation of these intermetallic compounds.
The interfacial reactions of traditional lead-tin or tin-based solders with silver substrates have been studied in the past. The formation of the intermetallic compound Ag3Sn at the interface of molten 60Sn40Pb
and silver substrate was observed.4,5 The kinetics and
mechanisms for the growth of intermetallic com-pounds have also been studied.6 In contrast to reports
in the literature on the interfacial reactions between
interface between liquid indium and silver substrates in the temperature range from 473 K to 673 K were studied. Electron microprobe (EPMA) analysis and x-ray diffraction (XRD) revealed that the intermetallic compound Ag2In formed as
scallops. The growth followed parabolic kinetics, suggesting that the growth was diffusion-controlled. Moreover, the activation energy calculated from the Arrhenius plot of growth reaction constants was 41.55 KJ/mole. Also, the relationship between the wettability of liquid indium on the surface of silver substrates and their interfacial reactions was clarified.
Key words: Indium, silver, intermetallic compound, kinetics, wettability
tin and silver, studies on In/Ag interfaces are rare. L. Bernstein found that an intermetallic compound Ag2In
formed in the temperature range from 523 K to 673 K,7,8 while D.M. Jacobson et al. reported that
indium reacted with silver to form the intermetallic compound AgIn2 between temperatures above the
melting point of indium and below 439 K.9 This study
is concerned with the morphology and growth kinet-ics of intermetallic compounds formed at the interface between liquid indium and silver substrates in the temperature range from 473 K to 673 K. The relation-ship between the wettability of liquid indium on the surface of silver substrates and their interfacial reac-tions is also examined.
EXPERIMENTAL
Silver substrates with a dimension of 12 mm × 12 mm × 1 mm were cut from a silver plate of 99.95 wt.% purity. A 99.99 wt.% purity indium ingot was rolled into 1 mm thickness and cut to the same size in the same manner as the silver substrates. The contact surfaces of Ag substrates were polished with fine alumina powder. For the purpose of investigating interfacial reactions, an indium specimen was in-serted between two silver substrates as a sandwich. The assemblies were then heated at 473, 498, 523, 548, 573, 623, and 673 K in an infrared furnace under a vacuum of 10–3 torr for various lengths of time. After
heating, the samples were purged with nitrogen to cool in approximately 3 min. The solder specimens were then mounted in resin, cross sectioned and
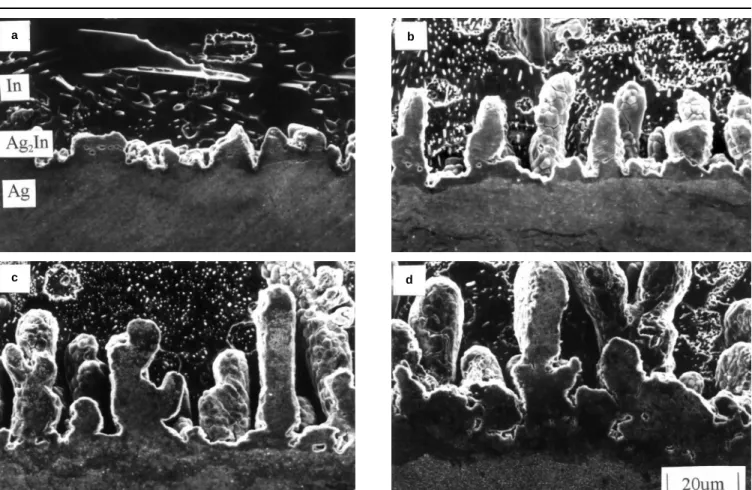
Fig. 1. Morphology of Ag/In interfacial reaction product (a) 573 K, 5 min; (b) 573 K, 10 min; (c) 573 K, 20 min; and (d) 573 K, 30 min.
Fig. 2. Morphology of Ag/In interfacial reaction product (a) 498 K, 30 min; (b) 548 K, 30 min; (c) 598 K, 30 min; and (d) 648 K, 30 min.
a b d c a b d c
polished with 1 µm and 0.3 µm alumina powder. The intermetallic compounds and their interfaces with indium were selectively etched using a solution of 10 ml HF, 10 ml H2O2, and 40 ml H2O. Most of the
observations were conducted using a scanning elec-tron microscope (SEM). The intermetallic compounds were identified with electron microprobe analysis (EPMA) and x-ray diffraction (XRD). For further clarification of the formation mechanism of interme-tallic compounds during the soldering reaction, the original Ag(s)/In(l) interface was marked by
sputtering-deposition of a Ta thin film on a partial region of Ag substrates. Ta does not react with Ag and In, and the deposition of the Ta thin film acted as a diffusion barrier at the Ag(s)/In(l) interface identifying the
origi-nal Ag(s)/In(l) interface.
Wettability was evaluated by placing an indium cylinder with 2 mm diameter and 2 mm height on a silver substrate in an infrared furnace under a vacuum of 10–3 torr. Before the test, the indium cylinders were
dipped in a mildly activated rosin flux. During heat-ing, the contact angles of the sessile drops were measured continuously by video camera.
RESULTS AND DISCUSSION
Figures 1 and 2 show the morphology of intermetallic compounds formed at the In/Ag interfaces. The micro-graphs indicate that the intermetallic compounds have a scallop morphology and grow from the In/Ag inter-face into the silver substrates. The Ag(s)/In(l) interface
migrated toward the Ag substrate (Fig. 3). The forma-tion of the scallop-shaped intermetallic compounds resulted from the dissolution of Ag into the In solder. EPMA and XRD analyses revealed that the scallops are Ag2In. As reaction time (Fig. 1) and reaction
temperature increased (Fig. 2), the Ag2In
intermetal-lic compounds grew in width but decreased in num-ber. This suggests that a ripening reaction accompa-nies the growth of the intermetallic compounds.
The morphology of the reaction fronts was some-what irregular so the growth thickness was calcu-lated through dividing the total area of intermetallics spread out on the micrograph by the width of these
Fig. 3. Result of Ta-marked experiment showing migration of Ag(s)/
In(l) interface towards the Ag substrate. Sample reaction time: 20 min
at 573 K.
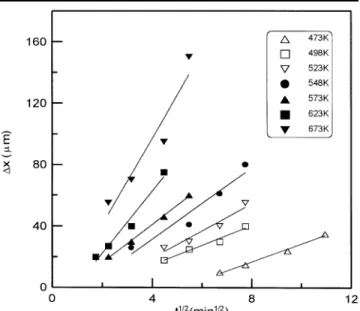
Fig. 4. The thickness of Ag2In intermetallic compound against the
square root of reaction time, for samples reacted in the temperature range from 473 K to 673 K.
×
Fig. 5. Arrhenius plot of the growth rate constant versus reaction temperatures during Ag/In interfacial reaction.
intermetallics. The growth thickness (∆x) in relation to square root of the reaction time (t) was plotted in Fig. 4. The standard deviation for intermetallic layers was between 0.2 µm and 1.5 µm. In Fig. 4, the growth rate of Ag2In had a t1/2 dependence. This indicates that
parabolic growth was observed in the case of these interfacial reactions, and the growth of intermetallic compounds was diffusion-controlled.
The parabolic growth constants kp,
kp = ∆x2 / t
for various reaction temperatures are given in Table I. Figure 5 shows an Arrhenius plot of these parabolic growth constants. The activation energy determined from this plot was 41.55 KJ/mol, similar to that of 53.6 KJ/mol for lattice diffusion of Ag in In as reported by Anthony and Turnbull.10 This indicates that the
growth mechanism of intermetallic compounds dur-ing interfacial reactions was diffusion of silver through the molten indium between the intermetallic
scal-lops, also resulted in the ripening of the scallop-type intermetallic compounds. The growth mechanism was similar to that of Cu6Sn5 formed between the eutectic
SnPb solder and Cu.11,12
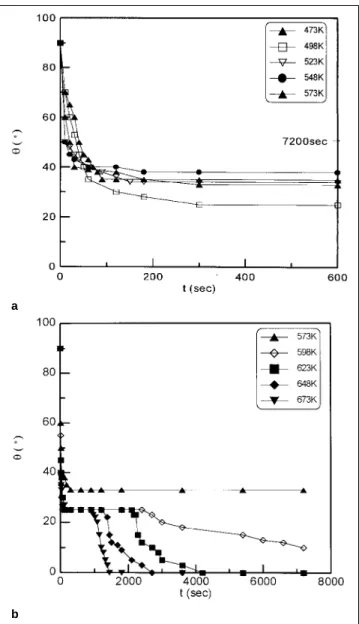
The contact angles, measured from the sessile drops of liquid indium on the surface of silver substrates at various temperatures, were plotted as a function of time as shown in Fig. 6. Figure 6a shows that, at temperatures below 573 K, the contact angles de-creased with time and remained at a constant value between 25° and 40°. At temperatures above 573 K, the contact angles also decrease to a value of about 25°. However, after remaining constant for a brief period of more than 15 min, the contact angles further decreased to a much lower value near zero, as shown in Fig. 6b. The intervals of such a transient plateau with constant contact angles decreased correspond-ing with the increase of temperatures from 598 K to 673 K. From the Ag-In phase diagram,13 the Ag
2In
intermetallic compound appeared as γ (below 573 K) and ζ(above 573 K) phases. The different wetting behavior of liquid indium on silver below, and above, 573 K is explained schematically in Fig. 7. In Fig. 7, the interfacial reaction products between liquid in-dium and silver substrate were γ-Ag2In and ζ-Ag2In
for the temperatures below and above 573 K, respec-tively. The equilibrium equations of the related inter-facial energies at the tip of the indium sessile drop could be expressed as:
σAg = σn cosθ1 + σγ/Ag (T < 573 K) σAg = σIn cosθ2 + σζ/Ag (T > 573 K)
where σ is the interfacial energy, and θ1 and θ2
represent the contact angle.
Since the γ-Ag2In phase possesses an isotypic
crys-a
b
Fig. 6. (a) Plot of contact angles versus reaction time at temperatures ranging from 473 K to 573 K; (b) plot of contact angles versus reaction time at temperatures ranging from 573 K to 673 K.
Fig. 7. Schematic diagram of the related interfacial energies at the tip of indium sessile drop at the temperatures (a) below and (b) above 573 K.
a
During the interfacial reactions of liquid indium with silver substrates in the temperature range be-tween 473 K and 673 K, the intermetallic compound Ag2In forms in the morphology of scallops. With an
increase in reaction temperature, the Ag2In
interme-tallic scallops grew in size and decreased in number. The growth of the intermetallic compound is para-bolic as a function of time indicating that the reaction was diffusion-controlled. The activation energy calcu-lated from the Arrhenius plot of growth reaction constants was 41.55 KJ/mole, consistent with that for the lattice diffusion of Ag in In (53.6 KJ/mole). This indicates that the growth mechanism of intermetallic compounds during interfacial reaction was the diffu-sion of silver in molten indium.
The wetting behavior of liquid indium on the sur-face of silver substrates at temperatures below, and above, 573 K were quite different. Below 573 K, the contact angles decreased drastically with time and remained at constant values between 25° and 40°.
1. J. Glazer, J. Electron. Mater. 23, 693 (1994).
2. S.K. Kang and A.K. Sarkhel, J. Electron. Mater. 23, 701 (1994).
3. W.J. Plumeridge, J. Mater. Sci. 31, 2501 (1996).
4. J. Campbell and H. Conrad, J. Electron. Pkg., Trans. ASME 117, 241 (1995).
5. C.R. Hall, and EI.B. Hannech, Mater. Sci. and Tech. 8, 930 (1992).
6. X.H. Wang and H. Conrad, Scripta Metall. Mater. 30, 725 (1994).
7. L. Bernstein, J. Electrochem. Soc. 113, 1282 (1966). 8. L. Bernstein and H. Bartholomew, Trans. Metall. Soc. AIME
236, 405 (1966).
9. D.M. Jacobson and G. Humpston, Soldering and Surf. Mount
Technol. 10, 27 (1992).
10. T.R. Anthony and D. Turnbull, Phys. Rev. 151, 495 (1966). 11. K.N. Tu, Acta Metall. 21, 347 (1973).
12. K.N. Tu, Mater. Chem. Phys. 46, 217 (1996).
13. T.B. Massalski, editor, Binary Alloy Phase Diagrams (Mate-rials Park, OH: American Society for Metals, 1986), p. 32. 14. V.M. Goldschmidt, Z. Physik. Chem. 133, 397 (1928). 15. W. Hume-Rothery, J.O. Betterfon, and J. Reynolds, J. Inst.