國
立
交
通
大
學
經營管理研究所
博 士 論 文
No. 134
總要素投入生產力成長、技術進步
及效率變動之研究
Total-factor Input Productivity Growth, Technical Progress,
and Efficiency Change
研 究 生:張子溥
指導教授:胡均立 教授
總要素投入生產力成長、技術進步及效率變動之研究
Total-factor Input Productivity Growth, Technical Progress,
and Efficiency Change
研 究 生:張子溥 Student:Tzu-Pu Chang
指導教授:胡均立 Advisor:Jin-Li, Hu
國 立 交 通 大 學
經 營 管 理 研 究 所
博 士 論 文
A DissertationSubmitted to Institute of Business and Management College of Management
National Chiao Tung University in Partial Fulfillment of the Requirements
for the Degree of Doctor of Philosophy
in
Business and Management October 8, 2010
Taipei, Taiwan, Republic of China
總要素投入生產力成長、技術進步及效率變動之研究
研究生:張子溥
指導教授
:胡均立 教授
國立交通大學經營管理研究所博士班
摘
要
傳統部分要素生產力指數忽略要素間互補或替代關係,也忽略了技術變動的影響; 然而總要素生產力指數無法計算個別投入要素的生產力變動情況。因此,本論文提出「總 要素投入生產力」指數,旨在總要素架構下計算單一投入要素之生產力變動。「總要素 投入生產力」指數是以Luenberger生產力指數的觀念為基礎,並利用一般化方向距離函 數加以修正,能夠在總要素架構中探討單一要素的生產力變動情形。該指數同時能夠拆 解出要素使用效率以及技術之跨期變化程度,藉此提供更深入之分析。 本論文將總要素投入生產力指數應用於能源議題與銀行議題上。首先在能源議題應 用部分,本論文探討中國大陸各省的總要素能源生產力變動。研究結果發現,中國大陸 整體在2000~2004年間的總要素能源生產力呈現負成長。根據進一步拆解,發現該生產 力負成長乃是導因於技術衰退所致,儘管整體相對效率有小幅提升。本論文同時也嘗試 找出影響總要素能源生產力變動的因素;研究發現經濟發展狀況、產業結構與能源使用 結構皆會影響總要素能源生產力指數的高低。 第二個應用是分析中國大陸銀行業總要素生產力的主要來源。本論文提出總要素投 入生產力指數的延伸模型,藉此模型可得總要素生產力變動等於個別總要素投入生產力 變動之平均。本論文將中國大陸銀行業總要素生產力分解為資金、資本和員工三種投入 生產力。研究結果發現中國大陸銀行業在2005~2009年期間的總要素生產力呈現成長趨 勢,且該成長主要是來自於資本使用的生產力提升。另外一方面,總要素生產力成長也
可歸因於技術之進步,尤其是資本使用的技術進步貢獻最大。
透過上述兩個應用,顯示本論文提出之總要素投入生產力不但能夠解決傳統生產力 指標之不足,也可提供更深入的探討與分析。
Total-factor Input Productivity Growth, Technical Progress,
and Efficiency Change
Student: Tzu-Pu Chang Advisor: Jin-Li Hu
Institute of Business and Management
National Chiao Tung University
ABSTRACT
Traditional productivity measures neglect the substitution or complement effects among all factors and do not distinguish between the contribution due to technical change and changes in efficiency. The total-factor productivity index, such as Malmquist and Luenberger productivity indices, may not evaluate single factor productivity change under a total-factor framework. Therefore, this dissertation introduces a total-factor input productivity index (TIPI), based on the Luenberger productivity index, to calculate one particular input productivity change with a total-factor concern. This proposed index can be also decomposed into change in relative efficiency and shift in technology.
This dissertation further applies the TIPI to investigate energy- and banking-related issues. With respect to the application of the energy issue, this dissertation analyzes the total-factor energy productivity change of regions in mainland China. This result shows that total-factor energy productivity presents negative growth in mainland China during 2000-2004. This energy productivity decline is mainly attributable to negative technical growth even though the relative efficiency improves. The investigation herein also explores the determinants of total-factor energy productivity change and finds that regions‟ development status, industrial structure, and energy mix affect energy productivity growth.
The second application investigates the sources of total-factor productivity change in Chinese banks. This dissertation proposes an extended TIPI model and then shows that the total-factor productivity change is equal to the arithmetic mean of the productivity changes of all inputs. Such an application decomposes the total-factor productivity change into fund, capital, and labor productivity changes of mainland China banks. This result indicates that the banking industry there presents positive total-factor productivity growth during 2005-2009. It is found that this total-factor productivity growth is mainly driven by capital usage productivity improvement. Moreover, the total-factor productivity growth can be attributed to technical progress, especially for capital usage technology. These two applications show that the total-factor input productivity index has advantages over traditional productivity measures and total-factor productivity indices.
Keywords: Total-factor input productivity; Efficiency change; Technical change; Directional
誌謝
就在本論文完成的同時,我的博士求學生涯將在此畫上句點,並向下一段人生旅途 邁進。回顧過去四年多的日子,一路上受到相當多的幫助,因此我要在這裡向所有老師、 朋友們致上最誠摯的謝意: 本論文得以順利完成,最要感謝指導教授胡均立老師的悉心指導。承蒙恩師 胡均 立教授從六年前碩士班以來一路地協助,不僅僅在學術研究之路上的啟蒙與指導,對於 未來人生規劃也給予學生許多寶貴的建議。這一切令學生銘感於心,也期待未來在學術 研究過程中能持續與恩師相互合作。 感謝研究指導委員會的丁承老師與周雨田老師,兩位老師從論文計畫書到學位口試 期間提供不少建議以及指正,使得本論文更為充實與完整。感謝林師模老師、林進財老 師、邱永和老師以及黃宗煌老師在學位論文口試給予學生相當多有用的意見,除了針對 研究內容的不足之處提出建議之外,也指出不少未來進一步研究的看法。未來學生若能 繼續在學術上發光發熱,更要感謝各位老師的指教。 在博士班作研究的日子,或許有時會有倦怠的時候,還好有許多學長姐、同學可以 分擔解憂、相互打氣。在此特別謝謝志良學長、秀瑩學姐、郁玫、世緯、疆平在最後這 一段日子的協助。此外,讀書累的時候,打排球是最好的休閒,謝謝四年來所有參與過 交大經管排球隊的學弟妹們,大家齊心協力幫所上爭取到四座獎盃,也帶給我許多歡樂 的時光。再者,謝謝幾位大學死黨的一路相挺。 感謝宜婷這麼久以來的相伴。對於我的博士班求學過程,妳始終鼓勵著我、包容我、 體諒我,這一切的一切都非常地感激。抱歉耽誤了妳不少時間(青春),未來我們還要一 貣走下去。最後謹將此論文獻給我最親愛的家人,當然也包括一直以來「默默」看著我完 成論文的兔子 Doki。 張子溥 謹致 交通大學經營管理研究所 中華民國九十九年十月十五日Table of Contents
Page
Abstract (in Chinese) i
Abstract (in English) iii
Acknowledgement (in Chinese) v
Table of Contents vi
List of Figures vii
List of Tables viii
1. Introduction 1
1.1 Motivation and Purpose 1
1.2 A Graphic Example of the Disadvantages of Prior Approaches 2
1.3 The Theoretical Concept of Proposed Index 5
1.4 Outlines of Chapters 6
2. Methodology 8
3. Application on an Energy Issue: An Empirical Study of China 13
3.1 Application Background 13
3.2 Total–factor Energy Productivity Index 16
3.3 Data and Variables‟ Descriptions 17
3.4 Results and Discussion 19
3.4.1 Total-factor energy productivity change in mainland China 19
3.4.2 Components of total-factor energy productivity growth 23
3.4.3 Determinants of TFEPI 27
3.5 Summary 29
4. Application on a Banking Issue: An Empirical Study of Banks in mainland China 33
4.1 Application Background 33
4.2 Extended Model 35
4.3 Data and Variables‟ Descriptions 37
4.4 Empirical Results 39
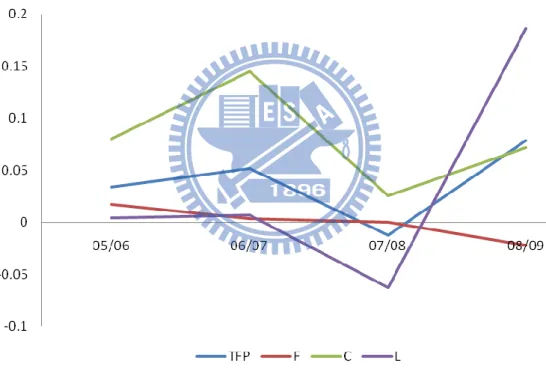
4.3.1 Productivity analysis at industry level 39
4.3.2 Productivity analysis at firm level 42
4.3.3 Further analysis of productivity and efficiency 44
5. Conclusions 49
List of Figures
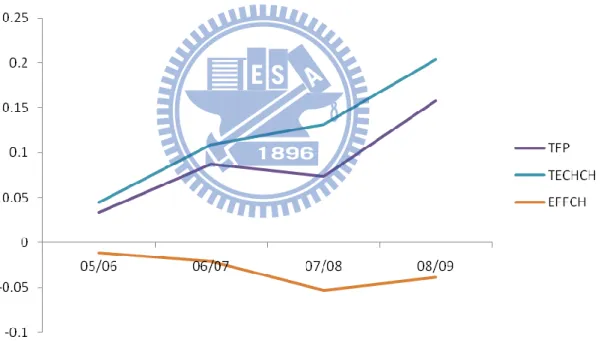
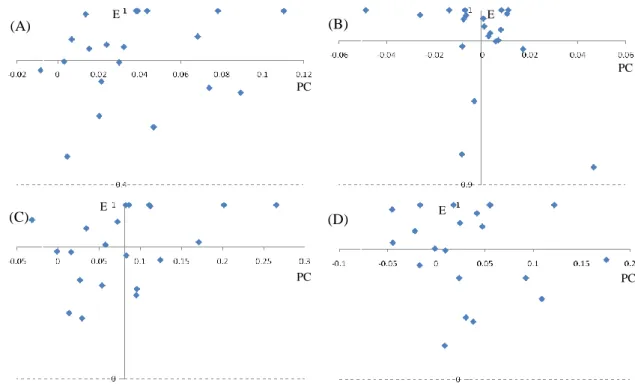
Page Figure 1.1 The graphic conception of traditional productivity, TFEE, and TIPI 3 Figure 3.1 Annual total-factor energy productivity growth among three major areas 22 Figure 3.2 Cumulated total-factor energy productivity change among three major areas 23 Figure 4.1 Annual change of TFP and total-factor input productivity 39 Figure 4.2 Cumulative changes of TFP and its components 40 Figure 4.3 The efficiency-productivity matrices of TFP and individual input 46
List of Tables
Page
Table 3.1 Summary statistics of input and output variables (2000–2004) 19
Table 3.2 Total–factor energy productivity changes by region 20
Table 3.3 Annual total–factor energy efficiency changes by region 25
Table 3.4 Annual total-factor energy technical changes by region 26
Table 3.5 Estimation results of effects of regional characteristics on TFEPI 30
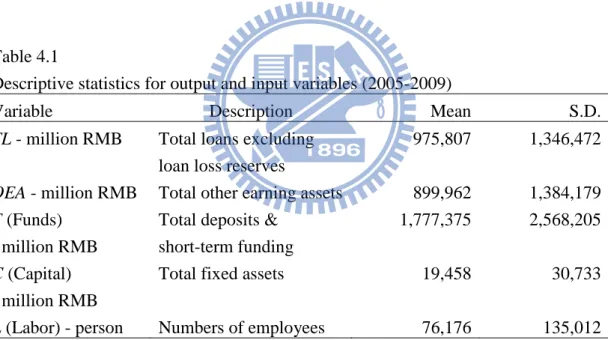
Table 4.1 Descriptive statistics for output and input variables (2005-2009) 38
Table 4.2 Annually technical changes and efficiency changes of three inputs 41
Table 4.3 Productivity growth, technical progress, and efficiency change of TFP and individual input 43
1. INTRODUCTION
1.1 Motivation and purpose
Productivity, defined as the ratio of output that is produced to the input that is used, is a measure of output from a production process, per unit of input. There are many well-known productivity measures in a variety of research fields - for example, labor productivity in factories, energy productivity in power stations, and land productivity (yield) in farming - however, these traditional measures are what is known as partial measures of productivity. Coelli et al. (1998) argue that these partial productivity measures provide a misleading conclusion if considered in isolation, because the partial productivity measures neglect the substitution or complement effects among all inputs. Hence, recent research studies in the productivity and efficiency fields consider a total factor productivity measure which involves all factors of production.
There are two famous total factor productivity indices used to study how the productivity of all inputs changes: One is the Malmquist productivity index and the other is the Luenberger productivity index. These two indices are greatly applied in different areas, such as energy and environment (e.g., Hu et al., 2005; Wei et al., 2007), the financial sector (e.g., Casu et al., 2004; Worthington, 1999), the agricultural sector (e.g., Mao and Koo, 1997; Umetsu et al., 2003), and national productivity (e.g.,Chang and Luh, 2000; Yörük and Zaim, 2005), etc. Unfortunately, the Malmquist productivity index and Luenberger productivity index cannot deal with the productivity change of a single factor under total factor framework, meaning that those indices are unavailable if we want to investigate the productivity change of one particular factor among all input factors. Therefore, this thesis tries to overcome the disadvantage of a total factor productivity index and introduce an advanced approach to measure single factor productivity change under a total-factor framework.
The main purpose of this thesis is to construct a new index, the so-called total-factor input productivity index (TIPI), to evaluate one particular input productivity change with a total-factor framework. Hence, the contribution of this thesis is to modify the disadvantages of traditional partial productivity measures and total factor productivity indices. The proposed index can then be widely applied to varied research issues. For example, we can compute the productivity growth of energy input with a total-factor (involving labor and capital inputs) concerned. Moreover, the productivity of an employee (also considering funds and capital inputs) can be evaluated when researching banking issues. Chapters 3 and 4 respectively offer two applications in energy and banking issues.
Before discussing the proposed methods any further, the following sub-sections present the advantages of this proposed index and the research flows. Subsection 1.2 gives a graphic example to illustrate the idea of a total-factor input productivity index. Sub-section 1.3 briefly describes the theoretical concept of the proposed index.
1.2 A graphic example of the disadvantages of prior approaches
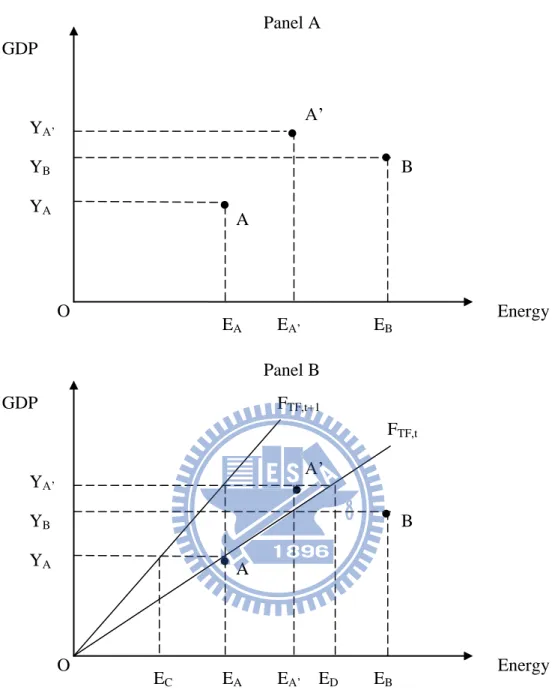
As mentioned above, a traditional productivity index neglects the substitution or complement effect between all inputs, implying that the output is produced solely by the particular input. It may hence easily underestimate or overestimate the rate of productivity growth. There is another drawback to using a traditional productivity index, i.e. it does not distinguish the contribution due to technical change and changes in efficiency. In other words, the traditional indicator assumes the technology is always consistent year after year. However, the productivity will improve, because of technical progress (Coelli et al., 1998). Hence, this thesis uses Figure 1 to illustrate the comparison between a traditional productivity index and the proposed new index using an example of energy productivity.
Figure 1.1 The graphic conception of traditional productivity, TFEE, and TIPI
Panel A of Figure 1 sketches the concept of a traditional energy productivity indicator. If two objects operate at points A and B, then their traditional energy productivity equals YA/EA and YB/EB, respectively. In this example, the energy productivity of point A is higher
than point B. When we consider that one object has increased its energy productivity from one year to the next (from point A to point A‟), the improvement of energy productivity is
GDP Energy O FTF,t+1 ● B A ● ● A‟ FTF,t EA EA‟ ED EB EC YA YB YA‟ GDP Energy O ● B A ● ● A‟ EA EA‟ EB YA YB YA‟ Panel A Panel B
equal to (YA‟/EA‟ –YA/EA)1.
Hu and Wang (2006) propose an indicator, the so-called the total-factor energy efficiency (TFEE), under a total-factor framework to compare the relative energy efficiency among regions in mainland China. They provide a measure to compare the efficiency of energy use under a total-factor framework during the same year (i.e. points A and B). I use Panel B of Figure 1 to demonstrate their ideas and consider a special case assuming the production frontier for energy use shows linearity in multi-factor framework. TFEE is a relative index that computes a ratio of minimum (target) input level to actual level for each object at each particular year. The two production frontiers, FTF,t and FTF,t+1, refer to the best
practice using the minimum energy to produce the same amount of output under a total-factor framework at years t and t+1, so that this example assumes technical growth. According to the definition, the TFEE of points A and B respectively equals EA/EA (=1) and EA‟/EB (<1),
indicating a higher efficiency if an object operates at point A.
TFEE cannot completely depict the productivity improvement due to the technical change. As shown in Panel B of Figure 1, if one object improves its energy productivity from one year to the next (from point A to point A‟), then the TFEE framework only computes the total-factor energy efficiency change (EA/EA‟–1), while not measuring the
frontier shift effect at all. Therefore, the proposed total-factor input productivity tries to extend the static TFEE to a dynamic indicator and is expected to overcome all the drawbacks discussed earlier.
1 In this article, any change is based on differences rather than more traditional ratios. For more advantages
1.3 The theoretical concept of proposed index
Hu and Wang (2006) propose the total-factor energy efficiency index defined as a ratio of the optimal-to-actual energy input, in order to compute the relative energy efficiency of each region in mainland China under a multifactor framework. As discussed above, the concept of TFEE considers the substitution and complement effects among energy and other inputs. Sequentially, Hu et al. (2006) apply the same concept in the water resource issue, but the methodology used by previous studies only focuses on computing relative energy efficiency among objects in each year such that it lacks insights with longitudinal data. Therefore, this thesis proposes an innovative method to deal with dynamic productivity changes.
To study the particular input productivity changes under a total factor framework, this thesis introduces a total-factor input productivity index that integrates the concept of the TFEE index with the Luenberger productivity index to measure the change of total-factor input productivity. The Luenberger productivity index introduced by Chambers et al. (1996), as a difference of the directional distance function, measures whether total factor productivity changes from the base period to the next period. As shown by Luenberger (1992) and Chambers et al. (1998), the directional distance function provides a flexible method to calculate both input contractions and output expansions. According to the flexibility of the directional distance function, some researchers have considered that the Luenberger productivity index is more appropriate than the well-known Malmquist productivity index (Boussemart et al., 2003; Managi, 2003). Moreover, Chambers et al. (1996) illustrates that the Luenberger productivity index can be decomposed into efficiency and technical changes.
This thesis applies a non-parametric programming method, commonly known as the data envelopment analysis (DEA) approach, to compute the total-factor input productivity change. Additionally, the proposed index can be decomposed into two components: One is the
change in relative efficiency, indicating that an object is getting closer to or farther from its annual frontier (catch-up effect or fall-behind effect). The other is a shift in the technology level of a particular input use, showing the shift in the production frontier under the total-factor framework.
Comparing to traditional parametric methods (such as the Cobb-Douglas function and translog production function), the advantage of using the DEA method is it avoids model misspecification (Boussemart et al., 2003; Wei et al., 2007). Moreover, the DEA-Luenberger index easily computes total-factor productivity change, efficiency change, and technical change. Since the DEA-Luenberger index cannot analyze the change in single factor productivity under total factor concern, the total-factor input productivity index is introduced herein to deal with this issue.
1.4 Outlines of chapters
This section provides an outline of the contents of the subsequent chapters in this thesis. The outline of chapters is as follows.
Chapter 2 Methodology: This chapter demonstrates how to construct the total-factor input productivity index in detail. The methods used, including DEA, directional distance function, and related linear programming problem, are presented here. Additionally, the steps to calculate the total-factor input productivity index are also described.
Chapter 3 Application in energy issue: This chapter applies the proposed index to research on an energy topic. An empirical study of total-factor energy productivity growth of China is executed. This empirical application further decomposes the total-factor energy productivity growth of each province into total-factor energy efficiency change and total-factor energy technical change. It provides a more detailed investigation of the energy
use performances of each province.
Chapter 4 Application in banking: This thesis also presents an application in the financial sector, i.e. the total-factor input productivity growth of mainland China banks. This application shows the total-factor input productivity of each input (such as funds, capital, and employees) in order to investigate the advantages or disadvantage of all researched banks. Chapter 5 Concluding remarks: This chapter provides the conclusions and summarizes the advanced total-factor input productivity index of this thesis.
2. METHODOLOGY
In the case of productivity growth, the Luenberger productivity index is a convenient method to overcome the drawbacks of TFEE: We first assumed that the production technology Ft models the transformation of multiple inputs, t M
R
x , into multiple outputs,
t RS
y , for each time period t, where:
{( , ) : can produce }.
t t t t t
F x y x y (2.1) The computation of the Luenberger productivity index relies on directional distance functions. Following Chambers et al. (1998), the directional distance functions could be defined at t as:
( )( , ; , ) max{ : ( , ) }.
t t t t t
t x y x y
D x y g g x g y g F (2.2)
where (gx, gy) is a nonzero vector in RM × RS . Thus, this function is defined by
simultaneously contracting inputs while expanding outputs. One notices that
( )( , ; , ) 0
t t
t x y
D x y g g , and ( )( ,t t; , ) 0
t x y
D x y g g if and only if ( ,x yt t) is on the production
frontier. Therefore, the Luenberger productivity index would be measure as follows:
1 1 1 1 ( ) ( ) 1 1 ( 1) ( 1) 1 ( , , , ) ( , ) ( , ) 2 ( , ) ( , ) , t t t t t t t t t t t t t t t t L D D D D x y x y x y x y x y x y (2.3)if the Luenberger productivity index is less than, equal to, or greater than zero, then it respectively stand for productivity regress, no change, or progress between period t and t+1.
Luenberger productivity index is a multi-factor productivity index and can calculate the total-factor productivity change of research objects. However, the commonly used Luenberger productivity index, which assumes a special case with proportional distance function, cannot deal with single factor productivity change under total-factor framework. Therefore, this thesis introduces a total-factor input productivity index which applies a
generalized directional distance function proposed by Färe and Grosskopf (2010) and an optimal-to-actual input ratio under total-factor framework to substitute all the components of Luenberger productivity index.
The proposed total-factor input productivity index (hereafter, TIPI) combines the features of Luenberger productivity index with the concept of total-factor energy efficiency proposed by Hu and Wang (2006). For the ideas of calculating TIPI, the first step is to compute the efficient level of particular input. In other words, it is important to find out the actual slack of input of each object. This paper derives the actual slack of objective input from directional distance function, a flexible tool to account for both efficient inputs and outputs when measuring efficiency. However, most literature considers a special case, assuming the directional vector (gx, gy) is equal to (x, y), to contract input and expand output
variables by an equal scale (Chambers et al., 1996; Chambers et al., 1998; Boussemart et al., 2003). It is a convenient approach but cannot obtain exact input or output slacks. Fortunately, Färe and Grosskopf (2010) introduce a generalized directional distance function and use linear programming method to acquire how many excess inputs have been employed and how many too few outputs have been produced. We illustrate the approach of Färe and Grosskopf (2010) and the relationship with the ideas of TFEE as the following:
We first define some mathematical notations. Assume that there are M inputs and S outputs for each of N objects in each time period of T. The ith input and rth output variable of the jth object is represented by t
ij
x and t rj
y in time t, respectively. Moreover, Färe and Grosskopf (2010) propose the vectors
(0, , 0,1, 0, , 0), 1,..., .
l
e l ms (2.4) where the 1 is in the lth place of the vector. Therefore, the generalized directional distance functions for the observation o in time t can be state as following linear programming problems:
1 1 1 1 max s.t. , 1,..., , , 1,..., , 0, , 0, 1,..., ; 1,..., ; 1,.... . M S N t t j ij io i i j N t t j rj ro r r j j i r x x e i M y y e r S j N i M r S
(2.5)where λj is the intensity variable that serves to form a convex combination of observed inputs
and outputs. As shown in equation (2.5), the products βiei and γrer can be interpreted as the
input and output slacks, respectively. It is noteworthy that the true slacks are based on the constant return to scale assumption, indicating the efficient level of inputs and outputs for achieving the overall technical efficiency.
Although this advanced approach would easily obtain the actual slacks of each type of input and output variables, it has difficulty applying this generalized directional distance function to derive the Luenberger productivity index. Since the el has a value of one for
each input and output, implying that el plays the role of the units of data, βi (γr) would be the
number of units of each type of input (output) that can be contracted (expanded). Concerning the widespread variation of each input and output among regions, the Luenberger productivity index would present a meaningless and incomparable result if we directly use the „number‟ of slacks.
For dealing with the above-mentioned problem, the concept of TFEE, an optimal-to-actual ratio under total-factor framework, is applied in this thesis. Then we define Di t( )( ,x yt t) as the ratio of slack to original objective input, indicating the distance
from the frontier for efficient using at t. Accordingly, t t
TFEE is equal to (1-Di t( )( ,x yt t)) as
shown in the first line of equation (2.6). Other three distance functions can be substituted by TFEE in the same consideration. The computation of 1 1
( 1)( t , t )
i t
D x y is exactly like
linear programming problem when computing the two intertemporal directional distance function, i.e., 1 1
( )( t , t )
i t
D x y and Di t(1)( ,x yt t). It is because that the production possibilities
frontier constructed from observations in period t may not contain an observation from period
t + 1 (and vice versa). Therefore, we employ three-year windows data following the
approach of Färe et al. (2001) to calculate two intertemporal directional distance functions. Finally, the index of energy productivity change under total-factor framework, TIPI, will be completely constructed by equations (2.6) and (2.7).
( )
Target input under technology in
1 ( , ) Actual input in t t t i t t t TFEE D t x y 1 ( 1)
Target input under technology in +1
1 ( , ) Actual input in t t t i t t t TFEE D t x y 1 1 1 ( 1) 1
Target input under technology in +1
1 ( , ) Actual input in 1 t t t i t t t TFEE D t x y 1 1 ( ) 1
Target einput under technology in
1 ( , ). Actual input in 1 t t t i t t t TFEE D t x y (2.6) Therefore, (2.7) Note that if the value of TIPI is less than, equal to, or greater than zero, then it indicates total-factor energy productivity regress, no change, or progress from period t to t+1.
However, TIPI is only an aggregate index which might be oversimplified or over-aggregated. In other words, although TIPI computes the average of total-factor input productivity change, it does not indicate the sources of change directly. Thus, a more deeply
1 1 ( ) ( ) 1 1 ( 1) ( 1) 1 1 1 1 1 1 1 ( , ) ( , ) 2 ( , ) ( , ) 1 + . 2 t t t t i t i t i t t t t i t i t t t t t t t t t t t t t TIPI D D D D TFEE TFEETFEE TFEE TFEE TFEE
x y x y x y x y
study in the components of TIPI is necessary. According to Boussemart et al. (2003), TIPI can be decomposed into two components: total-factor energy efficiency change and total-factor energy technical change. The former component measured the change in relative energy efficiency and the later measured the shift in the technology of energy use. In equation (2.7), the first difference (outside the bracket) represents total-factor input efficiency changes and the second difference captures total-factor input technical changes.
Considering the example in Panel B of Figure 1 again, the total-factor energy productivity change by equation (2.7) from point A to point A‟ is equal to
C A A D A A A' A A' A' A A E E E 1 E E E . E E 2 E E E E (2.8)
Accordingly, the first difference shows a negative total-factor input efficiency change and the second difference presents a positive total-factor input technical change.
3. APPLICATION ON AN ENERGY ISSUE: AN EMPIRICAL STUDY OF CHINA
3.1 Application background
In the course of economic development, energy use provides the embodied and disembodied technical progress and productivity growth (Berndt, 1990; Narayan and Wong, 2009). In fact, several studies have found positive relationships between energy consumption and economic growth (Abosedra et al., 2009; Narayan et al., 2010). However, energy use is also a major source of greenhouse gas causing environmental problems (Herring, 1999; Miketa and Mulder, 2005; Jinke et al., 2008; Sari and Soytas, 2009). Under the concern of economic growth and environmental pressure, the study of energy use, such as energy efficiency, energy intensity, and energy productivity, has become a significant research issue over the past several decades.
The energy issue is more important in mainland China, as the economy has grown aggressively in the past two decades, and China is now the second largest energy-consuming economy in the world behind the United States. In 2004, China consumed primary energy over 59 quadrillion Btu, which accounted for 13.3% of the world (EIA, 2006). Moreover, Crompton and Wu (2005) forecast that the total energy consumption in mainland China shall increase at an annual growth rate of 3.8% from 2003 to 2010. Along with this progressive demand for energy, the assessment of energy use should be taken into consideration under China‟s energy policy. Due to the above concern, the Chinese government has been actively shifting its economic development mode and reforming the economic structure since China‟s Agenda 21 was adopted in 1993. The 10th Five-Year Plan carried out in 2001 also emphasizes improving energy efficiency and conservation. For example, energy consumption per 10,000 RMB yuan GDP in 1990 prices should be reduced to 2.2 tons of standard coal; energy conservation should be accumulated to 340 million tons of standard
coal; and the annual energy conservation ratio shall reach 4.5% by 2005. Whether or not these energy policies actually improve regional energy efficiency in mainland China remains to be examined by empirical research.
There are two well-known indicators used to study how energy inputs are efficiently used: One is energy intensity which measures the amount of energy consumption for every economic output produced in the economy, and the other is energy efficiency (or energy productivity) defined as economic output divided by energy input (Berndt, 1990; Patterson, 1996; Han et al., 2007; Nel and van Zyl, 2010). Notice that each represents identical measures from different perspectives, but we only focus on the application of the later (energy productivity) in this paper. The conventional energy efficiency index is actually the partial-factor energy productivity in which energy is the single input while substitution or complement among energy and other inputs (e.g., labor and capital stock) are neglected. Some researchers suggest that only using partial-factor energy productivity to evaluate energy consumption may obtain a plausible result (Han et al., 2007; Hu and Wang, 2006). For example, the energy efficiency index may increase solely when energy is substituted by labor, instead of any underlying improvement in technical energy efficiency (Patterson, 1996).
Hu and Wang (2006) propose a new indicator, so-called the total-factor energy efficiency (TFEE) index defined as a ratio of the optimal-to-actual energy input, in order to compute the relative energy efficiency of each region in mainland China under a multifactor framework. Meanwhile, they conclude that the commonly used energy efficiency index overestimates the benefit from energy consumption because of significant substitution effects among inputs. Wei et al. (2009) later extend the work of Hu and Wang (2006) to explain what factors cause the variation in the cross-regional TFEE. Moreover, Hu and Kao (2007) and Honma and Hu (2008) also apply the concept of TFEE to investigate related issues in APEC economies and Japan‟s regions, respectively. However, the methodology used by previous studies only
focuses on computing relative energy efficiency among objects in each year such that it lacks insights with longitudinal data. Therefore, an innovative method will be proposed in this article to deal with dynamic energy productivity changes.
The main purpose of this application is to evaluate the energy productivity change of regions in mainland China with a total-factor framework during 2000-2004. In order to study the energy productivity changes, this paper introduces a total-factor energy productivity index (TFEPI) which integrates the concept of the TFEE index with the Luenberger productivity index to measure the change of total-factor energy productivity. Note that the terms, energy efficiency and energy productivity, are used interchangeably in traditional literature, while they are clearly distinguished in this paper. The term energy productivity in this study is similar to the well-known definition as a ratio of the output (GDP) to energy inputs. Nevertheless, energy efficiency is defined as using less energy input to produce the same amount output under a production frontier representing the current technology to use energy.
Hence, this study applies a non-parametric programming method, commonly known as the data envelopment analysis (DEA) approach, to compute the total-factor energy productivity change. Additionally, TFEPI can be decomposed into two components: One is the change in relative energy efficiency, indicating that an object is getting closer to or farther from its annual frontier (catch-up effect or fall-behind effect). The other is shift in the technology level of energy use, showing the shift in the production frontier under the total-factor framework. The improvement of energy technology may be because of many aspects, such as changing energy mix, innovating and diffusing energy-saving technologies, and upgrading production process and equipments (Miketa and Mulder, 2005; Ni and Johansson, 2004).
sources and variables‟ descriptions. Section 3.3 presents and discusses empirical results in the case of mainland China. Finally, section 3.4 summaries this chapter.
3.2 Total-factor energy productivity index
The ratio of GDP to energy consumption is one of the most popular indicators to measure energy efficiency due mainly to its simplicity and intuitive (Ang, 2006). However, the TFEPI introduced in this study provides two advantages: first, traditional energy efficiency indicator only takes account of energy as single input. This indicator may easily overestimate the real change in energy productivity when energy is substituted for other inputs. Second, traditional indicator disregards the technology level of energy use. In other words, the traditional indicator assumes the technology is always consistent year after year. In fact, the productivity would improve because of technical progress (Coelli et al., 1998).
Therefore, this paper introduces a total-factor energy productivity index which applies a generalized directional distance function proposed by Färe and Grosskopf (2010) and an optimal-to-actual input ratio under total-factor framework (TFEE) to substitute all the components of Luenberger productivity index. Following the methodology in chapter 2, we denote DE t( )( ,x yt t) as the distance from the frontier for energy using at t, which can be also
interpreted as the ratio of the total slack to an energy input. Additionally, because the four components in equation (6) consist of two measurements within the same time period and two for intertemporal comparison, those four input-oriented distance functions would be replaced by the ratio of target energy input and actual energy input under technologies in different periods:
( )
Target energy input under technology in
1 ( , )
Actual energy input in
t t t E t t t TFEE D t x y
1
( 1)
Target energy input under technology in +1
1 ( , )
Actual energy input in
t t t E t t t TFEE D t x y 1 1 1 ( 1) 1
Target energy input under technology in +1
1 ( , )
Actual energy input in 1
t t t E t t t TFEE D t x y 1 1 ( ) 1
Target energy input under technology in
1 ( , ).
Actual energy input in 1
t t t E t t t TFEE D t x y (3.1) Therefore,
1 1 1 1 1 1 1 + . 2 t t t t t t t t t t t tTFEPI TFEE TFEE
TFEE TFEE TFEE TFEE
(3.2)
Note that if the value of TFEPI is less than, equal to, or greater than zero, then it indicates total-factor energy productivity regress, no change, or progress from period t to t+1.
3.3 Data and variables‟ descriptions
This study appends the panel dataset of Hu and Wang (2006) and analyzes 29 provincial level data from 2000 to 2004. According to the notion of Dan (2007) and National Western
Development Strategy, the 29 provinces are divided to three major areas: the east (the
provinces of Shandong, Hebei, Liaoning, Jiangsu, Zhejiang, Fujiang, Guandong, Guanxi, and Hainan, and the three municipalities of Beijing, Tianjing, and Shanghai), central (the provinces of Shanxi, Jilin, Heilongjiang, Anhui, Jiangxi, Henan, and Hunan), and west (the provinces of Inner Mongolia, Sichuan, Guizhou, Yunnan, Shaanxi, Ganxu, Qinghai, Ningxia, and Xinjiang). Since the capital stock data of Chongqing are hard to calculate, this municipality is combined with Sichuan province in this research. We also do not take account Tibet, because the energy input data of Tibet are not available for this research.
In our multiple inputs and outputs model, labor, capital stock, energy consumption, and total sown area of farm crops are the four inputs, while real GDP is the single output. Regional energy consumption data are collected from the China Energy Statistical Yearbook.
The energy datasets include the conventional energy consumption-mainly coal, petroleum, and natural gas. Data of GDP, labor employment, and total sown area of farm crops are all collected from the China Statistical Yearbook. This research uses the total sown area of farm crop data as a proxy of biomass energy, which is one of the main sources for non-commercial energy use in mainland China‟s rural area (Hu and Wang, 2006). However, data of regional capital stock are not available in any statistical yearbooks of China. Li (2003) uses capital formation to construct provincial capital stock datasets for the period 1984-1998. We extend capital stock data calculated by the authors according to the formula (Li, 2003):
Capital stock in the current year = Capital stock (previous year) + Capital formation (current year)
- Capital depreciation (current year). (3.3) All monetary inputs and outputs such as the GDP and capital stock are transformed into 2000 prices with GDP deflators.
The units of real GDP, labor, real capital, farm area, and energy consumption are billions of US$, millions of people, billions of US$, 1000 ha, and tons of standard coal equivalent (tce), respectively. Table 1 provides the descriptive statistics of inputs and output variables. The average real GDP of 29 regions in mainland China is 357.3 billion RMB and the standard deviation of GDP is 273.7 billion RMB. Among 29 regions in this research, Guangdong has the highest GDP output (1.03 trillion RMB), or about forty times that of Ningxia (29.0 billion RMB). This information reveals a great disparity of economic performance among the regions in mainland China. Other variables appear to have the same pattern with the GDP result. Table 3.1 also shows a correlation matrix, whereby all inputs have positive correlation coefficients with the output, implying that all inputs satisfy the isotonicity property with output for the DEA model.
Table 3.1
Summary statistics of input and output variables (2000-2004)
Variables Mean S. D. Correlation Matrix
Inputs Capital Stocks (1 billion RMB) 1,396.28 1,050.96 1.00 Labor (1 million persons) 22.27 15.47 0.50 1.00 Energy Consumption (tce) 6,204.17 3,841.46 0.79 0.69 1.00 Total sown area of farm
crops (1,000 ha)
5,320.23 3,624.06 0.27 0.85 0.57 1.00
Output
Gross Domestic Product (1 billion RMB)
357.28 273.74 0.86 0.71 0.83 0.48 1.00 Note: (1) All monetary units are at the 2000 price level. (2) tce : metric tons of standard coal
equivalent.
3.4 Results and discussion
3.4.1 Total-factor energy productivity change in mainland China
Table 3.2 presents total-factor energy productivity change for regions in mainland China during 2000-2004. China‟s average total-factor energy productivity change from the period 2000 to 2004 is negative (-0.014), implying that the total-factor energy productivity was decreasing by 1.4% annually since 2000, especially from the period 2001 to 2002 (-3.2%). However, the traditional energy productivity index reveals that China‟s energy productivity change was only decreasing 0.5% annually during the research period as calculated from
China Energy Statistical Yearbook. The comparative result shows that the traditional energy
productivity index might overestimate the energy productivity change if energy is taken as the single input. One possible explanation is that the substitution among inputs to produce the output is significant. For example, the partial labor productivity (GDP-to-labor ratio) in mainland China shows an increase of about 10% annually during 2000-2004. In addition, if
the same process is applied to compute the labor productivity under the total-factor framework, then the total-factor labor productivity improves 0.06% annually. Hence, the partial energy productivity would overestimate when other inputs become more productive and substitute energy input.
Table 3.2
Total-factor energy productivity changes by region
Region 01/00 02/01 03/02 04/03 Average Cumulative Beijing E 0.048 0.040 0.007 -0.029 0.016 0.066 Tianjin E 0.022 0.026 0.038 -0.028 0.014 0.057 Hebei E -0.002 -0.026 -0.026 0.000 -0.013 -0.053 Liaoning E 0.012 0.020 -0.007 -0.034 -0.002 -0.009 Shanghai E 0.000 -0.024 0.000 0.000 -0.006 -0.024 Jiangsu E 0.014 -0.008 0.000 0.000 0.001 0.006 Zhejiang E 0.072 -0.103 0.031 0.009 0.002 0.000 Fujian E 0.000 0.000 0.000 0.000 0.000 0.000 Shandong E 0.150 -0.240 -0.019 0.009 -0.025 -0.135 Guangdong E -0.020 0.000 -0.007 0.000 -0.007 -0.027 Guangxi E 0.030 -0.074 -0.046 -0.026 -0.029 -0.115 Hainan E -0.021 -0.075 -0.067 0.001 -0.041 -0.155 Shanxi C -0.030 -0.015 0.009 0.019 -0.004 -0.018 Jilin C 0.019 -0.046 -0.030 0.012 -0.011 -0.046 Heilongjiang C 0.035 0.032 -0.018 0.013 0.016 0.063 Anhui C -0.008 0.004 0.021 0.029 0.011 0.046 Jiangxi C 0.091 -0.124 -0.047 0.041 -0.010 -0.051 Henan C 0.005 -0.026 -0.046 -0.025 -0.023 -0.090 Hubei C 0.053 -0.054 -0.071 -0.043 -0.029 -0.115 Hunan C -0.107 -0.122 -0.234 -0.085 -0.137 -0.450 Inner Mongolia W -0.032 -0.012 -0.025 -0.034 -0.026 -0.099 Sichuan W -0.025 0.020 -0.070 -0.018 -0.024 -0.093 Guizhou W 0.001 0.011 -0.031 -0.005 -0.006 -0.024 Yunnan W 0.004 -0.071 -0.013 -0.015 -0.023 -0.092 Shaanxi W -0.066 -0.036 -0.001 -0.003 -0.026 -0.103 Gansu W 0.026 -0.016 -0.013 0.008 0.001 0.004 Qinghai W 0.006 0.008 0.003 -0.041 -0.006 -0.024 Ningxia W -0.003 -0.003 -0.055 -0.003 -0.016 -0.063 Xinjiang W -0.004 -0.011 -0.001 -0.024 -0.010 -0.039 Average 0.009 -0.032 -0.025 -0.009 -0.014 -0.056
In regards to the total-factor energy productivity change of regions level, seven of twenty-nine regions (Beijing, Tianjin, Jiangsu, Zhejiang, Heilongjiang, Anhui, and Qinghai) enhance their total-factor energy productivity. Beijing has the highest total-factor energy
productivity growth in mainland China, whereby its total-factor energy productivity cumulatively improves about 6.6% since 2000. Heilongjiang, with a 1.6% improvement annually in total-factor energy productivity, is the second best performer among twenty-nine regions. However, six regions see a sharp decline in their total-factor energy productivity of more than 10% since 2000: Shandong, Guangxi, Hainan, Hubei, Hunan, and Shaanxi. Among them, Hunan presents the worst performance by decreasing 13.7% annually on average during 2000-2004. In the first period (2000-2001), sixteen regions have positive total-factor energy productivity growth, especially for Shandong with a 15% improvement. However, the number of regions improving their total-factor energy productivity shows a significant decline in 2001-2003. Only eight and six regions increase their total-factor energy productivity in the second and third periods, respectively.
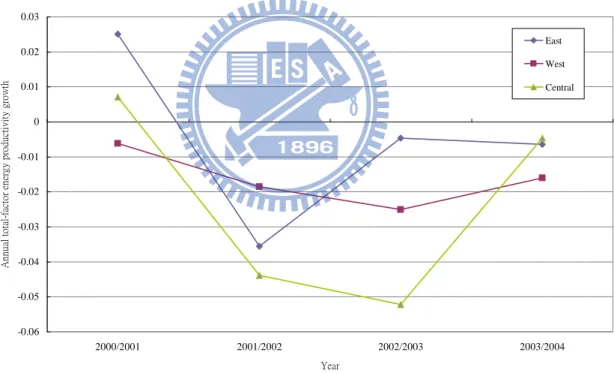
The TFEPI represents an arresting pattern among the three major areas in mainland China. Figure 3.1 shows the TFEPI of three areas in each period and Figure 3.2 shows the cumulative total-factor energy productivity change of three areas in each year. As Figure 3.1 shows, only the TFEPI of the east and central areas is positive in the first period, implying that all areas almost present negative growth of total-factor energy productivity in the research period. The east area is the best performer among the three areas, especially showing a increasing of the total-factor energy productivity (2.5%) in the first period. The highest TFEPI of the east area is 0.025 and the lowest is -0.036. The east area‟s average TFEPI is -0.005, illustrating that the total-factor energy productivity of the east area decreases by 0.5% annually during the period 2000-2004. However, the central area has the lowest average TFEPI at -0.023, although the TFEPI of central area improves 0.7% in 2001-2002. Moreover, the TFEPI of the west area reveals a similar pattern to the central area, presenting a deep drop in TFEPI from 2002 to 2003.
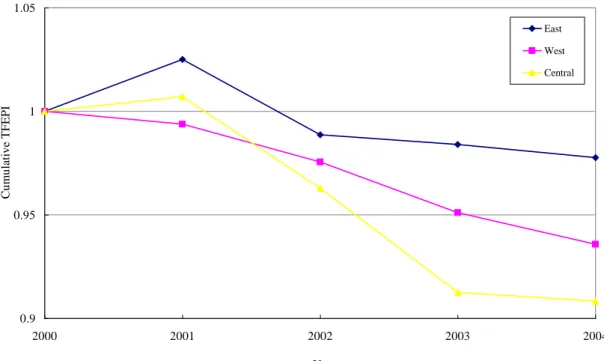
major areas (we assume initial total-factor energy productivity equals to unity in 2000). The result is consistent with Figure 3.1 that total-factor energy productivity of all areas provides a progressive decline trend during the research period. The east area‟s total-factor energy productivity slightly decreased about 2.2% since 2000, while the total-factor energy productivity of central and west areas dramatically decreased over 9.1% and 6.4%, respectively. It is noteworthy that the east area has the highest level of per capita income and the highest level of energy productivity growth. As opposed to the east area, the west has the lowest level of per capita income and energy productivity growth. The results do not represent the convergence of energy productivity in mainland China, suggesting that areas with relatively low economic growth cannot catch up to advanced areas.
-0.06 -0.05 -0.04 -0.03 -0.02 -0.01 0 0.01 0.02 0.03 2000/2001 2001/2002 2002/2003 2003/2004 Year A nn ua l to ta l-fa ct or e ne rg y pr od uc ti vi ty g ro w th East West Central
0.9 0.95 1 1.05 2000 2001 2002 2003 2004 Year Cu m u la ti v e T F E P I East West Central
Figure 3.2 Cumulated total-factor energy productivity change among three major areas
These TFEPI results for regions and areas in mainland China are consistent with the arguments of Lin (1998) who finds different local emphases in implementing energy policy for Agenda 21. For instance, the richer coastal regions emphasize reforming traditional production and consumption patterns and adopting environmental friendly energy technologies, while the poorer inland regions emphasize efficient use and conservation of energy (Lin, 1998).
3.4.2 Components of total-factor energy productivity growth
In order to examine what happens to the total-factor productivity of regions in mainland China, we first decompose the TFEPI into its two components – total-factor energy efficiency change and technical change by equation (2.7). Total-factor energy efficiency (TFEE) change indicates the change of relative efficiency for consuming the energy input among 29 regions. Table 3.3 lists the calculation results of total-factor energy efficiency change. The results of Table 3.3 show that the whole country‟s average total-factor energy efficiency
change is 0.006 during 2000-2004. This reveals that the total-factor energy efficiency of China improves about 0.6% per year and presents a slight catch-up effect such that the gap between all regions in mainland China has progressively diminished since 2000. However, there is a downward plunge of total-factor energy efficiency during the period 2001-2003. The yearly total-factor energy efficiency change is about -0.6% in the period 2001-2002.
Table 3.3 also presents the results of total-factor energy efficiency change for regions level. The total-factor energy efficiency changes in three regions (Shanghai, Fujian, and Guangdong) are equal to zero in each period, meaning that these regions‟ capacities for using energy to generate economic output are the best performer all the time. Stated another way, these regions still perform on the production frontier throughout the periods. However, the catch-up effect does not exist for all regions. Over half of 29 regions possess relative energy efficiency improvement - that is, their energy consumption efficiency catches up to the production frontier. The total-factor energy efficiency of Beijing, Tianjin, Heilongjiang, and Anhui rapidly increases to more than 3% annually on average, especially that of Heilongjiang (3.9%). There are also two regions (i.e., Inner Mongolia, Hunan) confronting a marked efficiency decline with over 1% annual change, especially for Hunan (-6.3%). It is worth noting that the above results only focus on the change of TFEE. We simultaneously consider the regions‟ TFEE and TFEE change for further analysis. For example, in 2004, although Heilongjiang has the fastest growth rate of TFEE, its TFEE score (0.674) is lower than the score of Hunan (0.746) whose growth rate is the worst among 29 regions. Additionally, there are four regions (i.e., Guizhou, Gansu, Qinghai, and Xinjiang) in the west area that improved their TFEE, but the TFEE of all of them are still below the country‟s average TFEE in 2004. This indicates that some regions try to catch up to the frontier, while the inequality of total-factor energy efficiency exists in mainland China.
Table 3.3
Annual total-factor energy efficiency changes by region
Region 01/00 02/01 03/02 04/03 Average Beijing E 0.062 0.067 0.022 -0.026 0.031 Tianjin E 0.037 0.054 0.056 -0.022 0.031 Hebei E 0.010 -0.003 -0.004 0.021 0.006 Liaoning E 0.022 0.042 0.016 -0.014 0.016 Shanghai E 0.000 0.000 0.000 0.000 0.000 Jiangsu E 0.025 0.000 0.000 0.000 0.006 Zhejiang E 0.092 -0.070 0.050 0.022 0.024 Fujian E 0.000 0.000 0.000 0.000 0.000 Shandong E 0.171 -0.209 0.013 0.039 0.003 Guangdong E 0.000 0.000 0.000 0.000 0.000 Guangxi E 0.048 -0.040 -0.013 0.003 -0.001 Hainan E 0.000 -0.031 -0.025 0.039 -0.004 Shanxi C -0.025 -0.005 0.019 0.029 0.004 Jilin C 0.030 -0.025 -0.010 0.032 0.007 Heilongjiang C 0.048 0.060 0.011 0.039 0.039 Anhui C 0.006 0.033 0.052 0.059 0.037 Jiangxi C 0.111 -0.087 -0.012 0.075 0.022 Henan C 0.020 0.003 -0.018 0.000 0.001 Hubei C 0.070 -0.022 -0.041 -0.018 -0.003 Hunan C 0.000 0.000 -0.198 -0.056 -0.063 Inner Mongolia W -0.023 0.004 -0.009 -0.021 -0.012 Sichuan W -0.012 0.049 -0.043 0.005 0.000 Guizhou W 0.007 0.022 -0.020 0.005 0.003 Yunnan W 0.017 -0.047 0.011 0.006 -0.003 Shaanxi W -0.053 -0.012 0.024 0.020 -0.006 Gansu W 0.034 0.000 0.003 0.023 0.015 Qinghai W 0.014 0.023 0.019 -0.028 0.007 Ningxia W 0.002 0.008 -0.046 0.004 -0.008 Xinjiang W 0.005 0.008 0.018 -0.007 0.006 Average 0.025 -0.006 -0.004 0.008 0.006
The second component of TFEPI is total-factor energy technical change, representing the shift in the technology of energy use during one period. As shown in Table 3.4, the whole country‟s average total-factor energy technical change is -0.020, indicating that the technology of using energy in mainland China regresses significantly by 2.0% per year during the research period 2000-2004. A possible reason for the result may be the proportion of low-efficiency source of energy (such as coal) continues to increase in mainland China during
the 2000-2004 periods (Ni and Johansson, 2004). None of the four yearly periods shows a positive technical growth, while a rapid drop occurs in 2001-2002 of up to -2.6%. Considering Tables 3.2, 3.3, and 3.4, we derive a conclusion: The total-factor energy productivity of China has dropped 5.6%, decreasing by 1.4% annually on average since 2000. However, this energy productivity decline is mainly attributable to negative technical growth and not relative efficiency change.
Table 3.4
Annual total-factor energy technical changes by region
Region 00/01 01/02 02/03 03/04 Average Beijing E -0.014 -0.027 -0.015 -0.003 -0.015 Tianjin E -0.015 -0.029 -0.018 -0.007 -0.017 Hebei E -0.012 -0.023 -0.023 -0.020 -0.019 Liaoning E -0.010 -0.021 -0.023 -0.019 -0.018 Shanghai E 0.000 -0.024 0.000 0.000 -0.006 Jiangsu E -0.011 -0.008 0.000 0.000 -0.005 Zhejiang E -0.020 -0.033 -0.019 -0.014 -0.022 Fujian E 0.000 0.000 0.000 0.000 0.000 Shandong E -0.021 -0.031 -0.032 -0.029 -0.028 Guangdong E -0.020 0.000 -0.007 0.000 -0.007 Guangxi E -0.018 -0.034 -0.033 -0.029 -0.029 Hainan E -0.021 -0.044 -0.042 -0.038 -0.036 Shanxi C -0.005 -0.009 -0.010 -0.010 -0.009 Jilin C -0.012 -0.022 -0.021 -0.019 -0.018 Heilongjiang C -0.013 -0.028 -0.028 -0.026 -0.024 Anhui C -0.014 -0.029 -0.031 -0.029 -0.026 Jiangxi C -0.020 -0.036 -0.035 -0.034 -0.031 Henan C -0.015 -0.030 -0.029 -0.025 -0.024 Hubei C -0.017 -0.032 -0.030 -0.025 -0.026 Hunan C -0.107 -0.122 -0.036 -0.029 -0.074 Inner Mongolia W -0.008 -0.017 -0.016 -0.013 -0.013 Sichuan W -0.014 -0.029 -0.027 -0.024 -0.023 Guizhou W -0.005 -0.012 -0.011 -0.009 -0.009 Yunnan W -0.013 -0.023 -0.024 -0.021 -0.020 Shaanxi W -0.012 -0.024 -0.025 -0.022 -0.021 Gansu W -0.008 -0.016 -0.016 -0.015 -0.014 Qinghai W -0.007 -0.015 -0.016 -0.013 -0.013 Ningxia W -0.005 -0.010 -0.008 -0.007 -0.008 Xinjiang W -0.009 -0.019 -0.019 -0.016 -0.016 Average -0.015 -0.026 -0.020 -0.017 -0.020
Table 3.4 also reports regional total-factor energy technical change in each period. Accordingly, only one region (Fujian) has a non-negative total-factor energy technical change over the entire period, showing that the total-factor energy technical change of Fujian is unchanged during the period 2000-2003. This also illustrates no shift in the frontier of energy usage technology in mainland China over the research periods. Conversely, the total-factor energy technical changes of Hainan, Jiangxi, and Hunan decrease most rapidly to more than 3% annually. Moreover, Heilongjiang, one of China‟s old industrial bases, has an average total-factor energy technical change with -2.4%. The total-factor energy technical change of the other two old industrial base regions, Liaoning and Jilin, are -1.8% and -1.8% annually on average, respectively. It reveals that the major problem of China‟s old industrial bases is technology regression and not being under efficient energy usage.
3.4.3 Determinants of TFEPI
As mentioned above, the total-factor energy productivity of China presents a negative growth trend in which only seven regions enhance their total-factor energy productivity among twenty-nine regions in the period 2000-2004. Therefore, three sets of factors affecting the regional TFEPI scores are explored: The first set contains state variables, including area, the ratio of FDI to GDP, human capital, and GDP per capita. Yang (2002) considers that China‟s regional development strategies since the reforms directly drive the widening spatial development gap. The east area consisting of coastal regions and special economic zones has received preferential resource allocations and attracted foreign direct investment since early 1980. This region-biased policy may cause technology, skilled labor, and investment inequality among the regions. FDI is a possible factor affecting regional energy productivity growth. Fisher-Vanden et al. (2006) consider that technological innovation can be imported from abroad, especially for developing country such as mainland
China. The energy productivity may increase due to the human capital accumulation which helps input more skilled labor into the production process. Here the ratio of annual university graduates to population is used as an index of human capital, according to Fleisher and Chen (1997). GDP per capita would measure the region‟s development status. This factor can also analyze cross-region convergence of total-factor energy productivity and examine whether the advantage of backwardness exists.
The second set is region‟s industry structural change. Wei et al. (2007) and Fisher-Vanden et al. (2004) mention that industry structural change can cause a great influence on energy efficiency. For example, a shift from an energy-intensive sector, such as a secondary industry to a tertiary industry, increases energy efficiency. We adopt the proportion change of GDP contributed by primary, secondary, and tertiary industries to characterize a region‟s industry structure.
The third set is the change in energy mix. Miketa and Mulder (2005) point out that the change in energy mix is an important source of energy productivity growth. Moreover, natural gas and electricity are more efficient and energy-saving sources than coal and oil. Hence, the change in share of coal, oil, natural gas, and electricity is used to characterize a region‟s energy mix.
In this analysis, pooled OLS and random-effects regression is used to estimate the determinants of TFEPI in Model 1 and Model 2, respectively. As the note of Table 3.5 explains, the F, LM, and Hausman tests reveal that the random-effects regression is more appropriate for the comprehensive model (Model 2).2 Table 3.5 offers the estimation results. According to the results of regression, this paper has the following findings: First, the east area has a better TFEPI and the west area has a significantly lower TFEPI. Second, regions with a higher previous GDP per capita that represent that higher development have better
TFEPI performances. These two findings indicate that the total-factor energy productivity among regions in mainland China is diverse from 2000 to 2004. Third, FDI ratio and human capital reveal slight positive effects on energy productivity growth as they are solely considered, while the effects disappear if these factors are taken with others in Model 2. It indicates that FDI investment and human capital do not have directly effect on energy productivity growth. Four, the result also shows that increasing the proportion of GDP generated by the secondary industry deteriorates the total-factor energy productivity of the region. Finally, the result shows that the energy mix has significant effect on TFEPI, which is similar to the work of Miketa and Mulder (2005). Actually, the total-factor energy productivity would increase substantially as raising the share of electricity use. It is concluded that advancing the technology of energy consumption and adjusting industry structure and energy mix are vital matters for the regions in mainland China to raise their energy productivity.
3.5 Summary
Conventional energy indices, such as energy efficiency and energy intensity, can be used to evaluate how energy inputs are efficiently utilized. However, these indicators neglect the substitution among energy consumption and other factors so that the results obtained from conventional energy indicators overestimate or underestimate the actual state. This paper proposes the total-factor energy productivity index (TFEPI) to assess energy productivity growth for regions in mainland China. TFEPI constructs a multiple-input framework that avoids single-input bias since energy is not the only input to produce economic output. The DEA approach based on the Luenberger index and relative TFEE is applied to conduct a total-factor energy productivity index in this study. The TFEPI proposed in this paper is a dynamic indictor to measure the total-factor energy productivity growth by getting rid of the