Paper I
Fault activity and lateral extrusion inferred from velocity field revealed
by GPS measurements in the
Pingtung area of southwestern Taiwan
Jyr-Ching Hua, Chin-Shyong Houab, Li-Chung Shena, Yu-Chang Chanc, Rou-Fei Chend, Chung Huanga, Ruey-Juin Raue, Chii-Wen Linb, Mong-Han Huanga, Pei-Fen Niena, Jacques Angelierdf
Corresponding author: Jyr-Ching HU
Address: Department of Geosciences, National Taiwan University, No. 1,
Sec. 4, Roosevelt Road, Taipei 106, Taiwan
E-mail: [email protected]
Tel: +886-2-23634860
Fax: +886-2-23636095
Fault activity and lateral extrusion inferred from velocity field revealed
by GPS measurements in the
Pingtung area of southwestern Taiwan
Jyr-Ching Hua, Chin-Shyong Houab, Li-Chung Shena, Yu-Chang Chanc, Rou-Fei Chend, Chung Huanga, Ruey-Juin Raue, Chii-Wen Linb, Mong-Han Huanga, Pei-Fen Niena, Jacques Angelierdf
a
Department of Geosciences, National Taiwan University, Taipei, Taiwan
b
Central Geological Survey, MOEA, PO Box 968, Taipei, Taiwan
c
Institute of Earth Sciences, Academia Sinica, Nankang, Taiwan
d
Observatoire Océanologique de Villefranche-sur-mer, Université P. & M. Curie, Villefranche-sur-Mer, France
e
Department of Earth Sciences, National Cheng Kung University, Tainan, Taiwan
f
Abstract
Four campaigns of GPS measurements have been conducted by the Central Geological Survey since 1995 to investigate the fault surface activity and crustal deformation patterns in southwestern Taiwan. GPS surveys provide the velocity field of the Pingtung-Kaohsiung area in SW Taiwan, in the transition zone from collision to subduction. Station velocities decrease from 42.2 mm/yr in the west to 55.5 mm/yr in the east along azimuths from 247o to 273o. In the central and western study area, GPS stations move nearly toward the west. In the Pingtung-Kaohsiung coastal area, the velocity vectors show a counter-clockwise deviation toward the SW, which we explain in terms of lateral extrusion. The transtensional deformation and along-strike southward increase in extensional deformation in southwest Taiwan result from low lateral confining conditions related to the Manila subduction zone as a free boundary or/and the presence of the Peikang High indenter. The GPS vectors indicate that the Chishan Fault is dominated by right-lateral motion with a surface fault slip rate of ~7 mm/yr in a N50oW direction. The Kaoping Fault bounded in the west side of Pingtung plain is dominated by left-lateral motion with a surface fault slip rate of ~4-8 mm/yr in a N-S direction. The significant right-lateral component of motion of ~24-30 mm/yr can be accommodated along the active structures west of the Chishan Fault, between the coast and the deformation front. The right-lateral and left-lateral structures facilitate the southwestward extrusion. The major Chaochou Fault is a high-angle reverse fault with left-lateral movement. Based on our GPS study, the velocity gradients across this fault are not significant, suggesting that the Chaochou Fault is locked near the surface.
1. Introduction
Space geodetic techniques, especially the Global Position System (GPS), have become a powerful tool for high accuracy geodetic monitoring of a wide range of geophysical phenomena including plate motion and crustal deformation at plate boundaries (Dixon, 1991; Segall and Davis, 1997). To quantify the kinematics of deformation along the convergent plate boundary of Taiwan, the "Taiwan GPS Network" was established in 1990 with dual-frequency geodetic receivers (Yu et al., 1997; Yu and Kuo, 2001; Hickman et al., 2002). These data provided the amplitude and orientation of tectonic motion across the plate boundary of Taiwan, and hence direct constraints on geodynamics. Some limitations in the direct interpretation of such studies were later highlighted by the co-seismic deformation of the Chichi earthquake. This major earthquake clearly revealed that the inter-seismic deformation documented by the brevity of GPS surveys did not provide a complete picture of the deformation across the collision belt. The long-term deformation pattern includes a major co-seismic component of deformation, which dominates near the front of the belt and highlights a double plate boundary structure (Angelier et al., 2001). A further limitation of the initial Taiwan GPS Network involved sparse coverage of GPS stations in some areas that did not permit detailed reconstruction of the deformation. This was the case in the Pingtung plain, although GPS data suggested a different present-day deformation pattern, as compared with northern regions close to the front of the belt. To better reconstruct the ongoing deformation, a dense network was established in 1996 in the Kaohsiung and Pingtung areas. It thus became possible to monitor the crustal deformation along and around major crustal structures such as the Chaochou Fault and the Chishan Fault (Fig. 1).
continental margin of Eurasian plate began ca. 5 Ma (e.g., Chai, 1972; Suppe 1984; Angelier, 1986; Ho, 1986; Teng, 1990, 1996). This collision belt connects the Ryukyu subduction zone, where the Philippine Sea plate is subducting beneath the Eurasian plate, and the Manila subduction zone, where the Philippine sea plate is overriding the crust of South China Sea (Fig. 1). The GPS measurements and the NUVEL-1 and -1A models of global plate motion predict motion of the Philippine Sea plate toward the northwest (~305o-310o), at a rate of 70-82 mm/yr relative to the Eurasia plate, in good directional agreement with, but at a greater velocity than the previous estimates (Seno et al., 1993; Yu et al., 1997, 1999; Zang et al., 2002). Based on geological and seismological evidence, the NNE trending Longitudinal Valley Fault is considered to be the major suture zone between the two plates (Ho, 1986; Tsai, 1986). However, field measurements of the fault displacement suggested, and consideration of major thrust events to the west confirmed, that it accommodates no more than 25-30% of the total convergence across the Taiwan collision belt (Angelier et al., 2000 and 2001). Furthermore, the trend of the relative plate-motion vector undergoes a 15o-20o clockwise deviation as compared with the direction perpendicular to the structural grain of the orogenic belt, indicating a significant left-lateral component of motion. In response to this obliquity, the orogenic belt propagates southward at a rate of ~55 km/my (Suppe, 1981; Byrne and Crespi, 1997). The collision is no longer active in northernmost Taiwan and the transtensional tectonic regime prevails due to different mechanical processes (Hu et al., 1996, 2002; Teng, 1996, 2000). The orogenic belt of central-southern Taiwan is undergoing strong crustal deformation (Yu and Chen, 1994; Yu et al. 1997), rapid uplift (Liew et al. 1990; Liu and Yu, 1990; Wang and Burnett
1990; Pirazzoli et al., 1993; Chen and Liu, 2000; Vita-Finzi, 2000; Liu et al., 2001) and high denudation and erosion rate (Li, 1976; Hovius et al., 2000; Dadson et al., 2003) in a typical compressional regime. In this paper, we discuss the tectonic
behavior near the southern tip of the Taiwan belt, close to the transition zone between the mountain ranges of the collision zone and the submarine accretionary prism of the northern Manila subduction zone.
The theory of lateral extrusion along a collision zone has been repeatedly documented over the last two decades (Molnar and Tapponnier, 1978; Tapponnier et al., 1983; Ratschbacher and Merle, 1991). The basic concept of tectonic extrusion refers to the lateral motion of a structural unit that moves toward a free boundary in response to collision shortening. Its application to SW Taiwan deserves discussion because it is usually considered over larger areas and generally occurs at crustal-lithospheric scales along major transcurrent faults. Southwestern Taiwan is a region where lateral extrusion is expected because it is the transition zone between the collision belt and the offshore Manila subduction zone. In more detail, this lateral extrusion is also related to both the collisional shortening and the indentation of the Peikang basement high (Fig. 1). Sandbox modeling supports the interpretation of southwestern Taiwan undergoing tectonic extrusion toward the SW (Lu and Malavielle, 1994; Lu et al., 1998). The relationship between the kinematic evolution of the fold-and-thrust units of the southwestern Foothills and the offshore accretionary prism is a key topic for understanding the crustal deformation and mechanical behavior of this transition zone. The aim of this study is to examine this lateral extrusion hypothesis and the fault activity of the Pingtung area in SW Taiwan, primarily based on the results of new dense GPS network data gathered from 1996 to 1999.
2. Tectonic and geological background of Pingtung area
subduction and corresponds to the southern part of the Plio-Pleistocene foreland basin that formed in response to lithospheric flexure due primarily to the tectonic loading of the Central Range (Lin and Watts, 2002). The western foothills of Taiwan are composed of a series of imbricate folds and thrust sheets affected by basement-involved tectonics (Mouthereau et al., 2002). The Pingtung plain, which covers an area of 1,210 km2, exhibits a rectangular shape when mapped and viewed in cross section display fills of unconsolidated sediments of the late Pleistocene and the Holocene. Most of these sediments consist of coastal to estuarine sand and mud, with abundant shallow marine to lagoonal shells and foraminifers (Shyu, 1999). The Pingtung plain is bounded by low hills of deformed Quaternary sediments to the north and the west. To the east, the Pingtung plain is bounded by metamorphosed Tertiary rocks of the Central Mountain Range. Based on a recent neotectonic map (Shuy et al., 2001), the Pingtung plain comprises the major element of a proposed “Kaoping domain” located between the outer-arc ridge sediments of the Central Range and the continental shelf deposits of the Western Foothills. The present-day Pingtung Plain corresponds to the forearc domain between the trench to the west and the forearc ridge to the east. This more-than-100-km-wide domain has undergone major shortening and thus transformed into a fold-and-trust belt of the Western Foothills of Taiwan. To the south, anticlinal ridges and minor thrust faults on the seafloor indicate the initial shortening of this forearc space (Liu et al., 1997; Lundberg et al., 1997; Lacombe et al., 1999).
Active neotectonics has been investigated by morphological data in southwestern Taiwan (Bonilla, 1975, 1977; Hsu and Chang, 1979; Shuy et al., 2001). The most significant geomorphological feature of the Pingtung plain is the straight, N-S trending escarpment of the Chaochou Fault (CCF in Fig. 2) separating the alluvium plain and the high mountains. East of the Chaochou Fault, the mountains are mainly
composed of Eocene-Miocene argillite, slate and meta-sandstone. The contrast between rock ages and the difference in elevation between the two sides of the Chaochou Fault highlights a major vertical relative displacement. The remarkable straight shape of this fault line in the geological maps may suggest the existence of a significant component of strike-slip motion. Thus, the Chaochou Fault is considered as a probable oblique-slip fault zone that steeply dips to the east. Despite a lower contrast in elevation, an other fault escarpment, that of the Kaoping Fault (KPF in Fig. 2), bounds hills made of clastic sediments west of the Pingtung Plain.
Recent studies have shown that the Chaochou Fault and adjacent areas actually experienced transtensional tectonic movements (Chan et al., 2000). Based on tectonic analysis of outcrop-scale faults, a predominant transtensional tectonic regime with NNE to NE extension and ESE to SE compression was reconstructed on the eastern side of the Chaochou Fault (Chan et al., 2000). The transition from transpression to recent transtension was also highlighted along the Chaochou Fault and is probably related to the transition from collision to subduction, which highlights the active extrusion of the study area towards the southeast. Within this geological framework, our geodetic (GPS) analysis aimed at a better characterization of the present-day deformation in the area.
3. The Pingtung GPS Network
The ‘Pingtung GPS Network’ was established in 1995 by the Central Geological Survey, Ministry of Economic Affairs, to analyze present-day crustal deformation and land subsidence in the Pingtung area (Fig. 3). It is composed of 48 annually surveyed stations and one permanent, continuously monitoring station (S23R), covering the Pingtung and Kaohsiung area. Before presenting the results of GPS surveys and the
interpretation of motion vector pattern, it is worth noting that by definition geodetic techniques reveal surface displacements, which do not reflect the displacements at depth in a simple manner (this is the case for faults locked near the surface and creeping at depth).
During the period from August 1995 to August 1999, the mobile stations of the network were surveyed 3-4 times with dual frequency geodetic GPS receivers. The changes in baseline components derived from these repeated and continuous GPS measurements provided accurate estimates of the relative velocities of GPS stations in study area. In each survey, 4-8 stations were observed simultaneously with dual-frequency geodetic receivers (Trimble 4000 SSE Geodetic Surveyor). A station was usually occupied during more than two sessions, each session being composed of 6-14 hours of GPS observations to all available satellites rising higher than a 15° angle of elevation. The sampling interval was 15 seconds. Daily solutions were computed for continuous GPS data. The ionosphere-free linear combination of observations at the L1 and L2 frequencies were employed as the basic observation for estimating the station coordinates and baseline solutions. We have processed the observed data with the final ephemerides distributed by the IGS.
All available temporary measurements and continuous recordings of GPS data were processed with the Bernese GPS software (v.4.2) developed at the Astronomical Institute of the University of Berne (Hugentobler et al., 2001). The observed data in each epoch survey were processed session by session to obtain the baseline solutions for all combinations of any two stations in the same session. The scatter of series of GPS measurements taken over several years can be employed as an indicator of precision. This long-term repeatability shows the effects of slowly varying systematic errors due to propagation delay, multipath, or fiducial network inconsistencies. The repeatability of a baseline component (east, north, and vertical) or baseline length is
given by the root-mean-square scatter about the linear trend. The baselines range from 3 to 21 km in length, with the majority shorter than 10 km.
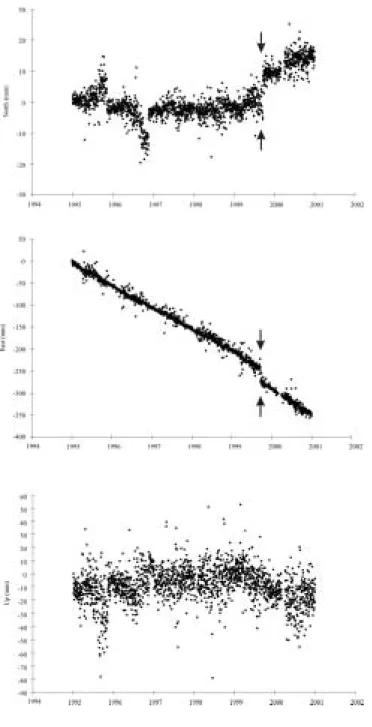
The average rates of length change on each baseline between nearby stations, which are usually observed in the same session, were determined by linear regression in time. Considering this and the relative geological stability of the Penghu area, the coordinates of Paisha station (S01R) and the azimuth from Paisha to Taipei (N52.1°E) were fixed in the least-square adjustment to estimate the station velocities. The data have been processed in each epoch holding this remote site and azimuth fixed. This procedure was compulsory for resolving the translational and rotational ambiguities of the whole network in the estimation that follows. The individual values of the average length rate from the 548 baselines in the Taiwan GPS Network were weighted by the reciprocal square of the standard error in the rate. These weighted rates were then used in a least squares adjustment to estimate the station velocities relative to the fixed station S01R. An example of data used to determine the linear regression velocity fits is shown in Figure 4.
4. Kinematics of lateral extrusion and fault activity inferred from GPS data
4.1. Kinematic and deformation patterns indicate extrusion
Our GPS surveys provide a compressive velocity field of SW Taiwan. In our maps, this velocity field is shown relative to the Paisha station of the Penghu islands, which is considered as the stable continental shelf (with additional consideration of a fixed direction Paisha-Taipei). Horizontal GPS velocities in the investigated area are listed in Table 1. The station velocities are 42.2 mm/yr to 55.5 mm/yr along the azimuths from 244.7o to 272.5o. The horizonta
l
GPS velocity vectors are shown inFigure 3, with respect to the local frame of a permanent station (S01R) located in the stable continental shelf. The horizontal velocities generally decrease westward and increase southward. Regarding the vertical velocity field, it has been analysed in detail in the Pingtung Plain and is not described again in the present paper (Hu et al., 2004). Although GPS uncertainties were larger than for the horizontal displacement, this analysis clearly revealed uplift to the North and subsidence to the South, with a gradually increasing downward component from North to South.
At first sight, the velocity pattern appears regular and consistent with small circles around a common pole located near 21°50’N-120°36’E (Fig. 3b). Despite this directional consistency, the present-day displacement of this region cannot be interpreted in terms of rigid rotation. This impossibility is illustrated by the comparison between expected and observed velocities along different circles. Assuming rigid rotation, the velocity found at the northern stations of the Pingtung Plain should be twice as large as in the southern stations. This contradicts the southward increase in velocity noted above. The displacement pattern is more complex than rigid rotations and rather resembles a flow of particles towards an open edge (in this case the area offshore in southwestern Taiwan) with increasing velocity towards the weakest domain. In terms of velocity vector trends, there is a striking contrast in kinematics between two sub-areas. In the central and western part of the study area, GPS stations are generally moving toward the west, whereas in the Kaohsiung and Pingtung coastal area the displacement vectors of four stations (FONS, G011, G030 and G014) reveal a counterclockwise deviation toward the SW. The GPS results obtained from 1990 to 1995 at stations I045, S010 and LIUC (Yu et al., 1997) are consistent with the kinematic pattern reconstructed herein.
The deformation of the area under investigation can be reconstructed without any need for a reference position (like the Paisha Penghu Island as indicated above), by
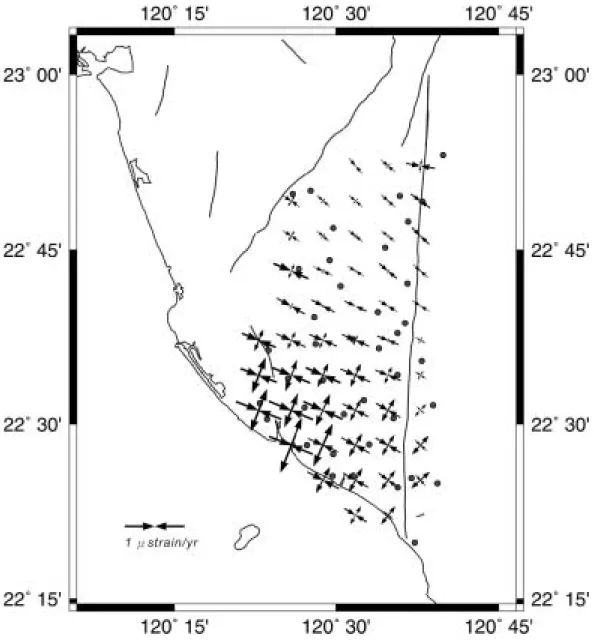
simply examining the velocity field gradients. An efficient way to reconstruct both the amplitudes and orientations of these gradients consists of calculating tensors of deformation within a grid (Fig. 5). This grid was obtained through a simple interpolation process using the horizontal velocities determined from the GPS analysis. The calculated tensors reveal a shortening in one direction and a lengthening in the perpendicular direction, with generally similar absolute values. In other words, the overall deformation is essentially strike-slip in type, instead of revealing pure compression or extension. In detail, however, compression prevails to the North (where many tensors are close to pure compression) and extension dominates in the southern Pingtung Plain (because lengthening is larger than shortening). The deformation pattern thus reconstructed illustrates both the belt-perpendicular shortening and the belt-parallel extension. In the whole Pingtung Plain, the axes of the maximum shortening trend WNW-ESE on average and its amplitudes progressively increase from NNE to SSW. The axes of maximum lengthening trend NNE-SSW and show a spectacular increase towards the SSW, especially in the coastal area of the Pingtung Plain. The rigid rotation hypothesis having been ruled out (previous paragraph), the pattern of velocity vectors shown in Figure 3 can be interpreted in terms of elastic deformation or extrusion and escape. The distribution of the resulting deformation reconstructed in Figure 5 clearly favors the latter interpretation.
The numerical distinct-element models proposed by Hu et al. (1997, 2001) require three special conditions to account for the kinematics of anticlockwise rotation of velocity field in SW Taiwan: (1) the major faults and deformation front behaving as weak discontinuities; (2) the presence of the prominent Peikang High acting as a rigid indentor of the Chinese passive margin and (3) the presence of an offshore zone of mechanical weakness including the Manila trench and the related accretionary prism.
4.2. The behavior of the Chaochou Fault
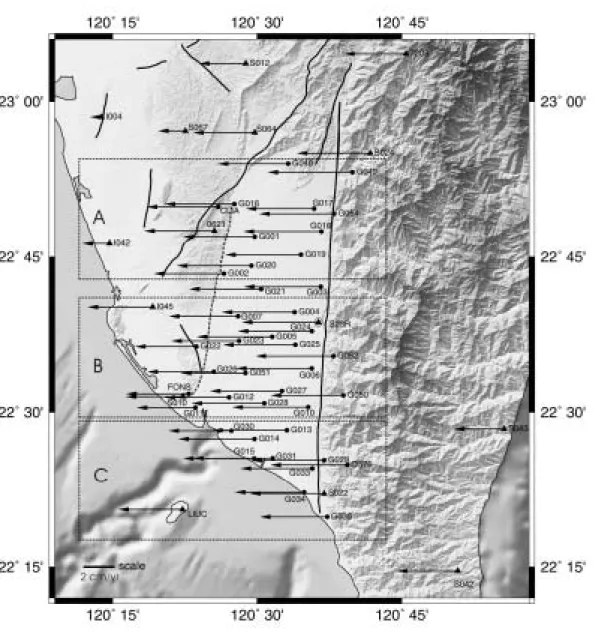
In order to investigate the activity of the Chaochou fault zone that trends N-S, we thus use both the E-W and N-S GPS components to characterize the fault-normal and fault-parallel kinematics, respectively. The results of this analysis are summarized in Figures 6, 7, and 8. As Figure 6 shows, the E-W components of station velocities relative to the stable shelf of the Taiwan Strait vary from -38.1±1.7 mm/yr to -55.1±1.8 mm/yr (the negative sign indicates westward motion). The absolute values of station velocities gradually decrease from east to west, as the profiles of Figure 7 show. Most especially, there is no obvious contrast in velocity across the Chaochou Fault. As mentioned above, the Chaochou Fault is the major fault in the studied area and is considered to be a steeply dipping reverse fault with a significant left-lateral movement.
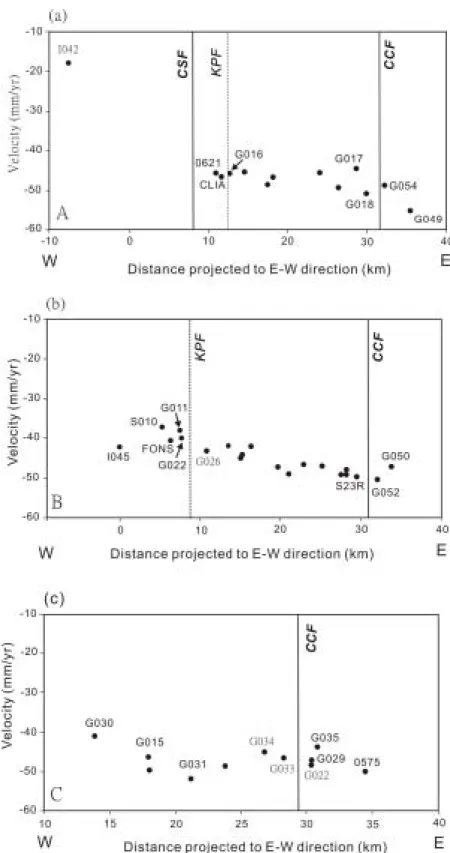
We divided the whole study region into three subdomains (northern, central and southern) shown as rectangular frames A, B and C in Figure 6. Our results indicate that the E-W velocity gradient of the GPS stations across the Chaochou Fault observed in three subdomains is not significant (Figs. 6 and 7). This result shows that the transverse component of surface motion across the Chaochou Fault, which was expected to be extensional according to geological analysis of fault zone evolution, is minor at present day. One should note, however, that our results reflect the deformation of the inter-seismic stage; because the possibility of major co-seismic motion of the Chaochou Fault is left open, these results should not be extrapolated to the long-term deformation. This shows that there is no shallow slip (< 5 km). But there would be deeper sip on the fault that produces longer wavelength deformation.
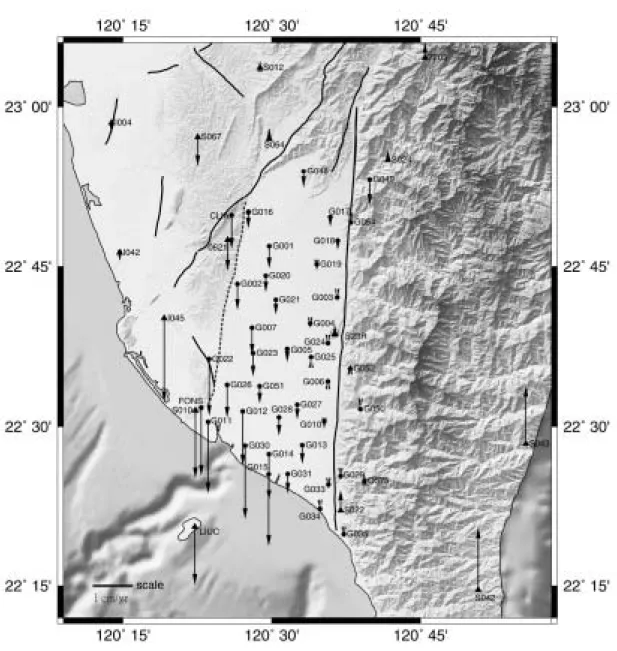
As for the N-S components of station velocities in the study area (Fig. 8), the station velocities vary from 2.1±2.0 mm/yr to -18.8±1.7 mm/yr (the negative sign
indicates southward motion). Only nine stations (G052, G006, O575, G025, S23R, S024, S012, S022 and S064) show northward movement, with station velocities smaller than 2.1 mm/yr, and hence not significant. The other forty stations show southward movement with various velocity values. Remarkably, the southward station velocities are larger in the southwestern coastal area than in other regions. The maximum southward station velocity observed is 18.8±1.7 mm/yr. In detail, Figure 8 shows that the increase in the N-S component of station velocities occurs in the NE-SW direction near the southwestern coast, rather than from North to South (compare for instance stations I045 and G034). For this reason, this aspect will be discussed in the next section, based on observation of NW and SE-directed components of motion. In any case, this general velocity pattern fits well with the hypothesis of lateral extrusion related to the ongoing ESE-WNW collision.
Examining the expected strike-slip, left-lateral component of surface motion along the Chaochou Fault, it appears that the present day gradients of N-S station velocities across the Chaochou fault zone are minor and inconsistent in left-lateral sense (Fig. 8). It should again be kept in mind that these 1996-1999 results do not preclude the possibility of large co-seismic motion occurring from time to time along the fault. Based on the strike-slip and dip-slip components of GPS-derived station velocities, the Chaochou Fault should be considered as inactive during the 1996-1999 survey period. We infer that the Chaochou Fault may be locked with a strong mechanical coupling across the fault zone. Because our conclusion is based on analysis at the surface, the possibility of the Chaochou Fault creeping at depth is not excluded. However, the absence of a dense network of GPS stations in the mountainous region east of the Chaochou Fault still precludes analysis in terms of possible locking depth and fault geometry.
4.3. Activity of the Kaoping Fault
On the assumption of approximately rigid block limited by major structural discontinuities such as the Chaochou Fault, the inferred Kaoping Fault, the Chishan Fault and the front thrust fault (i.e., deformation front), Lacombe et al. (2001) proposed the present-day kinematics of SW Taiwan is both undergoing the E-W shorting and lateral escape. These authors took into account the fault-perpendicular and fault-parallel components of block motion deduced from the previous GPS data (Yu et al., 1997). They suggested the existence of a left-lateral Kaoping Fault based on the change in azimuth of station velocities (S022, S23R in block 1 and 0621, LIUC, S010, I045 in block 2) across the fault. However, a major limitation in this approach resulted from the large spacing between the GPS stations, which were few at the time. We undertook a similar analysis with our denser network of GPS stations in the Pingtung-Kaohsiung area.
Considering the across-strike components first (Figs. 6 and 7), we plotted the E-W components of horizontal velocity because the trends of the Chaochou Fault and the inferred Kaoping Fault are nearly N-S (Fig. 2). Our results show the across-strike components are not significant with a value of less than ~5 mm/yr by considering the velocity gradient between stations G011 and G026. If we consider the velocity gradient of stations in the northern part (CLIA, 0621 and G016) and the southern part (G022, G011 and G026) for the along-strike components of the Kaoping Fault, the left-lateral velocity increases southward from ~4 mm/yr to ~8 mm/yr based on geomorphological analysis. Shuy et al. (2001) proposed that the western side of the Pingtung Plain is also a distinct topographic break (Fig. 2) and pointed out that this linear feature is likely to be modified by erosion of the Kaoping River, the major river of the Pingtung plain. Furthermore, the analysis of Holocene sediment thickness form
the cores retrieved from the Pingtung plain suggest that pre-Quaternary rocks are more than 200 meters lower in the basin located at the east side of the Kaoping Fault than in the hills to the west (Shyu, 1999). This observation implies that the Kaoping Fault is a fault with at least several hundred meters of vertical slip, and separates the rocks of the hills from those of the basin. Contrary to the Chaochou Fault on the opposite edge of the Pingtung basin, where hard basement rocks crop out, the Kaoping Fault affects relatively soft formations of the Late Paleozoic on both its sides. As a consequence, the fault escarpment has undergone significant erosion by the Kaoping River and westward retreat, so that the present-day topography provides little evidence of fault scarp.
4.4. Further evidence of lateral extrusion
We further investigated the deformation pattern in the study area, in relation to the pattern of ESE-WNW collision. We accordingly decomposed the stations velocities into two components, plate-motion-perpendicular component (Figs. 9-10) and the plate-motion-parallel-component (Figs. 11-12). The direction of plate motion between the Philippine Sea plate and Eurasia is 310o based on the NUVEL-1 model (Seno et al., 1993). As a consequence, the two components considered display azimuths of 040° and 130°.
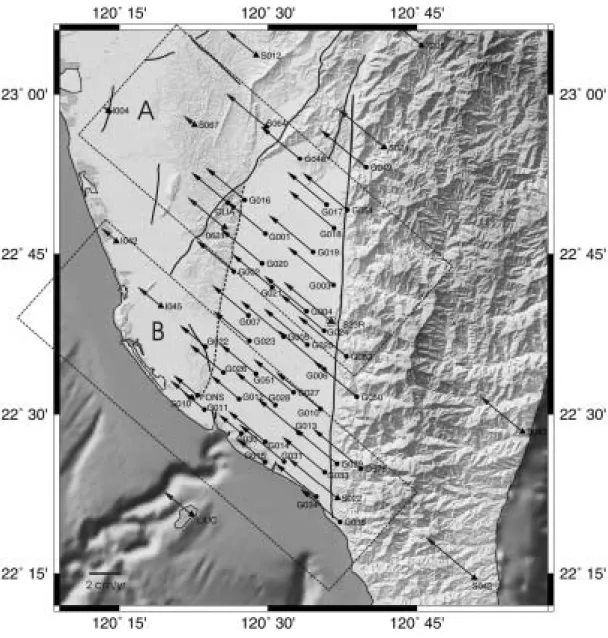
This decomposition of station velocities also facilitated the investigation of activity of the Chishan fault because of the trend of this fault is parallel or subparallel to the plate motion. Based on the plate-motion-parallel components, the station velocities decrease northwestward from 39.9 mm/yr to 17.7 mm/yr (Figs. 9 and 10). An abrupt decrease apparently occurs around the Chishan Fault (Figs. 9 and 10, domain A) but the large spacing between stations precludes clearer identification of
any velocity discontinuity. To the south, where the Chihshan Fault disappears near a zone of transfer faulting, the Fengshan transfer zone (Deffontaines et al., 1997), the station velocities decrease northwestward in a more gradual way. Taking the earlier IES stations into account (Yu et al., 1997), a significant difference in station velocity is located between stations S064 and S067 as well as between stations I042 and I045. Presently available GPS data thus allow identification of a SE-NW shortening of about 20 mm/yr and accommodated within an about 10-km-wide deformation zone.
Considering the plate-motion-perpendicular components (Figs. 11 and 12), the station velocities increase southwestward, from 28.7 mm/yr to 44 mm/yr. An abrupt contrast in velocity apparently occurs across the southwest extension of the Chishan fault zone near the coast (Figs. 11 and 12, domain B), whereas to the north the change is smoother across the Chishan Fault itself (Figs. 11 and 12, domain B). This pattern of the plate-motion-perpendicular station velocities is consistent with the lateral extrusion that is expected to increase towards the southwest. However, there exists a strong possibility of a Chihshan Fault being locked in the interseismic stage, while motion occurs to the south along, and south of, the Fengshan transform fault zone.
The analogue models of Lu and Malavieille (1994) also suggested a southward lateral extrusion of the southern Western Foothills in response to the oblique collision between the Philippines Sea plate and Eurasian plate. Based on numerical simulations, Hu et al. (1997, 2001) pointed out that the significant counterclockwise rotations of station velocities on the coastal area of the Pingtung plain is a result of lateral extrusion. Our results clearly demonstrate that the transtensional deformation and the plate-motion-normal variation of southwestward increase of extensional deformation in the whole area of the Pingtung plain. Based on Quaternary paleostress analysis (Lacombe et al., 1999; 2001), the significant southward increase in the occurrence of extension features which corresponds most nearly with the N-S extension during last
stage of fold development. They pointed out that the tectonic escape might result from the decreasing of a N-S confinement during the last E-W shortening in Pleistocene.
Based on the inversion of fault slip and continuous deformation deduced from GPS data in Taiwan (Yu et al., 1997), Bos et al. (2003) also presented a surface deformation model for southern Taiwan. This model exhibited a strain pattern with E-W contraction accompanied by a southward increase of predominantly N-S oriented extension. They found a right-lateral thrust motion of ~14 mm/yr in a N54oW direction in the deformation front zone, and a left-lateral normal motion of 6-13 mm/yr in the a N110o-130oE direction in the Chaochou Fault zone. The major block bounded by these faults is subject to counterclockwise rotation at a rate of about 12.5o/Ma (Bos et al., 2003), whereas the areas east and west of this block are undergoing significantly smaller counter-clockwise rotation rates, or even clockwise rotation. The authors suggested these patterns of surface deformation are indicative of lateral extrusion toward the Manila accretionary wedge south of Taiwan. Our results of plate-motion-normal component (Figs. 11 and 12), the right-lateral strike-slip surface motion along the Chishan Fault in domains A, is ~7 mm/yr by taking two adjacent stations S064 and CLIA (Fig. 11a) across the fault into account. However, if we take I045 and I042 into account (Fig. 11b), the right-lateral shear across the fault is larger, ~30 mm/yr. It implies that the other active structures with right-lateral motion between these two stations may accommodate the right-lateral shear.
4.5. Relation between horizontal deformation and subsidence
Although there is no need to present again the vertical velocity field of the Pingtung Plain (Hu et al., 2004), it is worthwhile to mention its relation to the horizontal deformation studied herein. The results of 1914-1979 leveling had already
showed that land subsidence was prevailing in the coastal area of the Pingtung Plain (Chen, 1984). According to these studies, the maximum subsidence rate is ~30 mm/yr. This significant subsidence may partly result from the prominent groundwater level decrease for aquacultural use. However, in a recent study of the withdrawal of groundwater, Kuo et al. (2001) pointed that long-term observation of the groundwater table in this region either dropped or showed little change over the last decade and suggested that the total subsidence of the southern Pingtung Plain may be the result of a combination of region tectonic titling and local over-withdrawal groundwater. These observations are also consistent with the Holocene subsidence patterns estimated from the drilling cores in the Pingtung plain (Lai et al., 2002). The average long-term subsidence rate from the Holocene in the southern Pingtung plain is ~4 mm/yr, smaller than that derived from the GPS measurements from 1996 to 1999. We infer that this regional subsidence results from both the prominent groundwater level decrease along with rapid subsidence in the coastal region of the Pingtung plain and the transtensional deformation associated with the tectonic extrusion.
5. Discussion and conclusions
Four years of GPS measurements of the Pingtung-Kaohsiung network and the “Taiwan GPS Network” have provided a comprehensive velocity field depiction in SW Taiwan relative to the stable continental shelf. The dense GPS network facilitates the detailed verification of a tectonic model of SW Taiwan. Our results are in general agreement with the previous models of lateral extrusion due to the low lateral confining conditions related to the Manila subduction zone as a free boundary or/and the presence of prominent Peikang High as a rigid indenter (Lu, 1994; Lu et Malavieille, 1994; Lu et al., 1998; Hu et al., 1997, 2001; Lacombe, 1999; 2001; Bos
et al., 2002). Based on the rigid blocks models (Angelier et al., 1999; Lacombe et al., 2001), the escaping area comprises four rigid blocks moving toward the SW along major discontinuities with both the lateral and reverse shear. These discontinuities comprise the right-lateral reverse motion of the Deformation Front, right-lateral reverse motion of the Chishan fault, left-lateral reverse motion of the Kaoping Fault and left-lateral reverse motion of the Chaochou Fault. Within the regional scale, Bos et al. (2002) estimated the velocity gradient field and fault slip rate of the major discontinuities by using an inversion method on the basis of 141 GPS data in the Taiwan area (Yu et al., 1997). They found right-lateral thrust motion of ~14 mm/yr in a N54oW direction along the Deformation Front and left-lateral normal motion of 6-13 mm/yr in a direction of N110o-N130oE along the Chaochou-Chishan Fault. Although these predictions suggest left-lateral reverse motion across the Chaochou Fault, our results clearly reveal very limited motion along this fault on the basis of both across-strike and along-strike components of GPS data. The disagreement of observation is due to the data density of different GPS networks. The previous GPS data (Yu et al., 1997) are not sufficient to determine the fault slip of the Chaochou Fault if we only consider the difference in direction and magnitude of motion between stations S043 and S23R across the whole Slate Belt. We infer that near the surface the left-lateral normal motion should be accommodated within the Slate Belt. Fisher et al. (2002) pointed out that the southern Backbone Range records extension perpendicular to the mountain belt, and oblique strain axes in the eastern Backbone Range are consistent with left-lateral shear.
One question needs to be addressed clearly about the time and scale of the lateral extrusion in SW Taiwan. Based upon analogue modeling, Lu et al. (1998) predicted the lateral extrusion is mainly produced by the Peikang High and could result in a large left-lateral transfer zone around the shelf break of the Chinese continental
margin. Lacombe et al. (2001) proposed a different model and suggested that the lateral extrusion is acting on the southern tip of the collision belt, probably south of the Chishan Transfer Fault Zone (CTFZ, Deffontaines et al., 1997). However, geological observations in SW Taiwan do not show clear evidence of lateral extrusion in the strata of Quaternary formation (Lacombe et al., 1999). This implies that the lateral extrusion process must have developed recently and compatible with the young and ongoing collision in southern Taiwan. They also pointed out the escaping blocks move southwestward to offshore area based on the similar trend of velocity vectors of LIUC, S010, G011, G030 and G015 (Fig. 3). However, the marine morphology and seismic profiles offshore in SW Taiwan provides no conclusive evidence for tectonic escape (Liu et al., 1997). Indeed, the most recent GPS measurements indicate the velocity field in SW Taiwan (Yu et al., 1997) and in our study area seems to have a systematic trend of increasing southwestward components as a prominent phenomenon of lateral extrusion in SW Taiwan. On the basis of the inversion of BATS (Broadband Array in Taiwan for Seismology) data, Kao and Jian (2001) suggested that the lateral extrusion is probably only a secondary feature in the tectonic processes of Taiwan by two shallow events occurring in SW Taiwan. It is worthy of notice that one strike-slip event at a depth of 24 km with P-axis in the NE-SE direction is a significant indicator that significant shear motion of at least crustal scale exists. Yeh et al. (1991) also pointed out the right-lateral motion along NE-trending structures, especially along the frontal thrust zone and the Chishan fault zone, but the focal depths are not precisely constrained. The significance of counter-clockwise of station velocities is greatly different to those located within the inner part of mountain belt. These observations imply that in the case of SW Taiwan, the velocity vectors may reflect the movement of the sedimentary cover and are at least partially decoupled from the deeper crust.
In summary, the dense GPS network in the Pingtung area shows detailed kinematic behavior of lateral extrusion of the transition zone between collision mountain belt and accretionary prisms of the subduction zone. The distinctive counter-clockwise rotation of the velocity vectors across the Kaohsiung-Pingtung area of SW Taiwan can probably be best explained as a result of the lateral extrusion. Our results clearly demonstrate the transtensional deformation and the along-strike variation of southward increase of extensional deformation in the whole area of southwest Taiwan. The Pingtung plain characterizes the rapid subsidence basin between the Central Range and Western Foothills. The right-lateral and left-lateral structures facilitate the southwestward extrusion, and the deformation of the Western Foothills indicates N-S stretching and E-W shortening. Moreover, GPS vectors indicate that the Chishan Fault is dominated by right-lateral motion with a fault slip rate ~7 mm/yr in the N50oW direction. The Kaoping Fault bounded on the west side of the Pingtung plain is dominated by left-lateral surface motion with a ~4-8 mm/yr in the N-S direction. It is noteworthy that the significant right-lateral component of surface motion of ~24-30 mm/yr should be accommodated on the active structures west of the Chishan Fault between the coast and the Deformation Front. The right-lateral and left-lateral structures facilitate the southwestward extrusion. The Chaochou Fault, as the most important fault in the studied area, is likely to be a reverse fault with left-lateral movement. Based on our studies, the velocity gradients of the GPS stations across the Chaochou Fault are not significant. This implies that the Chaochou Fault is locked and the mechanical coupling along the fault plane should be very strong. The maximum subsidence rate is about ~30 mm/yr near the costal area of southeastern part of Pingtung plain. We infer this regional subsidence maybe due to both the prominent groundwater level decrease with rapid subsidence in the coastal of Pingtung plain as well as the transtensional deformation associated with
the tectonic extrusion.
Acknowledgments
We are grateful two anonymous reviewers for the constructive comments that led us to improve the manuscript. We benefited from fruitful discussions with Chia-Yu Lu, Hao-Tsu Chu, Jian-Cheng Lee, Meng-Long Hsieh, Erwan Pathier and Benoit Deffontaines. This research was supported by grants from the National Science Council of Taiwan (NSC 91-2119-M-002-020, NSC 92-2116-M-002-004) and the Central Geological Survey of the MOEA. Some figures were made using the GMT software written by Paul Wessel and Walter H. F. Smith.
References
Angelier, J., 1986. Preface. Geodynamics of the Eurasia-Philippine Sea plate boundary. Tectonophysics 125, IX-X.
Angelier, J., Yu, S.-B., Lee, J.-C., Hu, J.-C., Chu, H.-T., 1999. Active deformation of Taiwan collision zone : discontinuities in GPS displacement field. Workshop International Conference and 4th Sino-French Symposium on Active Subduction and Collision in Southeast Asia, Memoires Geosciences-Montpellier, No 14, Program and extended abstracts, p. 287-290.
Angelier, J., Chu, H.-T., Lee, J.-C., Hu, J.-C., 2000. Active faulting and earthquake risk: the Chihshang Fault case, Taiwan, J. Geodyn. 29, 151-185.
Angelier, J., Lee, J.-C., Chu, H.-T., Hu, J.-C., Lu, C.-Y., Chan, Y.-C., Lin, T.-J., Font, Y., Deffontaines, B., and Tsai, Y.-B., 2001. Le Séisme de Chichi (1999) et sa place dans l’orègene de Taiwan. C. R. Acad. Sci. Paris, Earth Planet. Sci. 333, 5-21.
Bonilla, M.G., 1975. A review of recently active fault in Taiwan. USGS Open-file report 75-41, pp. 1-55.
Bonilla, M.G., 1977. Summary of Quaternary faulting and elevation changes in Taiwan. Mem. Geol. Soc. China 2, 43-56.
Bos, A.G., Spakman, W., Nyst, M.C.J., 2003. Surface deformation and tectonic setting of Taiwan inferred from a GPS velocity field. J. Geophys. Res. 108(B10), 2458, doi:10.1029/2002JB002336.
Byrne, T., Crespi, J., 1997. Kinematics of the Taiwan arc-continent collision and implications for orogenic process, International Conference and Sino-American Symposium on Tectonics of East Asia, Taipei, Taiwan, p. 38.
Chai, B.H.T., 1972. Structure and tectonic evolution of Taiwan. Am. J. Sci. 272, 389-442.
Chan Y.-C. Lu C.-Y. Lee J.-C., 2000. Orogen-parallel shearing in on-going mountain building: a case study form the southeastern Central Range of Taiwan, Eos. Trans. AGU, Fall Meet. Suppl., Abstract, 81 (48).
Chen, H-F., 1984. Crustal uplift and subsidence in Taiwan: an account based on retriangulation results (in Chinese), Spec. Publ. Cent. Geol. Surv. 3, 127-140. Chen, Y.-G., Liu T.-K., 2000. Holocene uplift and subsidence along an active tectonic
margin southwestern Taiwan. Quat. Sci. Rev. 19, 923-930.
Cheng, H.-C., 2000. Structural geology in the Tainan to Pingtung area of southwestern Taiwan. Unpubl. MSc Memoir, Nat. Central Univ., Chungli, Taiwan (in chinese), 92 pp.
Dadson, S.J., Hovius, N., Chen, H. Dade, W.B. Hsieh, M.-L., Willett, S.D., Hu, J.-C., Horng, M.-J., Chen, M.-C., Stark, C.P., Lague, D., Lin, J.-C., 2003. Links between erosion, runoff variability, and seismicity in the Taiwan orogen, Nature 426, 648-651.
Deffontaines, B., Lacombe, O., Angelier, J., Mouthereau, F., Lee, C.-T., Deramond, J., Lee, J.-F., Yu, M.-S., Liu, P.-M., 1997. Quaternary transfer faulting in Taiwan Foothills: evidence from a multisource approach. Tectonophysics 274, 61-82. Dixon, T.H., 1991. An introduction to the Global Positioning System and some
geological applications. Rev. Geophys. 29, 249-276.
Fisher, D.M., Lu, C.-Y., Chu, H.-T., 2002. Taiwan Slate Belt: insights into the ductile interior of an arc-continent collision, in Byrne, T.B., and Liu, C.-S., eds, Geology and Geophysics of an Arc-Continent Collision, Taiwan. Boulder, Colorado, Geol. Soc. Am. Special Paper 358, 93-106.
Hickman, J.B., Wiltschko, D.V., Hung J.-H., Fang, P., Bock, Y., 2002. Structure and evolution of the active fold-and-thrust belt of southwestern Taiwan form Global Positioning System analysis, in Byrne, T.B., and Liu, C.-S., eds, Geology and Geophysics of an Arc-Continent Collision, Taiwan. Boulder, Colorado, Geol. Soc. Am. Special Paper 358, 93-106.
Ho, C.-S., 1986. A synthesis of the geological evolution of Taiwan. Tectonophysics 125, 1-16.
Hovius, N. Stark, C.P., Chu, H.-T., Lin, J.-C. 2000. Supply and removal of sediment in a landslide-dominated mountain belt: Central Range, Taiwan. J. Geol. 108, 73-89.
Hsu, T.-L., Chang, H.-C., 1979. Quaternary faulting in Taiwan. Mem. Geol. Soc. China 3, 155-165.
Hu, J.-C., Angelier, J., Lee, J.-C., Chu, H.-T., Byrne, D., 1996. Kinematics of convergence, deformation and stress distribution in the Taiwan collision area: 2-D finite-element numerical modelling. Tectonophysics 255, 243-268.
Hu, J.-C., Angelier, J., Yu, S.-B., 1997. An interpretation of the active deformation of southern Taiwan based on numerical simulation and GPS studies.
Tectonophysics 274, 145-169.
Hu, J.-C., Yu, S.-B., Angelier, J., Chu H.-T, 2001. Active deformation of Taiwan from GPS measurements and numerical simulations. J. Geophys. Res. 106, 2265-2280.
Hu, J.-C., Yu, S.-B., Chu, H.-T, Angelier, J., 2002. Transition tectonics of northern Taiwan induced by convergence and trench retreat, in Byrne, T.B., and Liu, C.-S., eds, Geology and Geophysics of an Arc-Continent Collision, Taiwan. Boulder, Colorado, Geol. Soc. Am. Special Paper 358, 147-160.
Hu, J.-C., Chu, H.-T, Hou, C.-S., Lai, T.-H., Chen, R.-F., Nien, P.-F., 2004. The contribution to tectonic subsidence by groundwater abstraction in the Pingtung area, southwestern Taiwan as determined by GPS measurements. Quat. Int., in press.
Hugentobler U., Schaer S., Fridez P., 2001. Bernese GPS software, Version 4.2. Astronomical Institute, University of Berne, 515 pp.
Kao, H., Jian, P.-R., 2001. Seismogenic patterns in the Taiwan region: insights from source parameter inversion of BATS data. Tectonophysics 333, 179-198.
Kuo C.-H., Chan Y.-C., Wang C.-H., 2001. Subsidence: over withdrawal groundwater, tectonic or both? Eos. Trans. AGU, Fall Meet. Suppl., Abstract 82(47), F479. Lacombe, O., Mouthereau, F., Deffontaines, B., Angelier, J. Chu, H.-T., Lee, C.-T.,
1999. Geometry and Quaternary kinematics of fold-and-thrust units of southwestern Taiwan. Tectonics 18, 1198-1223.
Lacombe, O., Mouthereau, F., Angelier, J., Deffontaines, B., 2001. Structural, geodetic and seismological evidence for tectonic escape in SW Taiwan. Tectonophysics 333, 323-345.
Lai T.-H., Hsieh, M.-L., Liew, P.-M., Chen, Y.-G., 2002. Holocene rock uplift and subsidence in the coastal area of Taiwan. Eos. Trans. AGU, Fall Meet. Suppl.,
Abstract, 83(47), F1280.
Li, Y.-H. 1976. Denudation of Taiwan island since the Pliocene epoch. Geology 4, 105-107.
Liew, P.-M., Hsieh, M.-L., Lai, C.-K., 1990. Tectonic significance of Holocene marine terraces in the Coastal Range, eastern Taiwan. Tectonophysics 183, 121-127. Lin, A.T., Watts A.B., 2002. Origin of the west Taiwan basin by orogenic loading and
flexure of a rifted continental margin. J. Geophys. Res. 107, 2185-2203, 2002. Lin, C.-W., Chang, H.-C., Lu, S.-T., Shih, T.-S., Huang, W.-J., 2000. An introduction
of the active faults of Taiwan, Spec. Publ. Cent. Geol. Surv. 13, 122 pp.
Liu C.-C. Yu, S.-B., 1990. Vertical crustal movements in eastern Taiwan and their tectonic implications, Tectonophysics 183, 111-119.
Liu, C.S., Huang, I.L., Tseng, L.S., 1997. Structural features of southwestern Taiwan. Marine Geol. 137, 305-319.
Liu, T.-K. Hsieh, S., Chen, Y.-G., Chen, W.-S., 2001. Thermo-kinematic evolution of the Taiwan oblique-collision mountain belt as revealed by zircon fission track dating. Earth Planet. Sci. Lett. 186, 45-56.
Lu, C.-Y., Malavieille, J., 1994. Oblique convergence, indentation and rotation tectonics in the Taiwan Mountain Belt: Insights from experimental modeling. Earth Planet. Sci. Lett. 121, 477-494.
Lu, C.-Y., Jeng, F.-S., Chang, K.-J., Jian, W.-T., 1998. Impact of basement high on the structure and kinematics of western Taiwan thrust wedge : insights from sandbox models. TAO 9(3), 533-550.
Lundberg, N., Reed, D.L., Liu, C.-S., Lieske, J., 1997. Forearc-basin closure and arc accretion in submarine suture zone south of Taiwan. Tectonophysics 274, 5-23. Malavieille, J., Lallemand, S.E., Dominquez, S., Deschamps, A., Lu, C.-Y., Liu, C.-S.,
and tectonic evolution., in Byrne, T.B., and Liu, C.-S., eds, Geology and Geophysics of an Arc-Continent Collision, Taiwan. Boulder, Colorado, Geol. Soc. Am. Special Paper 358, 187-211.
Molnar, P., Tapponnier, P.,1978. Active Tectonics of Tibet. J. Geophys. Res. 83, 5361-5375.
Mouthereau, F., Deffontaines, B., Lacombe, O., Angelier, J., 2002. Variation along the strike of the Taiwan thrust belt : basement control on structural style, wedge geometry, and kinematics. Geol. Soc. Am. Special Paper 358, 31-54..
Pirazzoli, P.A., Arnold, M., Giresse, P., Hsieh, M.-L., Liew, P.-M., 1993. Marine deposits of late glacial times exposed by tectonic uplift on the east coast of Taiwan. Marine Geol. 110, 1-6.
Ratschbacher, L., Merle, O., 1991. Lateral extrusion in the Eastern Alps, part 2: structural analysis. Tectonics 2, 245-256.
Segall P. and Davis, J.L., 1997. GPS applications for geodynamics and earthquake studies. Annu. Rev. Earth Planet. Sci. 25, 301-336.
Seno, T., Stein, S., Gripp, A.E., 1993. A model for the motion of the Philippine Sea plate consistent with NUVEL-1 and geological data. J. Geophys. Res. 98, 17941-17948.
Shuy B.H., 1999. The sedimentary environment of southern Pingdong plain since the last glacial, Master Thesis, National Taiwan University, Taipei, pp 212.
Shuy, B.H., Sieh, K., Chen, Y.-G., Lee, C.-T., Wang, Y., Ota, Y., Lee, J.-C., Sung, Q.-C., and Rubin, C., 2001. A preliminary neotectonic map of Taiwan, and its implications for future destructive Earthquakes, Eos, Trans., AGU, 82(47) Fall Meet., Suppl., Abstract F1177.
Suppe, J., 1984. Kinematics of arc-continent collision, flipping of subduction and back-arc spreading near Taiwan. Mem. Geol. Soc. China 6, 21-33.
Tapponnier, P., Peltzer, A., Le Dain, Y., Armijo, R., Cobbld, P., 1983. Propagation extrusion tectonics in Asia: new insights from simple experiments with plasticine. Geology 10, 611-616.
Teng, L.S., 1990. Geotectonic evolution of late Cenozoic arc-continent collision in Taiwan. Tectonophysics 183, 57-76.
Teng, L.S., 1996. Extensional collapse of the northern Taiwan mountain belt. Geology 10, 949-952.
Tsai, Y.-B., 1986. Seismotectonics of Taiwan. Tectonophysics 125, 17-37.
Vita-Finzi, C., 2000. Deformation and seismicity of Taiwan, Proc. Natl. Acad. Sci. 97, 11176-11180.
Wang, C.-H., Burnett, W.C., 1990. Holocene mean uplift rates across an active plate collision boundary in Taiwan, Science 248, 204-206.
Wessel, P., Smith, W.H.F., 1998. New, improved version of the Generic Mapping Tools Released. EOS Trans. AGU 79, 579.
Yeh, Y.-H. Barrier, E. C.-H. Lin, C.-H. Angelier, J., 1991. Stress tensor analysis in the Taiwan area from focal mechanisms of earthquakes, Tectonophysics 200, 267-280.
Yu, S.B., Chen, H.Y. 1994. Global positioning system measurements of crustal deformation in the Taiwan arc-continent collision zone. TAO 5, 477-498.
Yu, S.-B. Chen, H.-Y. Kuo, L.-C., 1997. Velocity field of GPS Stations in the Taiwan area. Tectonophysics 274, 41-59.
Yu, S.-B., Kuo, L.-C., Punongbayan, R.S., Ramos, E.G., 1999. GPS observation of crustal deformation in the Taiwan-Luzon region, Geophys. Res. Lett. 26, 923-926.
Yu, S.-B., Kuo, L.-C., 2001. Present-day crustal motion along the Longitudinal Valley Fault, eastern Taiwan. Tectonophysics 333, 199-217.
Zang, S.-X., Chen, Q.-Y., Ning, J.-Y., Shen, Z.-K., Liu, Y.-G., 2002. Motion of the Philippine Sea plate consistent with the NUVEL-1A model. Geophys. J. Int. 150, 809-819.
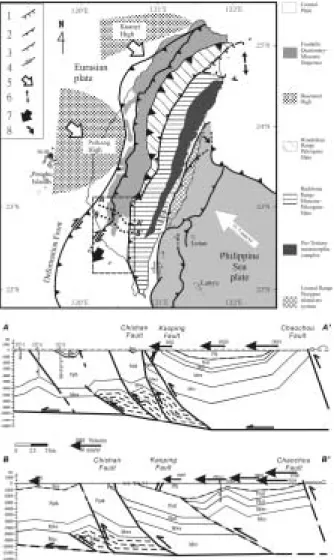
Fig. 1. Tectonic framework and main structural units in Taiwan (map modified after Teng, 1990; Hu et al., 2001; Lacombe et al., 2001; Malavieille et al., 2002). Large open arrows: direction and velocity of plate convergence of Philippine Sea plate and Eurasian plate relative to South China block (Yu et al., 1997; 1999). Major thrust faults with triangles on upthrust side. 1, normal fault; 2, thrust fault (active); 3, thrust fault (inactive); 4, strike-slip fault; 5, indenter of rigid promontory at active belt front; 6, back-arc opening; 7, tectonic escape; 8, migration of thrust front. Dashed frame:
studied area. Cross-sections located in map (A-A’ and B-B’), modified after Cheng, 2000). Pleistocene: Plk Lingkou Conglomerate, Pls Liushuang Fm, Pcc Erhchungchi Fm. Plio-Pleistocene: Pgtk Gutingkeng Fm. Pliocene: Fm, Pnsl Nanshihlun Fm, Pktl Kaitzuliao Fm. Mio-Pliocene: Wushan Fm. Miocene: Mcc Changchihkeng Fm.
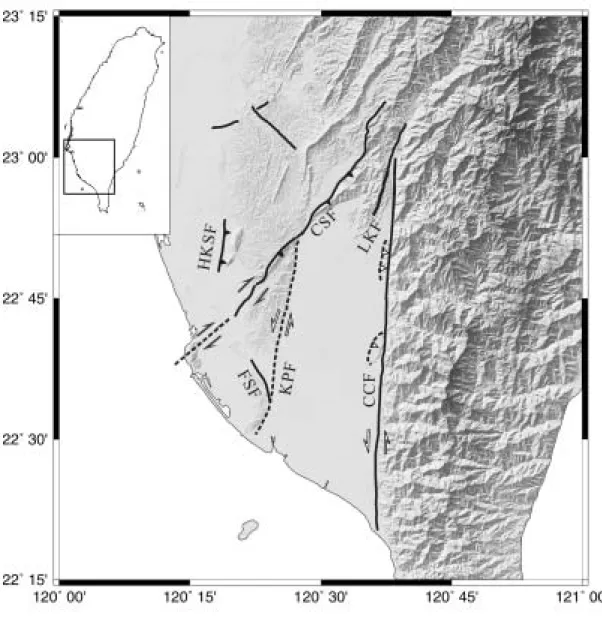
Fig. 2. Neotectonic map of southwestern Taiwan of the study area (modified after Shuy et al., 2001). Thick lines indicate the active faults (Lin et al., 2000). CCF: Chaochou Fault; CSF: Chishan Fault; LKF: Liukuei Fault; HKSF: Hsiaohangshan Fault; FSF: Fengshan Fault; and KPF: Kaoping Fault. The dashed line indicates the inferred fault. Inset shows the location of the study area.
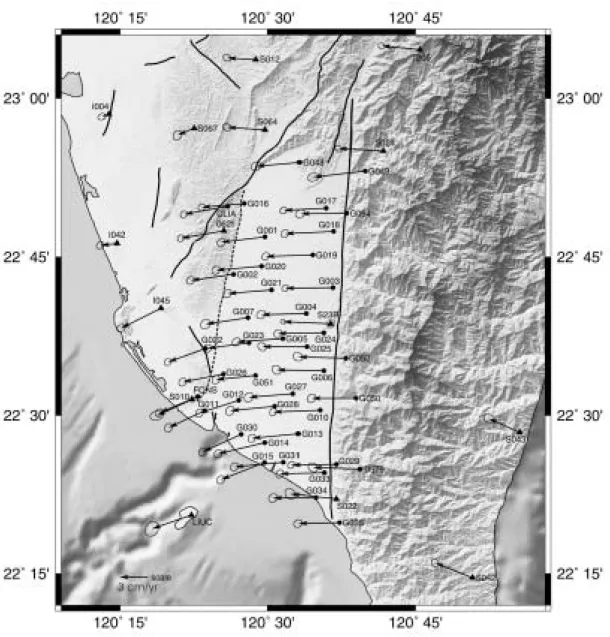
Fig. 3a. The velocities of GPS stations on the Pingtung plain relative to Paisha, Penghu (S01R) from 1996 to 1999. Location of S01R in Fig. 1. The 95% confidence ellipse is shown at the tip of each velocity vector. Solid triangle inside circle indicates permanent station. Solid triangles indicate the GPS stations of Academia Sinica (Yu et al., 1997). Thick lines are active faults (for names, see Fig. 2). Shaded topography is based on 40 m x 40 m DEM.
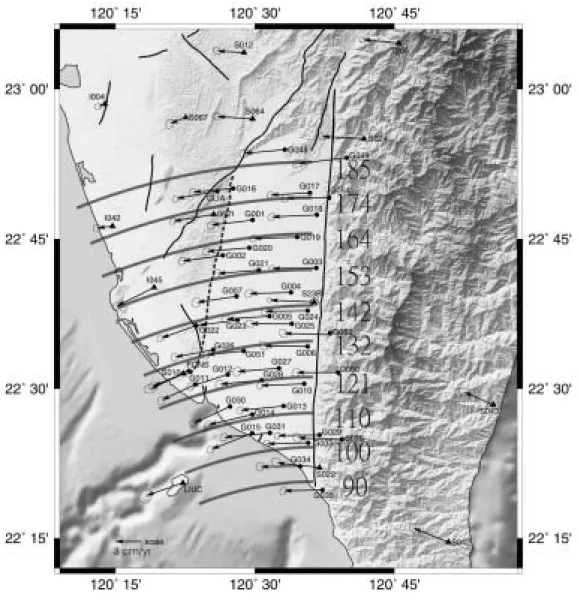
Fig. 3b. The fit between trends of velocity vectors (same as in Fig. 3a) and concentric circles, with centre near 21°50’N-120°36’E. Bold numbers indicate the linear velocity expected for each circle, in percentage relative to the velocity at Liuchiu (LIUC). See text for discussion.
Fig. 4. Example of GPS velocity data recorded through time for station S23R (location in Fig. 3) relative to reference station S01R (Paisha, Penghu). North, East and upward components, from top to bottom. The couples of arrows refer to the 1999 Chichi earthquake.
Fig. 5. Horizontal strain in the Pingtung Plain, calculated from velocity vectors of Fig. 3. Principal strain values with convergent arrows for shortening and divergent arrows for lengthening, with scale shown. Dots refer to GPS stations. Main faults as thick lines (for names, see Fig. 2)
Fig. 6. E-W velocity components of GPS stations on the Pingtung plain relative to Paisha, Penghu, from 1996 to 1999. Same symbols as in Fig. 3.
Fig. 7. Profiles of E-W components of station velocities along three subdomains of study area. CCF, Chaochou Fault; KPF, Kaoping Fault, CSF, Chishan Fault. Subdomains A, B and C are shown in Figure 6.
Fig. 8. N-S velocity components of GPS stations on the Pingtung plain relative to Paisha, Penghu, from 1996 to 1999. Same symbols as in Fig. 3.
Fig. 9. Plate-motion-parallel components of GPS stations on the Pingtung plain relative to Paisha, Penghu (S01R), from 1996 to 1999. Dotted rectangles are the domains of the profiles. Symbols are the same as in Figure 3.
Fig. 10. Plate-motion-parallel components of station velocities along two profiles of the study area. CSF, Chishan Fault. Domains of profiles A, and B are shown in Figure 9.
Fig. 11. Plate-motion-normal components of GPS stations on the Pingtung plain relative to Paisha, Penghu (S01R) from 1996 to 1999. Dotted rectangles are the domains of the profiles (See Figure 12). Symbols are the same as Figure 3.
Fig. 12. Plate-motion-normal components of station velocities along two profiles of the study area. CSF, Chishan Fault. Domains of profiles A and B shown in Figure 11.
Table 1. Velocities of GPS stations in Pingtung area. I042, I045, LIUC, 0621, S010 and S064 are the data from Yu et al. (1997). Errors of station velocities represent 2σ standard deviation.
Station Lon( ° ) Long.( ° ) Ve(mm/yr) Vn(mm/yr) V(mm/yr) Azimuth( ° ) CLIA 120.4324 22.8300 -46.5±1.5 -8.5±1.5 47.2±1.4 259.7±1.6 FONS 120.3817 22.5300 -40.7±1.7 -17.3±1.7 44.2±2.5 247.0±1.6 G001 120.4959 22.7817 -46.7±1.7 -5.7±1.7 47.0±2.2 263.0±1.7 G002 120.4425 22.7230 -45.7±1.7 -6.6±1.7 46.2±2.2 261.8±1.6 G003 120.6098 22.7020 -50.0±1.4 -0.6±1.4 50.0±1.8 269.3±1.2 G004 120.5646 22.6612 -47.3±1.9 -1.3±1.8 47.3±2.3 268.4±1.8 G005 120.5258 22.6213 -49.1±1.8 -3.4±1.7 49.2±2.3 266.0±1.5 G006 120.5943 22.5707 -49.4±1.9 0.9±1.9 49.4±2.3 271.0±1.9 G007 120.4667 22.6543 -45.0±2.1 -6.8±2.0 45.5±2.6 261.4±2.0 G010 120.5884 22.5085 -49.3±1.5 -1.9±1.6 49.3±2.1 267.7±1.3 G011 120.3930 22.5075 -38.2±1.7 -18.0±1.9 42.2±2.6 244.7±1.6 G012 120.4515 22.5241 -42.0±1.7 -13.6±1.8 44.1±2.5 252.0±1.6 G013 120.5512 22.4713 -48.6±1.6 -4.77±1.7 48.8±2.2 264.4±1.5 G014 120.4955 22.4572 -49.6±1.7 -11.9±1.8 51.0±2.2 256.5±1.5 G015 120.4948 22.4258 -46.4±1.7 -18.3±1.7 49.8±2.3 248.4±1.5 G016 120.4608 22.8346 -45.3±1.6 -4.11±1.5 45.5±2.1 264.8±1.4 G017 120.5983 22.8272 -44.5±1.5 -2.5±1.4 44.5±2.2 266.8±1.3 G018 120.6107 22.7907 -50.7±1.7 -2.4±1.6 50.7±2.0 267.3±1.5 G019 120.5758 22.7536 -49.3±1.6 -1.6±1.6 49.4±2.1 268.1±1.5 G020 120.4899 22.7356 -48.5±1.7 -4.3±1.7 48.6±2.2 265.0±1.5 G021 120.5069 22.6982 -46.8±1.8 -3.8±1.8 47.0±2.3 265.3±1.7 G022 120.3947 22.6057 -40.0±1.5 -14.4±1.5 42.5±2.3 250.2±1.3 G023 120.4686 22.6147 -44.2±1.7 -6.0±1.7 44.6±2.4 262.3±1.6 G024 120.5946 22.6305 -48.2±1.7 -0.7±1.7 48.2±2.1 269.2±1.5 G025 120.5660 22.6086 -47.0±1.8 0.1±1.7 47.0±2.3 270.2±1.7 G026 120.4251 22.5652 -43.3±1.6 -8.4±1.7 44.1±2.3 259.1±1.5 G027 120.5430 22.5344 -46.8±1.9 -3.8±2.0 47.0±2.6 265.4±1.8 G028 120.5123 22.5146 -47.4±1.9 -4.7±2.0 47.6±2.5 264.3±1.8 G029 120.6159 22.4229 -47.4±1.4 -0.8±1.5 47.4±2.2 269.1±1.2 G030 120.4553 22.4702 -41.0±1.7 -18.8±1.7 45.1±2.4 245.4±1.5 G031 120.5266 22.4263 -51.8±1.7 -5.0±1.7 52.0±2.2 264.5±1.5 G033 120.5952 22.4095 -46.6±1.6 -1.1±1.7 46.6±2.3 268.6±1.4
G034 120.5812 22.3704 -45.1±1.8 -0.5±1.9 45.1±2.7 269.4±1.6 G035 120.6209 22.3306 -43.8±1.6 -0.9±1.7 43.8±2.5 268.9±1.3 G048 120.5536 22.8994 -45.8±2.0 -4.2±1.9 46.0±2.5 264.7±1.9 G049 120.6646 22.8855 -55.1±2.5 -6.49±1.8 55.5±2.6 263.3±1.8 G050 120.6491 22.5274 -47.3±1.9 -0.1±1.9 47.3±2.4 269.8±1.8 G051 120.4799 22.5631 -42.2±1.7 -4.5±1.8 42.5±2.6 263.9±1.6 G052 120.6319 22.5907 -50.7±1.9 1.4±1.8 50.7±2.3 271.6±1.8 G054 120.6330 22.8191 -48.9±1.8 -0.4±1.7 48.9±2.2 269.5±1.6 0575 120.6557 22.4156 -49.9±2.0 1.7±2.0 49.9±2.5 271.9±1.9 S23R 120.6061 22.6449 -49.9±1.0 2.1±1.0 49.9±1.6 272.5±0.6 I042 120.2446 22.7718 -17.9±1.6 -2.1±1.6 18.0±1.6 263.3±1.6 I045 120.3194 22.6694 -42.4±1.8 -21.2±1.6 47.4±1.8 243.4±1.6 LIUC 120.3707 22.3427 -41.9±2.9 -14.7±3.2 44.4±2.9 250.7±3.2 0621 120.4258 22.7915 -45.6±1.4 -7.8±1.5 46.3±1.4 260.3±1.5 S010 120.3718 22.5254 -37.3±3.0 -17.1±2.0 41.0±2.8 245.4±2.2 S022 120.6157 22.3683 -48.2±2.2 5.3±2.3 48.5±2.2 276.3±2.3 S064 120.4957 22.9504 -37.3±3.0 -17.1±2.0 41.0±2.8 245.4±2.2
Paper II
The contribution to tectonic subsidence by groundwater abstraction in the
Pingtung area, southwestern Taiwan as determined by GPS measurements
Corresponding author: Jyr-Ching HU
Address: Department of Geosciences, National Taiwan University, No. 1,
Sec. 4, Roosevelt Road, Taipei 106, Taiwan
E-mail: [email protected]
Tel: +886-2-23634860
Fax: +886-2-23636095
The contribution to tectonic subsidence by groundwater abstraction in the
Pingtung area, southwestern Taiwan as determined by GPS measurements
Jyr-Ching Hua, Hao-Tsu Chub, Chin-Shyong Houa,b, Tzu-Hua Laib, Rou-Fei Chenc, Pei-Fen Niena
a
Department of Geosciences, National Taiwan University, Taipei, Taiwan, ROC
b
Central Geological Survey, MOEA, P.O. Box 968, Taipei, Taiwan, ROC
c
Observatoire Océanologique de Villefranche-sur-Mer, Université P. & M. Curie, France
Abstract
The three campaigns GPS data from 1996 to 1999 are used to investigate the contribution to tectonic subsidence by groundwater abstraction in the Pingtung plain, southwestern Taiwan. The horizontal station velocities varied from 32 mm/yr to 54 mm/yr in azimuths ranging from 247.2o to 272.6o with respect to the permanent station S01R located in the Penghu islands. In the central and western part of the study area, GPS stations move generally toward the west, whereas in the Kaohsiung-Pingtung coastal area, the displacement vectors demonstrate a clear counter-clockwise deviation towards the SW. The southern part of the offshore coastal area show remarkable extension rates of 0.6-2.0 µstrain/year in an azimuth 015°-020°. The significant southward increase of extensional strain rates is attributed to the lateral extrusion of blocks bounded by major discontinuities in the study area. For the vertical movement, the station velocities are from ~13 mm/yr to -25 mm/yr. Significant subsidence rates from ~11 mm/yr to ~25 mm/yr have been observed. These results clearly demonstrate the existence of transtensional deformation and the southward increase of extensional deformation in the along-strike direction of the whole study area. The comparison with the pattern of Holocene subsidence rates
and the isopach of fine-grained sediments suggest that about 75% of this subsidence may result from the decrease in groundwater levels induced by over-pumping. These localized anthropogenic activities contributed to the natural risk that results from tectonic subsidence associated with tectonic extrusion and lateral extrusion at the southern tip of the Taiwan collision belt.
1. Introduction
Land subsidence resulting from groundwater abstraction has been observed in the world (Hix, 1995; Sun et al., 1999). Over-pumping of groundwater is thus a major concern in some coastal regions of Taiwan (Hsu, 1998; Liu et al., 1999; Fan, 2001). Groundwater has been abundantly used as an alternative to surface water, especially in the southwestern coastal region where the efficiency of surface water resource is severe due to aquaculture and industrial utilization since the 1970’s in Taiwan (MOEA, 1997). Problems of land subsidence in some coastal areas, with induced frequent flooding and infrastructure failure, have since resulted in serious economic loss. In Taiwan, the total area affected by subsidence because of excessive groundwater abstraction has exceeded 1,890 km2. According to a study on land subsidence in the coastal areas of the Pingtung County (MOEA, 1987), using aerial photographs from 1959 to 1985, the total area affected is about 10,347 hectares.
Geodetic leveling is a common technique for monitoring land subsidence on a long-term basis. However, satellite geodesy, especially Global Positioning System (GPS), has become a powerful method for geodetic monitoring over large areas (Dodson, 1995), with significantly increasing accuracy. Using survey mode GPS, a network of stations take measurements periodically, typically once or twice a year, over long periods. This was done in Taiwan, where accurate relative positioning with
GPS allowed for detection of crustal deformation. For instance, to quantify the horizontal present-day deformation across the complex convergent plate boundary zone of Taiwan, 141 stations of the "Taiwan GPS Network" were used to achieve 4-6 survey between 1990 and 1995 using dual-frequency geodetic receivers (Yu et al., 1997). However, analysis of vertical motion in the Pingtung plain, the coverage from these GPS stations was too sparse to allow for good quantification of deformation at the 1-10 km scale. For this purpose, a dense network has been established in 1996 in the Kaohsiung and Pingtung areas, which allowed determination of crustal deformation of tectonic origin mixed with local subsidence resulting from groundwater withdrawal. In this study, the investigators aim to characterise the deformation patterns and the local subsidence in the Pingtung plain (Fig. 1), based on unpublished data from extensive GPS survey conducted between 1996 and 1999.
2. Tectonic and geological backgrounds of the Pingtung area
Southern Taiwan and its offshore areas are currently undergoing incipient collision (Lallemand and Tsien, 1997). It is located in the transition zone between subduction to the south and collision to the north (Fig. 1). It corresponds to the southern part of the Plio-Pleistocene foreland basin in response to lithospheric flexure, which primarily results from the tectonic loading of the Central Range (Lin and Watts, 2002). The Pingtung plain covers an area of 1210 km2 and in map view exhibits a rectangular shape. In cross section, it shows the filling of unconsolidated sediments of the late Pleistocene and the Holocene. Most of these sediments consist of coastal to estuarine sand and mud, with abundant shallow marine to lagoonal shells and foraminifers (Shyu, 1999). The Pingtung plain is bounded by low hills of deformed Quaternary sediments to the north and the west. The metamorphosed Tertiary rocks of
the lofty Central Mountain Range are bordered to the east. To the south, it opens to the Taiwan Strait. Wu (1993) suggested the Pingtung basin is a piggyback basin because the sediments are derived from the uplifted region of the Taiwan orogene and are confined by the Chaochou and Chishan Faults (Fig. 1). Chiang et al. (2004) suggested the Pingtung basin is located at the wedge-top depozone of the southern Taiwan foreland basin system.
The most significant geomorphologic feature of the Pingtung plain is the straight, N-S trend of the Chaochou Fault escarpment, which separates the alluvium plain and the high mountains. East of the Chaochou Fault, the mountains are mainly composed of Eocene-Miocene argillite, slate and meta-sandstone. Based on tectonic analysis of outcrop-scale faults, a predominant transtensional tectonic regime with NNE to NE extension and ESE to SE compression was reconstructed on the eastern side of the Chaochou Fault (Chan et al., 2000). The transition from transpression to recent transtension was also highlighted along the Chaochou Fault, and is probably related to the transition from collision to subduction, which highlights the active extrusion of the study area towards the southeast (Lacombe et al., 1999; 2001).
3. The Pingtung GPS Network
In order to analyse the present-day crustal deformation and land subsidence in the Pingtung area, the ‘Pingtung GPS Network’ covering the Pingtung-Kaohsiung area was established in 1995 by the Central Geological Survey, Ministry of Economic Affairs (Fig. 2). It is composed of 48 annually surveyed stations and one permanent, continuously monitoring station (S23R). During the period from August 1995 to August 1999, the mobile stations of the network were surveyed 3-4 times with dual frequency geodetic GPS receivers. The changes in baseline components derived from
these repeated and continuous GPS measurements provided accurate estimates of the relative velocities of GPS stations in study area. In each survey, 4-8 stations were observed simultaneously with dual-frequency geodetic receivers (Trimble 4000 SSE Geodetic Surveyor). A station was usually active during more than two sessions, each session being composed of 6-14 hours of GPS data acquisition from all available satellites rising higher than a 15° elevation angle. The sampling interval was 15 seconds. Daily solutions were computed for continuous GPS data. The ionosphere-free linear combination of observations at the L1 and L2 frequencies are employed as the basis for estimating the station coordinates and baseline solutions.
We have processed the observed data with the official final precise ephemerides distributed by the IGS. All available temporary measurements and continuous recordings of GPS data were processed with the Bernese GPS software (v.4.2) developed at the Astronomical Institute of the University of Berne (Hugentobler et al., 2001). The observed data in each epoch survey were processed session by session to obtain the baseline solutions for all combinations of any two stations in the same session. The scatter of GPS measurement series taken over several years can be employed as a relative indicator of precision. This long-term repeatability shows the effects of slowly varying systematic errors resulting from propagation delay, multipath, or fiducial network inconsistencies. To first approximation, assuming steady motion between stations during the four-year period, the scatter of data points was defined relative to a best-fit straight line on the plot of baseline components versus time (Dixon, 1991; Segall and Davis, 1997). The repeatability of baseline component (east, north, and vertical) or baseline length is obtained from the root-mean-square scatter about the linear trend. The baselines range from 3 to 21 km in length, most of them being shorter than 10 km. The average rates of length change of each baseline between nearby stations, which are usually observed in the same session, are determined from linear
regression in time. For baseline lengths in the range of 3 to 21 km, the standard deviations were 3-6 mm for the north component, 3-6 mm for the east component and 10-15 mm for the vertical component.
4. Results and Discussions
Our GPS surveys have provided a complete velocity field of SW Taiwan relative to the Paisha station of the Penghu archipelago, which belongs to the stable continental shelf. Horizontal GPS displacement velocities display the trends of variation in the investigated area. The station velocities range between 31 mm/yr and 56 mm/yr, with azimuths ranging between 245o and 273o with respect to the permanent station S01R. Both horizontal and vertical GPS displacement velocities display the trends of variation in the investigated area (Figs. 2 and 4). For the horizontal velocity field, the station velocities decrease westwards and gradually increase southwards. In terms of velocity vector trends, there is a contrast in kinematics in the study area. In the central and western part of the study area, the GPS stations move mostly toward the west, whereas in the Kaohsiung and Pingtung coastal area the displacement vectors show a clear deviation toward the southwest (Fig. 2). As pointed out by Hu et al. (1997; 2001), this significant counter-clockwise rotation of displacement velocity vectors is related to transtensional deformation, and reflects the along-strike southward increase in extensional deformation in southwest Taiwan, in the transition zone from collision to subduction.
The changes in baseline lengths from the repeated GPS surveys in the Pingtung area are used to assess the spatial variation of the horizontal crustal strain over the region. It is assumed that, spatially, the crustal strain accumulates uniformly over each grid, and that the rate of strain accumulation is constant over the time period