I
國
立
交
通
大
學
資訊科學與工程研究所
碩
士
論
文
應用決策樹偵測分散式阻斷攻擊與搭
配灰色理論之追蹤
DDoS Detection with Decision Tree and Traceback
with Grey Relational Analysis
研 究 生:吳奕圻
指導教授:楊武 博士
II
應用決策樹偵測分散式阻斷攻擊與搭配灰色理論之追蹤
DDoS Detection with Decision Tree and Traceback with Grey Relational
Analysis
研 究 生:吳奕圻 Student:Yi-Chi Wu
指導教授:楊武 博士 Advisor:Wuu Yang
國 立 交 通 大 學
資 訊 科 學 與 工 程 研 究 所
碩 士 論 文
A ThesisSubmitted to Institute of Computer Science and Engineering College of Computer Science
National Chiao Tung University in partial Fulfillment of the Requirements
for the Degree of Master
in
Computer Science October 2008
Hsinchu, Taiwan, Republic of China
III
應用決策樹偵測分散式阻斷攻擊與搭配灰
色理論之追蹤
學生:吳奕圻
指導教授:楊 武 博士
國立交通大學資訊科學與工程所碩士班
中文摘要
隨著網路技術的新興,現代人的生活與網路有著愈來愈密不可分的關係。在 這個與生活息息相關的網路環境中,網路安全這個課題也逐漸受到重視。在眾多 的網路攻擊手法中,分散式阻斷攻擊(Distributed Denial-of-service)是最常 發生並造成重大損害的一種攻擊手法。這種攻擊方式,主要是由入侵軟體的漏 洞,進而佔據整台主機,取得管理者的權限,以達到遙控整台主機的目的。因此, 在此攻擊中,攻擊者可藉由此被控制的主機對受害者發送大量的封包,消耗受害 者端的資源。因此,當被遙控的主機數量增多後,受害者終將無法負荷,因而讓 攻擊者達到阻斷服務的目的。有鑑於此,本論文提出一套對於分散式阻斷攻擊的 偵測與追蹤的系統,針對封包流量等資訊,利用人工智慧中的決策樹方法來判斷 主機是否遭受攻擊。本研究並利用非傳統統計學的方法來偵測可能的攻擊路徑, 以期能夠追蹤到攻擊者所在的網域。 我們藉由 DETER 環境建立起擬真的網路環 境,並蒐集現實環境中的網路流量重新在 DETER 完整重現一次,根據實驗結果, 我們的系統對於 DDoS 的偵測約可以得到 false positive ratio about 1.2% ~ 2.4%與 false negative ratio about %5 ~ 10%,追蹤攻擊者可得到約 8% ~ 12%的 false negative rate 與 12% ~ 14%的 false positive rate。IV
DDoS Detection with Decision Tree and Traceback with
Grey Relational Analysis
Student : Yi - Chi Wu
Advisor : Dr. Wuu Yang
Department of Computer Science National Chiao Tung University
Abstract
As modern life becomes increasingly closely bound to the Internet, network security becomes increasingly important. We all live under the shadow of network threats. The threats could cause leakage of privacy and/or economic loss. Among network attacks, the DDoS (distributed denial-of-service) attack is one of the most frequent and serious. In a DDoS attack, an attacker first breaks into many innocent hosts (called zombies) by taking advantages of known or unknown bugs and vulnerabilities in the software. Then the attacker sends a large number of packets from these zombies to a server. These packets either occupy a major portion of the server’s network bandwidth or they consume much of the server’s time. The server is then prevented from conducting normal business operations. To mitigate the DDoS threat, we design a system to detect DDoS attacks based on a decision-tree technique and, after detecting an attack, to trace back to the approximate locations of the attacker with a traffic-flow pattern-matching technique. We conduct our experiment on the DETER system. According to our experiment results, our system could detect the DDoS attack with the false positive ratio about 1.2% ~ 2.4%, false negative ratio about %5 ~ 10% with different kind of attack, attack sending rate and find the attack path in traceback with the false negative rate 8%~12% and false positive rate 12%~16%.
V
ACKNOWLEDGMENTS
我誠摯的感謝我的指導教授楊武老師,在過去兩年的研究時光,由於老師的 指導,讓我能夠ㄧ窺網路安全的堂奧,並且指點研究的正確方向;這都要感謝楊 老師對於我研究靈感上的啟發或是想法的導正都詳細的給予指導,如果我的研究 有任何的成就,都必須歸功於我的指導老師。也要老師給予資質駑鈍且不擅表達 的我極大的耐心與包容,不厭其煩的修改學生的論文,因此若不是有老師對於學 問的嚴謹與熱忱,學生是難以完成本論文的。同時,我也要感謝參與口試的雍忠 教授、謝續平教授與黃育綸教授對於學生的指教與討論,有了這些珍貴且充滿建 設性的建議,才能使得我的論文能夠皆臻完備。 另外我要感謝實驗室中的所有成員,感謝博燁與癸夫學長,不僅僅是在研究 上與實作上的細節給予協助,也能夠在我遭受挫折的時候給予正向的鼓勵。也要 感謝同窗兩年的禮君、帥維與俊宇,豐富了我的研究生涯,使我能夠順利了通過 了這場人生的考驗;感謝實驗室的所有學弟們,你們為實驗室帶來了歡笑與和諧 的氣氛也讓我度過了無數難熬的時光。 女友雅芬在背後默默的支持與包容更是成為了我支撐下去的動力,沒有妳在 我心情煩躁時候的開解,我將無法通過種種難熬的時光。最後我要將此論文獻給 我的雙親,感謝您們不論是在心靈或是經濟上的幫助,讓我能夠心無旁騖的完成 我的論文。The work reported in this thesis is partially supported by National Science Council, Taiwan, Republic of China, under grants NSC 97-2623-7-036-001-D- and NSC 97-2218-E-009-029.
VI
TABLE OF CONTENTS
中文摘要 ... III Abstract ... IV ACKNOWLEDGMENTS ... V TABLE OF CONTENTS ... VI LIST OF FIGURES ... IX LIST OF TABLES ... XI Chapter 1 INTRODUCTION ... 1 1.1 Background ... 1 1.2 Motivation ... 1 1.3 System Overview ... 8 1.4 Outline of Thesis ... 9Chapter 2 RELATED WORKS ... 10
2.1 Related DDoS Detection Mechanisms ... 10
2.1.1 Victim-End Based Detection ... 10
2.1.1.1 Machine Learning ... 10
2.1.1.2 Statistical-Based Model ... 12
2.1.2 Source-End Based Detection ... 13
2.2 Related Traceback Mechanisms ... 14
2.2.1 Link Testing ... 14 2.2.2 Packet Marking ... 15 2.2.2.1 PPM Node-Append... 15 2.2.2.2 PPM Node-Sampling ... 16 2.2.2.3 PPM Edge-Sampling ... 16 2.2.3 ICMP Traceback ... 18
VII
Chapter 3 PROPOSED SYSTEM ... 19
3.1 System Architecture ... 19
3.2 System Modules ... 20
3.2.1 Packet Aggregator ... 20
3.2.2 Protection Agent ... 24
3.2.3 N-hop Sentinel ... 27
3.3 DDoS Detection Phase ... 29
3.4 Traceback Phase ... 33
3.4.1 Attack Edge Determination ... 34
3.4.2 Traffic Flow Pattern Matching ... 36
3.4.2.1 Trend - Pattern Matching ... 37
3.4.2.2 Volume - Pattern Matching ... 52
3.4.3 Traceback Command Forward Policy ... 53
Chapter 4 EXPERIMENT ... 55
4.1 Simulation Design ... 55
4.1.1 Topology Design ... 55
4.1.2 Legitimate Traffic Generator ... 57
4.1.3 Experiment Scenario ... 57
4.1.4 Attack Traffic Generator ... 58
4.2 Performance Evaluation ... 59
4.2.1 Performance Metrics ... 59
4.2.1.1 DDoS Detection Performance Metrics ... 59
4.2.1.2 DDoS Traceback Performance Metrics ... 60
4.2.2 Performance Evaluation ... 61
VIII
4.2.2.2 Performance of Attacker Traceback ... 65 Chapter 5 CONCLUSIONS ... 67 References ... 69
IX
LIST OF FIGURES
Figure 1.1 Classification of DoS (cited from [5]) ... 2
Figure 1.2 Maps figure 1.1 to categories ... 3
Figure 1.3 Processing ICMP echo requests ... 6
Figure 1.4 ICMP echo request/reply header ... 6
Figure 2.1 Diagram of back-propagation ANN(cited from [10]) ... 12
Figure 2.2 Algorithm of packet marking ... 17
Figure 3.1 Setup scenario ... 19
Figure 3.2 Secure tunnel between protection agent and sentinel ... 20
Figure 3.3 Bloom Filter ... 22
Figure 3.4 code of SAX hash function ... 23
Figure 3.5 code section of SDBM hash function ... 23
Figure 3.6 Packet aggregating procedure ... 23
Figure 3.7 Modules in protection agent ... 24
Figure 3.8 Operating flow chart in protection agent ... 26
Figure 3.9 Configuration file format ... 26
Figure 3.10 N-hop sentinel ... 27
Figure 3.11 Modules in sentinel ... 28
Figure 3.12 Operating flow chart in sentinel ... 29
Figure 3.13 Example of decision tree ... 31
Figure 3.14 DDoS detection scenario ... 33
Figure 3.15 Structure of link information ... 35
X
Figure 3.17 Example of link information... 36
Figure 3.18 Example of the similarity problem ... 37
Figure 3.19 Example of traffic pattern ... 53
Figure 4.1 Experiment Topology ... 56
Figure 4.2 Attack scenario in training data ... 58
Figure 4.3 Attack scenario for evaluating purpose ... 58
Figure 4.4 False Positive Ratio in DDoS detection ... 62
Figure 4.5 False negative ratio of TCP SYN flooding attack ... 62
Figure 4.6 False negative ratio of ICMP flooding attack ... 63
Figure 4.7 False negative ratio of UDP flooding attack ... 63
Figure 4.8 False classification ratio of TCP SYN flooding attack ... 63
Figure 4.9 False classification ratio of ICMP flooding attack ... 64
Figure 4.10 False classification ratio of UDP flooding attack ... 64
Figure 4.11 Detection latency of TCP SYN attack ... 64
Figure 4.12 Detection latency of UDP attack ... 65
Figure 4.13 Detection latency of ICMP attack ... 65
Figure 4.14 Misidentified normal edge ratio in traceback ... 66
XI
LIST OF TABLES
Table 1.1 MTU in different environments ... 7
Table 3.1 Format of traffic signature ... 21
Table 3.2 Format of simplified traffic signature ... 28
Table 3.3 Format of traceback command ... 34
Table 4.1 Situation analysis in detection. ... 59
Table 4.2 Equation for FCR ... 60
1
Chapter 1 INTRODUCTION
1.1
Background
With the proliferation of computer networks come many kinds of network attacks. On Feb 7, 2000, the first massive distributed denial-of-service (DDoS) attack, which was targeted against the Yahoo web site [1], was launched. Yahoo servers crashed down and could not provide services to their customers for about several hours, which resulted in serious financial loss. But the attacks were never over. Many other well-known commercial web sites, such as e-Bay, Buy.com, CNN.com, and Amazon, etc., came under similar attacks [2]. These kinds of DDoS attacks cause those web sites serious loss.
1.2
Motivation
Due to the potential serious loss that DDoS attacks could bring up, effective and efficient protection systems are urgently needed. First we must address the DDoS attack methods.
Denial-of-service attacks, as the term suggests, attempt to deny legitimate users the services that the servers provide. Together with the following security issues in today’s networks, attacks occur more and more frequently:
1. The whole network is formed by autonomous systems (AS). Every AS enforces its own policy to manage its network environment. This makes it hard or impossible for the individual intranets to cooperate closely.
2
facilities to verify members in the network. For example, an attacker could easily modify the source address of a packet, which results in difficulties in the traceback of an attack.
3. Software, such as operating systems, frequently contains known or unknown bugs and vulnerabilities which an attacker could take advantage of. This provides the chances to inject malicious code into innocent computers.
Several methods are introduced in [3][4][5] that take advantage of the vulnerabilities in network protocols and bugs in software for DDoS attacks. There are two broad categories of DDoS attack methods:
1. It consumes all the limited resources and bandwidth allocated to the victim, for example, TCP SYN flood attack, ICMP flood attack, UDP flood attack, etc.
2. It takes advantage of the vulnerability of processing packets in OS, for example, Teardrop, Ping of death, etc.
[5] also classifies attack methods into Figure 1.1.
Figure 1.1 Classification of DoS (cited from [5])
CERT/TW [6] classifies DDoS attacks into two categories, flooding–based attacks and software exploits. The latter are often referred to as worm attacks. Figure 1.2 illustrates the relationship between the classification in CERT/TW and classification in [5].
3 Data Flood
Flooding - based
OS Level Application Level Software Exploits
Network Device Level
Protocol Feature Attack
Figure 1.2 Maps figure 1.1 to categories
Before we present our detection system, further understanding of the attack methods is required. We will discuss how a DDoS attack is launched in what follows.
1 TCP SYN flooding attack (flooding-based):
The TCP SYN flooding attack is aimed at the three-way-handshake vulnerability in network protocols of layer 4. A client and a server establish a communication session with a three-way-handshake procedure. When a client intends to communicate with a server, he first submits a SYN (synchronize/start) packet, which includes the IP address and the port number of the client. Upon receiving a SYN packet, the server would send back to the client a SYN-ACK (synchronize/acknowledge) packet. After sending the SYN-ACK packet, the server will create a TCB (task control block) to maintain communication and wait for the client to send back an ACK packet. A communication session is established when the server receives the ACK packet from the client. Nevertheless the number of the TCBs in the server is often limited. The attacker could send a large number of
4
SYN packets to the server and hence, occupies a lot of TCBs. Due to the lack of available TCBs, the server could not provide services to legitimate clients.
TCP SYN flooding attack does not depend on the bugs in software, but on the defects in the network protocols. The Mail Bombing DoS attack [7] is also a variation of flooding attack. The land attack [8] is a variation of TCP SYN attacks but is aimed at exhausting the resources in a server. The attacker fill the source-IP-address and destination-IP-address fields in the SYN packet with the victim’s address, which means that the source-IP-address and destination-IP-address are victim’s IP address. Therefore the victim couldn’t complete the three-way-handshake procedure and consumes the CPU and memory usage of victim’s own.
2. UDP flooding attack (flooding-based):
Attacker send the UDP packet with forged source IP address toward to any port number (usually 7, echo) of the victim end. The victim end would find out which application is occupying. If no applications are detected, the victim end would send an ICMP destination unreachable back to the source IP address. Therefore the method of attack is that the attacker sends huge amount of UDP packets to victim end and make the victim too busy send back the ICMP packets to deal with sessions with other clients.
3. ICMP flooding (angry ping) :
Attacker also generates huge number of ICMP echo request packets toward victim with forged source IP address, therefore the victim end must reply the number of packets as much as the attacker sends. The victim would not only have to deal with the receiving the packets from attacker, but to reply the
5
ICMP echo response back. Consequently, the bandwidth, CPU, memory resources of victim will be used up.
4. Smurf attack (flooding - based):
Smurf attack is a kind of variation of ICMP floods and similar to the land attack; Attacker modify the source IP address of ICMP echo request as the victim’s IP address as well, then sends this modified packet to the IP broadcast address. The victim would receive the ICMP echo reply from all the hosts within the subnet it resides. Therefore the subnet network would be congested due to those ICMP packets storm. This kind of attack has the effect of amplifying the threat of ICMP flooding attack. The UDP version of smurf attack is called fraggle attack.
5. Ping of death (software exploits):
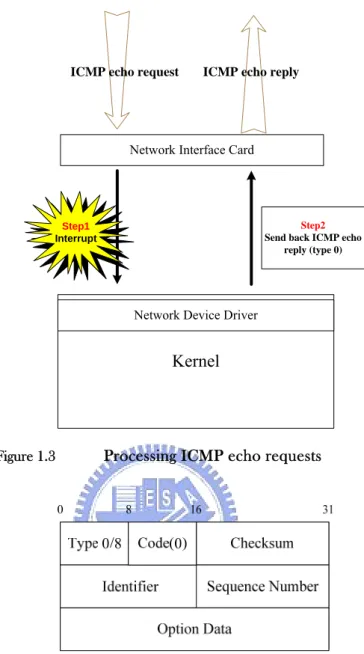
This attack takes advantage of the procedure of processing the ICMP packets. When a host receives an ICMP echo request (type 8), the network device would issue an interrupt to kernel for processing and sending the ICMP echo reply (type 0) back to source and the original option data in ICMP echo request must be copied to the reply packet without change(Figure 1.3). So the attacker injects lots of garbage into the “Option Data” segment of ICMP format(Figure 1.4) and extends the total length of packet to exceed the legal length, 65535 bytes, therefore the victim would be crashed when receiving this kind of malformed packet. This attack is aimed to the vulnerability in the implementation of kernel.
6
Kernel
Network Device Driver
Step1
Interrupt
ICMP echo request
Step2
Send back ICMP echo reply (type 0)
Network Interface Card
ICMP echo reply
Figure 1.3 Processing ICMP echo requests
Figure 1.4 ICMP echo request/reply header
6. Teardrop (software exploits):
Teardrop attack’s target is the leakage in the reassembly of packet fragments. Because the maximum transmission unit (MTU) in every network environment is different (Table 1.1), therefore the IP packets are cut into small fragments when transmitting to networks applied different protocol. The teardrop attack modifies the offset in packet fragments to make some them overlap. When the victim received these kinds of modified fragments and try to reassemble them according to the offset, some kernel would be
7
crashed if it couldn’t handle this exception.
Protocol MTU (bytes) Ethernet Used 1,500 Ethernet Actually 1,496
PPPoE 1,492 Dial-up 576 Table 1.1 MTU in different environments
Except the attacks we mentioned above, there are another two different attacks aimed to the lack of authentication in routing protocol, such as RIP (Router Information Protocol) v1 and BGP (Border Gateway Protocol) v4 and DNS (Domain name server). These vulnerability provides the probability that attacker might masquerade the routing information or perpetrate the cache poisoning to modify the information in routing table and cache in DNS in order to redirect the legitimate user’s connection to the attacker’s own malicious website.
Among all the attack mentioned above, attacker modifies the source IP address in the packets (a.k.a. IP spoofing) to make traceback much more difficult. Therefore the goal that our system will achieve is to detect the attack quickly, traceback to the attack launching source with more accuracy. We could summary our demand to the detection and traceback system as follow:
1. No need to modify the existing protocol of TCP/IP for increasing the compatibility.
2. Only slightly setup procedures on routers.
8 4. Could fit to large-scale of topology. 5. Efficient while processing the traceback 6. Information about topology isn’t needed
In the thesis, we focus on the flooding-based attack aiming to layer 3/layer 4 in the OSI 7 layers model and apply the AI-algorithm based decision tree to help distinguish and detect between the abnormal and normal traffic flows. Then the traffic flow pattern matching methodology would help us find the traffic flow most similar to the attack flow and trace it back to the original source.
1.3
System Overview
Our system basically consists of two subsystems, the protection agent located only in victim and the sentinels located in routers. The sentinels record the “footprint” (traffic signature aggregated in sentinel) of the attacker. Both protection agent and sentinels collect all the packets passing them and retrieve the information in network layer 3/layer 4 from those packets, then aggregating those retrieved information for the purpose of detection and further traceback. The protection agent is in charge of the DDoS attack detection and traceback procedures. The main concept of our DDoS attack detection is based on the deciding the traffic flow pattern under the situation without attack and the one under different attack. Therefore the detection of attack from normal situation could be viewed as the classification problem and we propose 15 different attributes, which not only monitoring the incoming/outgoing packet/bytes rate but also compiling the TCP SYN and ACK flag rate, to describe the traffic flow pattern. Then we take these attributes as the tests in decision tree and the decision tree constructing algorithm, C4.5 classifier, would help us find the key attributes to
9
distinguish the difference between the traffic flow pattern under normal situation without under attack and the ones under different attack with less time consuming and more accuracy rate. The whole process cold exploit the traffic signature or regularity of DDoS attack and our system could detect the attack according to the regularity as well. For further zero-day attack, the increasing degree of various provided traffic flow pattern also provides the possibility to constitute the detection approaches to deal with the attack. In the traceback procedure, the whole traceback procedure is accomplished by the message inter-communication between protection agent and sentinels. Whenever the protection agent detects the DDoS attack, it raises the alarm and sends out the designed traceback command containing the time when the attack has been detected, traffic information as evidence of attack traffic, type of the detected attack. When sentinels receive this kind of command, they would find the possible sets of NICs whose input traffics are most related to the evidence in the received command and send back the edge sampling to the protection agent to construct the attack path. The BFS (bread-first-search) algorithm is applied to traversal the whole topology. Then the GRA (grey relational analysis) is responsible for the traffic flow pattern matching to find the possible entrances of attack traffic.
1.4
Outline of Thesis
The remainder of this thesis consists of four chapters. We will discuss and analyze existing detection and traceback mechanisms in chapter 2. In chapter 3, we introduce the proposed detection and traceback methods in our system. In chapter 4, there will be the experiment results, which indicate that our proposed system is capable of detecting the attacks and tracing them back with high accuracy. In the last chapter, there will be conclusion and future work.
10
Chapter 2 RELATED WORKS
In this chapter, we are going to introduce some techniques and mechanisms for DDoS attack detection and the track down the attacker’s location.
2.1
Related DDoS Detection Mechanisms
The DDoS attack detection mechanism could be divided into two categories depending on the locations of the DDoS attack detection systems. One category is source-end based, in which the detection system is close to the attacker. The other is victim-end based, in which the detection system is close to the victim. We will introduce some victim-end based at 2.1.1 and source-end at 2.1.2.
2.1.1 Victim-End
Based
Detection
2.1.1.1
Machine
Learning
Machine learning has been widely applied for DDoS attack detection. The detection policy is based on anomaly detection and the machine learning would detect the DDoS attack according to the variance in traffic flows or distribution of packet flags between the situation under normal situation and one under attack. In [9], it monitors the distribution rate of flags in TCP packets and names it as TRA (traffic rate analysis). This method actually only calculates two metrics as criterion to detect the ongoing attack. One is TCP flags rate and another is protocol rate. In TCP flags rate, it counts the number of SYN, FIN, RST, ACK, PSH and URG flags in TCP packets and the number of packets as well during a specific period of time referred to observation sampling time. A flag rate is expressed as the ratio of
11
the number of a TCP flag to the total number of TCP packets. Equation 2.1 gives the definition of flag rate.
) ( _ _ _ _ _ _ _ ) ( _ _ _ _ ] [ inbound packets TCP of number total header TCP a in F flag a of number total Fi Rtd = ) ( _ _ _ _ _ _ _ ) ( _ _ _ _ ] [ outbound packets TCP of number total header TCP a in F flag a of number total Fo Rtd = Equation 2.1
The protocol rate is just like Equation 2.1 which substitutes the total number of TCP, UDP, ICMP packets for the numerator to calculate the protocol rate for those layer 3/layer 4 protocols. Then it applies the machine learning method to identify the pattern under attack from one under normal situation.
In [10], the system not only monitors the network traffic but also the utilization of resources. Because the DDoS attack aimed for the limited resources as well, therefore the system takes the utilization of resources into account. The whole system consists of five main components, which denoted as load-probes, traffic-probes, server, filter, management. Load-probe is used for the purpose of probing the utilization of resources to monitor them if they are overused. Traffic-probe monitors the traffic header for later learning procedure. Server is the central component using for handling the message passing and monitoring the state of the system. Traffic-filter applies the filtering rules generated by the machine learning according to the training data to filter out the traffic and indicate if the traffic is a malicious one or not. Management interface is a web-based interface for user to view the state of system or to alter the configuration of system. The DDoS attack detection in this system is based on back-propagation
12 ANN(artificial neural network) as Figure 2.1.
Figure 2.1 Diagram of back-propagation ANN(cited from [10])
2.1.1.2 Statistical-Based Model
In [11], the non-parametric CUSUM algorithm based on is used for detection. It made a model for SYN, ACK packets instead of SYN-FIN and defines the term Xn as Equation 2.2.
0 ) 0 ( ) ( ) 1 ( 1 = − + = − x n SYN X Xn α n α Equation 2.2
Where SYN(n) represents the number of SYN packets received and α is ranged from 0 to 1. If the observation has more favor for the past experience, then the value of α could be higher. Then it also defines the term yn as
13 Equation 2.3.
{
}
0 0 ), ( max 0 1 = + = − y X y yn n n Equation 2.3The contiguous appearance of positive y represents the large number SYN packet has been received. Therefore, there is a threshold to indicate if the warning of attack should be issued.
2.1.2 Source-End
Based Detection
The source-end based detection deploys the detection system as possible as close to the attacker, therefore the placement of this system would be on the edge router. In [13], it introduces five observations to design and build an effective source-end detection system, which are source-end firewall, threshold anomaly detection, two-way traffic dynamics, spoofing detection and connection semantics. One of famous source-end based detection system named D-WARD[14] deployed as a gateway router to detect the attack and limit the traffic flow for legitimate users inside the intranet. The observation component of D-WARD monitors not only the incoming and outgoing traffic between the intranet and internet but also the IP address and port number for the connections. Its observation applied the two-way traffic dynamics for building the models of traffic and connections. D-WARD take advantage of the mechanism of back-off in TCP data flow if the sending rate is low. But the attacker doesn’t slow down the sending rate, therefore D-WARD could define the traffic flow model to identify if the traffic belongs to malicious or legitimate one. ANTID [38] proposed the defense system including the source-end and victim-end defense system to throttle the attack traffic and reduce the collateral damage to legitimate clients. It provides the attacker
14
traceback by hash-based mechanism to achieve the one-packet traceback.
2.2
Related Traceback Mechanisms
Traceback technique is also an import part of DDoS attack defense due to the IP spoofing by attackers. Hence the source IP is not reliable enough for the victim to indicate the source of the attackers. According to [15], there are some basic IP traceback methods introduced.
2.2.1 Link
Testing
The basic procedure of link testing is that it starts from the router closest to victim and test the links upstream to identify which link forwards the attack packet to victim. Then it recursively perform the procedure until the source of attack was detected. There two variation of the link testing, which are input debugging[16] and controlled flooding[17] .
The input debugging needs that victim reports the attack signature to the specific network operator when an attack was detected by the victim, then the network operator applies the debugging filter on the egress port in victim’s upstream router. It continues this debugging filter installation to the upstream router until the attacker’s site or the edge router reached. This procedure reveals that the large overhead in manage and makes it worse when the traceback across the AS-level network.
The controlled flooding, in fact, is a traceback method applying the DoS attack. First, the victim works with the routers closet to itself, then launching the attack to every individual link in the routers. If the rate in receiving malicious packets drops all of sudden, then the specific link which is now under the self-launching attack is possibly
15
one of the routers and belongs to the attack path. Although this method needs not the collection of attack signatures by victim itself, however this method itself is a kind of attack toward to routers. Therefore the legitimate traffic would be influenced as well.
2.2.2 Packet
Marking
The packet marking methods are probably the most economically traceback procedure due to the less overhead on router. However, this is a trade-off between the resources and accuracy on compatibility due the nature of packet modifying in packet marking. The basic concept of packet marking is marking the address or id of router on the unused or rare used fields in packet. The fields to place the marking depend on different methods. There are lots of variations of packet marking have been developed, we will introduce the most classical three methods[15].
2.2.2.1 PPM Node-Append
The PPM(probability packet marking) node-append is the foundation among the variation of packet marking. Every individual router places its address or id into the option field in received packet and then forwarded it. If the option field in packet has been marked, the next receiving router would append its address right behind the address of the previous router. Therefore, when the victim received the packet, the path that this packet passed is contained in the option field. Nevertheless, the marking procedure on every router also brings overhead to routers while forwarding the packets. And if the path of packet is too long, there is no space in option field for appending the routers one after another.
16
2.2.2.2
PPM
Node-Sampling
Due to the overhead that PPM node-append could bring to routers, the PPM node-sampling applies the concept of probability to improve the node-append. Every router in node-sampling only marks its address when a random number r is smaller than a pre-defined p. When a router received a already marked packet, it replaces its own address for the existed one instead of appending behind the existed one. This probability marking procedure makes that the probability the received packet marked by the router d hops away is (1-p)d−1
p . But the attack path reconstruction is heuristic. It has to send lots of sample packets toward the victim to sample the order of routers. It makes the assumption that the farther the router is, the receiving probability of packet marked by the router is smaller, therefore the distance between the router and victim depends on the number of marked packets received by victim. The more the number of receiving marked packets is, the less distance between the router which marked the packet and victim. Then the victim constructs the attack path according to the number of packets marked by the same router as the possible distance. However, this attack path reconstruction procedure only works for DoS attack, because the DDoS attack could generate lots of packet which could lead to the confusion of length identification in attack path.
2.2.2.3
PPM
Edge-Sampling
The edge-sampling method improves the node-sampling in the path reconstruction. Every router in edge-sampling marks the packet when a random
17
number r is smaller than pre-defined number p. But the format of marking has been modified and consists of three fields, which are “start”, “end” and “distance”. When a router decides to mark the packet, it places its address in the “start” field and reset the “distance” field to zero. Whereas, if the router decides not to mark the packet, it would check the value in “distance” field, if the value is zero, then the router places its address in the “end” field and increases the value by 1. If the value in “distance” field is not zero, the router only increases the distance value by 1 without marking its address in the “end” field. According to the marking procedure described above, the victim could easily know how many hops the marking router is away from the victim and the “start” and “end” fields could identify the relationship between routers. Figure 2.2 illustrate the algorithm of packet marking in PPM edge-sampling.
Marking procedure at router R:
For each packet w
Let r be a random number from [0..1] If r < p then
Write R into w.start and 0 into w.distance Else
If w.distance = 0 then write R into w.end increment w.distance
18
2.2.3 ICMP
Traceback
The original ICMP traceback[19] illustrates the traceback method applying the ICMP packet with a designated router named “iTrace”. The idea of ICMP traceback is like the packet marking procedure. The iTrace router copies the partial contents of the received packet into a special designed ICMP packet which contains the address of the previous router the packet has passed and the one of next router according to the pre-defined probability. Then the iTrace router sends this kind of special ICMP packet to the source address and destination address. Then the victim could easily reconstruct the attack path according to those ICMP packets. However, the procedure could fail due to the unwillingness in receiving ICMP packet and filtering the ICMP packet in order to prevent the ICMP flooding attack.
19
Chapter 3 PROPOSED SYSTEM
In this chapter we will describe the components in the entire system from the overall view. Then we are going to apply the artificial intelligence-based (AI-based) classifier in the DDoS detection to help us distinguish between the legitimate and malicious traffic flow. In traceback procedure, the concept of traffic flow pattern matching introduced in [29] would participate in the comparison of traffic signature.
3.1
System Architecture
In our system design concept, it consists of two different parts which are protection agent and sentinel, separately. The objective of our system is to apply a protection agent located in victim end to manage the detection of attack and sentinels located in routers to deal with traceback procedure. The overall concept could be viewed as Figure 3.1.
Figure 3.1 Setup scenario
The links between protection agent and sentinels are protected by the secure tunnel (Figure 3.2) established to apply port forwarding in ssh-2(secure shell protocol ver.2) for secure communication and prevent from main-in-the-middle attack.
20
Figure 3.2 Secure tunnel between protection agent and sentinel
3.2
System Modules
3.2.1 Packet
Aggregator
The packet aggregator computes a traffic signature based on all the packets passing through. The traffic signature is used for detection and traceback. With the help of pcap [20], our system captures all incoming and outgoing packets. For each packet, the packet header from layer 3 to layer 4 is extracted for cross-layer monitoring. The header information is used to compute a traffic signature, whose format is shown in Table 3.1. Our system generates one traffic signature per minute.
Attributes Value
1. Incoming packet count per t min. Numeric
2. Incoming total bytes per t min. Numeric
3. # of incoming TCP packets per t min. Numeric
4. # of incoming UDP packets per t min. Numeric
5. # of incoming ICMP packets per t min. Numeric
6. # of incoming unknown-protocol packets per t min. Numeric
21
8. outgoing packet count per t min. Numeric
9. outgoing total bytes per t min. Numeric
10. # of outgoing TCP packets per t min. Numeric
11. # of outgoing UDP packets per t min. Numeric
12. # of outgoing ICMP packets per t min. Numeric
13. # of outgoing unknown-protocol packets per t min. numeric
14. # of incoming TCP SYN packets / # of incoming TCP SYN-ACK packets Numeric 15. # of incoming packets / # of incoming IP addresses per t min Numeric
16. Time Interval Morning, afternoon,
evening, bed-time
Table 3.1 Format of traffic signature
Generally, the time interval “morning” defined above represents the time range from 8:00 to 12:00, “afternoon” is ranged from 12:01 to 18:00, “evening” is ranged from 18:01 to 00:00 and “bed-time” is ranged from 00:01 to 7:59 next day. “# of incoming TCP packets per t min” represents the number of incoming TCP packets received per t minutes. The attribute “number of different incoming IP counts / number of different outgoing IP counts” computes the ratio between the number of different source IP addresses in incoming packets and the number of different destination IP addresses in outgoing packets. Because the DDoS attack often comes up with IP spoofing attack, therefore the attack traffic is filled with packets with one-time used IP address generated by PRNG (pseudo random number generator). Therefore this would influence the ratio between incoming/outgoing IP counts and result in difference between normal and attack situation. “number of incoming packets / incoming different number of source IP” is defined as the average number of packets that one IP address would send per t minutes during interactive session and according to the assumption, the spoofing rate should be more close to 1 when under attack.
22
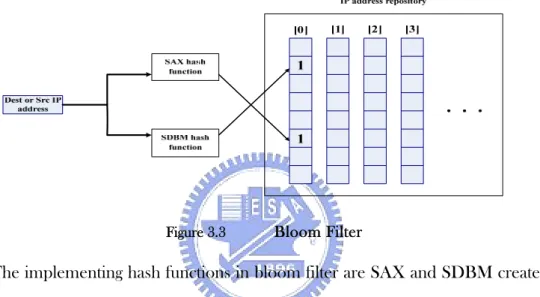
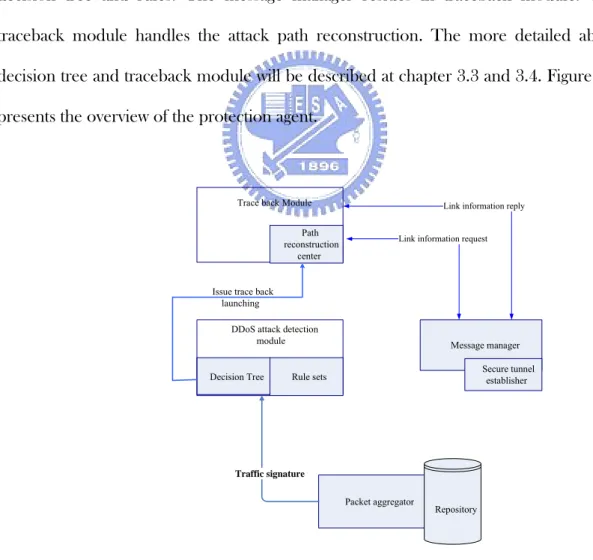
timestamp used to record the receiving time for further DDoS attack traceback procedure. Plus, we aggregate the incoming and outgoing IP address of packet by bloom filter [21] to reduce the memory overhead while storing the IP address. Figure 3.3 is the design concept of our bloom filter. The Bloom filter computes k (which is the number of hash function used in bloom filter) distinct digests for each IP address with independent hash functions, and uses the n-bit results to index into a 2n- bit array
Figure 3.3 Bloom Filter
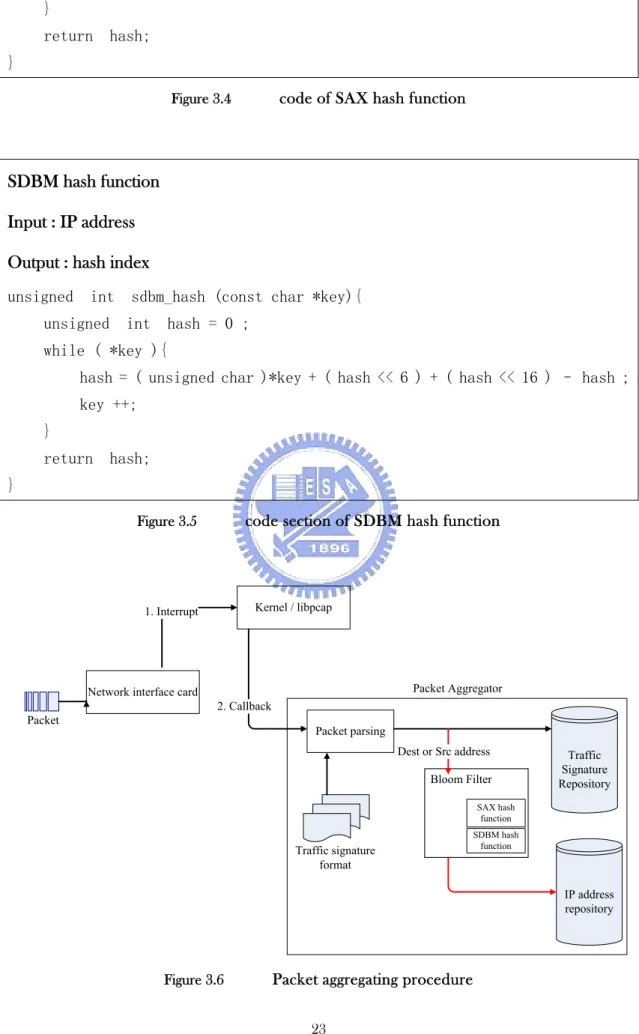
The implementing hash functions in bloom filter are SAX and SDBM created for sdbm(a public-domain reimplementation of Neuros Database Manipulator(ndbm)) database library. The code sections of these two hash function are presented in Figure 3.3 and Figure 3.4. The whole picture of packet processing is as Figure 3.6. With the help of bloom filter, we could reduce the 32–bits IP address into 2 bits.
SAX hash function Input : IP address Output : hash index
unsigned int sax_hash (const char *key){ unsigned int hash = 0;
while ( *key ){
23
}
return hash; }
Figure 3.4 code of SAX hash function
SDBM hash function Input : IP address Output : hash index
unsigned int sdbm_hash (const char *key){ unsigned int hash = 0 ;
while ( *key ){
hash = ( unsigned char )*key + ( hash << 6 ) + ( hash << 16 ) – hash ; key ++;
}
return hash; }
Figure 3.5 code section of SDBM hash function
Packet
Network interface card
Kernel / libpcap 1. Interrupt Packet parsing Packet Aggregator Traffic Signature Repository Traffic signature format 2. Callback SAX hash function SDBM hash function Bloom Filter IP address repository Dest or Src address
24
3.2.2 Protection
Agent
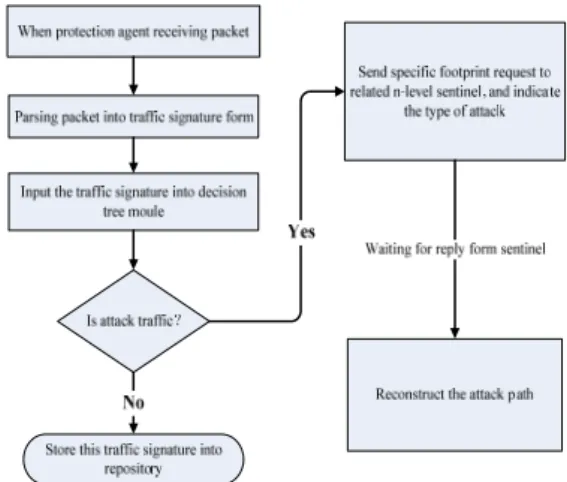
The protection agent is the control center of the entire system. The DDoS attack detection and attack path reconstruction are all handled in the protection agent. Protection agent consists of mainly four components: a packet aggregator (to aggregate the traffic signatures), a message manager (to construct the SSH-tunnel and handle communication between the protection agent and sentinels), a DDoS attack detection module, and a traceback module. The DDoS attack detection module includes the decision tree and rules. The message manager resides in traceback module. The traceback module handles the attack path reconstruction. The more detailed about decision tree and traceback module will be described at chapter 3.3 and 3.4. Figure 3.7 presents the overview of the protection agent.
Path reconstruction
center Trace back Module
Decision Tree Rule sets DDoS attack detection
module Packet aggregator Repository Traffic signature Message manager Secure tunnel establisher Issue trace back
launching
Link information reply Link information request
Figure 3.7 Modules in protection agent
25
protection agent. When an attack was detected by the DDoS detection module, the module issues a command to traceback module for launching traceback procedure. Then the traceback module would retrieve the attack signatures which are called “evidence” from packet aggregator and the number of attack signatures used as evidence depends on observed window (a user-predefined value to indicate the number of attack signatures needed to form the evidence). Then the traceback module sends traceback command to upstream sentinel and wait for the sentinel sending back the link information (which contains IP addresses of the two ends of the edge and distances from victim) and then constructs the attack path by the received link information. The flow chart of the operation in protection agent could be summarized below and depicted in Figure 3.8.
1. Obtain the signature of the traffic flow.
2. DDoS detection module determines if an attack is ongoing according to the received traffic information.
3. If no attack, then the agent stores this traffic signature into the repository. 4. If there is an attack, then
4.1 The agent sends out a traceback command to the upstream sentinel.
4.2 Wait until link information (which contains IP addresses of the two ends of the edge and distances from victim) was collected.
4.3 Construct the attack paths by link information. 5. Go to step 1.
26
Figure 3.8 Operating flow chart in protection agent
The network administrator could assign the parameter of protection agent, such as recording time-interval. Therefore network administrator must give a configuration file in the form of XML and start the protection agent with this configuration file. Figure 3.9 gives an example.
<?xml version="1.0" encoding="UTF-8"?> <body>
<attributes>
<time-slice>2</time-slice> // the unit of recording interval
<decision-tree>../../training </decision-tree> //tree file for decision tree module <observed_window>4</observed_window> //the length of observed window </attributes>
</body>
Figure 3.9 Configuration file format
27
And the tree file gives the file directory in which the decision tree file locates. The attribute “observed window” gives the number of traffic signatures needed to form the evidence in traceback procedure.
3.2.3 N-hop
Sentinel
The n-hop sentinel stands for the router that our sentinel program resides in. The “n” represents the number of hops from the protection agent. Figure 3.10 gives an example.
Figure 3.10 N-hop sentinel
The main goal for sentinel is to aggregate the incoming packet into a simplified format of traffic signature for later traceback purpose and it also consists of some modules just like protection agent but simpler. There are four components within the sentinel: message manager, simplified packet aggregator, traffic-pattern matching module, and traffic signature repository. The simplified packet aggregator is the simpler version of the original packet aggregator in protection agent and it needs not to record as much information as the protection agent does. The overview of the sentinel is represented in Figure 3.11.
28
Figure 3.11 Modules in sentinel
Every packet passing through the sentinel would be collected and transformed into traffic signature. The format of simplified traffic signature is showed in Table 3.2.
Attributes
Value
1. # of incoming UDP packets per t min. Numeric 2. # of incoming ICMP packets per t min. Numeric 3. # of incoming TCP SYN packets per t min Numeric
Table 3.2 Format of simplified traffic signature
“# of incoming TCP SYN packets per t min” represents the number of incoming TCP SYN packets received after t minutes and the “t” is set to 1 as protection agent.
The operation in sentinel is to collect the packets and transforming them into traffic signature, then wait for the traceback command forwarded from downstream sentinel. While receiving a traceback command, the message manager would
29
identify the attack type which indicates which kind of attack was detected in protection agent and the traffic flow pattern matching module will perform the traffic pattern matching procedure to find the possible entrances of attack traffic. After identifying the suspicious entrances of attack traffic, the traffic flow pattern matching module would modify the traceback command, then forward the command to upstream sentinels and send back the link information to protection agent. The flow chart of the whole procedure is listed below and depicted in Figure 3.12.
1. Obtain the traffic signature from the traffic flow.
2. Upon receiving a traceback command, a sentinel modifies and forwards the command to upstream sentinels through the NICs(network interface cards) which are the possible entrances of attack traffic identified by the traffic-pattern matching module.
3. Send back the link information to protection agent.
The more detailed about traffic flow pattern matching procedure would be introduced in paragraph 3.4.
Figure 3.12 Operating flow chart in sentinel
3.3
DDoS Detection Phase
30
to assume that the attack traffic would be different from the normal traffic in some aspects. According to the heuristic assumption described above, we take this kind of DDoS attack detection into a problem of how to identify the traffic that which one is malicious or legitimate according to the traffic signature. Therefore, we build a base-line traffic profile from the normal network traffic. Whenever the network traffic deviates from the base-line profile significantly, an attack is alarmed. Nevertheless, the problem of how to analyze the relationship between attributes for normal and attack traffic and construct a classification model to identify is quite complex. We adopt a machine learning technique which is the process of extracting useful and previously unnoticed models or patterns from large data stores to solve the classification problem. There are four common machine learning techniques: “association rules learning”, “sequential patterns learning”, “clustering learning (unsupervised learning)” and “classification learning (supervised learning)”. To fit our design requirement, we are going to apply the “classification learning” in our system. Also, there are four kinds of methods for classification, which are “induction decision tree”, “Bayesian classification” and “back-propagation”. The most common applied technique is induction decision tree classifiers [22][23] and back-propagation ANN (artificial neural network)[24]. The basic requirement of our DDoS attack detection module is to detect the ongoing attack as soon as possible, the advantage of the decision-tree classifier is its efficiency in both generalization and new attack detection [25]. We adopt C4.5 [26][27] algorithm developed by J.R Quinlan to generate the desired decision tree from training data. The latest version of C serious is C5.0, but it’s not an open source software [28]. The basic idea is that the classification model could be expressed as a tree and C4.5 decision tree structure consists of leaf node indicating a class and non-leaf node that specifies test to be carried out on a single attribute value. A leaf node represents the result of a
31 classification as well. Figure 3.13 gives an example.
Packet count Byte counts There's no attack > 1000 <= 1000 There's no attack There's an attack > 10000 <=10000
: Non-leaf node (attribute) : leaf node (class)
Figure 3.13 Example of decision tree
The base-line profile is basically in the form of decision tree in Figure 3.13. The construction of decision tree is based on instances that are already known which classes they belong to beforehand. This kind of beforehand instances are called “training data”. Then the training data is feed into the C4.5 algorithm to construct the decision tree and predict the newly coming traffic signatures if there’s an attack. C4.5 chooses the attribute as non-terminal node by the entropy-based gain ratio to reduce the problem of over-fitting. First, it defines the info(T) as Equation 3.1. info(T) represents the entropy of the training data set T.
info(T) = ⎟⎟ ⎠ ⎞ ⎜ ⎜ ⎝ ⎛ × −
∑
= T T C freq T T C freq j k j j, ) log ( , ) ( 2 1 ( 3.1 ) Where T T C freq( j, )represents the probability that one random instance from a set T belongs to class Cj (there are four classes in our system: Normal, TCP SYN attack, UDP attack, and ICMP attack and one traffic signature aggregated per 1 minute would be considered as one instance in our system). Then the gain information for an attribute or test is defined as Equation 3.2. gain(X) measures the quantity of information that is gained by partitioning T according to the attribute X.
32 ) (X gain = info(T)
∑
= × − n i i T T 1 info(Ti) ( 3.2 )Where Ti is represents the number of instances was assigned to a specific class.
Then define the gain ratio as ( 3.3.
∑
= × − = n i i i T T T T X gain X ratio gain 1 2( ) log ) ( ) ( _ ( 3.3 )According to the gain ratio, we could choose the attributes with the most gain ratio to be the non-terminal node in decision tree. Therefore the whole tree construction procedure could be summarized as following:
1. select attribute with highest gain ratio as root node, and create a branch for each possible attribute value.
2. divide instances(i.e. each row is an instance) into subsets. 3. repeat steps 1 and 2 for each branch.
In our system, we define four classes which are ---Normal, TCP SYN flooding, UDP flooding, ICMP flooding--- as leaf nodes and the predefined traffic signature listed as Table 3.1 as attributes(non-leaf nodes) in decision tree structure, respectively. And we have to aggregate the packets into traffic signature flows under normal situation without attack in the form of Table 3.1 and classify them into class “Normal” and the attack traffic signatures. After the inductive learning and pruning, the decision tree could then classify the newly incoming traffic flow into class and determine if the malicious attack was launched by the classification model. The scenario of this whole picture is at Figure 3.14.
33
Figure 3.14 DDoS detection scenario
3.4
Traceback Phase
When the protection agent detects an ongoing attack, then it would raise an alarm and traceback module starts the traceback procedure. Because the attacker would modify the source IP address while sending out the malicious packets toward victim to hide its real IP address and prevent from being traced. Therefore it makes the source IP address of packets not to be trusted and increases the difficulty while tracking down the attacker. Due to this circumstance, we are going to apply the traffic flow pattern matching with logging mechanism and there’s no need to take the IP address into account. In our system, we refer to the concept of traffic flow pattern introduced in [29] and solve the weakness of correlation coefficient while dealing with the small sample size with the help of grey relational analysis. The concept in the traffic flow pattern matching could be divided into two parts: “trend-pattern matching” and
34
“volume-pattern matching”. The work of traffic flow pattern matching was done in sentinels and the protection agent collects the attack link information forwarded from the sentinels and constructs the attack paths according to these received attack link information.
3.4.1 Attack Edge Determination
When a DDoS attack was detected, the traceback module will wait for sentinels to aggregate the traffic signatures. Then the traceback module puts the attack traffic signatures aggregated during the attack and the timestamp when the attack was detected into the traceback command (see Table 3.3).
Fields Description
Time stamp The time when attack was detected
Observed window The number of traffic signature used in pattern matching Distance The number of hops from protection agent
IP address The address of NIC which forwards the command
Type of attack Attack type detected by protection agent ({TCP SYN, UDP, ICMP }flooding attack )
Attack evidence sequences Sequences of traffic signature aggregated during attack (the length is defined by observed window)
Table 3.3 Format of traceback command
The traceback module in the protection agent issues a traceback command to the upstream sentinel, which is referred to as the 1-hop sentinel. When the 1-hop sentinel receives the traceback command, it searches the traffic signature repository for every network interface card (NIC) to retrieve the traffic signatures with the appropriate attack type and the aggregated timestamp that matches the timestamp in the traceback command. Afterwards, the sentinel applies the traffic-flow pattern matching algorithm to identify the set of NICs that are the possible entrances the attack traffic may come
35
from. If a router is equipped with n network interface cards, there will be 2n-2 different combinations (the two cases—no NIC and all NICs—are ignored). And if n = 1, then this only one NIC will be considered as the entrance of attack traffic. After identifying the suspicious entrances of the attack traffic, the sentinel would send the connection information (which includes IP addresses of the two ends of the link and their distances from victim, see Figure 3.15) to the protection agent through a SSH tunnel.
Edge_info_t {
int distance; //represents the hop counts from the victim char start_ip[20]; //the start IP address of the edge
char end_ip[20]; //the end IP address of the edge
};
Figure 3.15 Structure of link information
After sending back the link information to protection agent, the sentinel puts the traffic signatures aggregated by the suspicious NIC into the command as new evidence, fill the IP address of suspicious NIC into the “ip” field and increment the “distance” field, then forwards this command to the upstream sentinel through the suspicious NIC. When the upstream sentinel receives the traceback command, it processes the whole procedure recursively until the edge sentinels are reached or the defined termination condition is satisfied (see paragraph 3.4.3). Figure 3.16 illustrates the algorithm of the edge of attack path sampling.
Modified edge sampling
find the set of NICs whose traffic closet to the evidence in command; If command.ip == NULL then
fill the IP address of suspicious NICs in the “ip” field of command; else then
36
edge_info.end_ip = ip address of suspicious NIC; edge_info.distance = command.distance + 1; send edge_info back to protection agent; endif
command.start = ip address of suspicious NIC; increament the command.distance;
fill the traffic through suspicious NICs into the “evidence” field as new evidence; forward new_command through the suspicious NICs;
Figure 3.16 Algorithm of attack edge sampling
Protection agent could reconstruct the attack paths by the received link information. Figure 3.17 gives an example of link information and the format will be: (start IP address)ÅÆ(end IP address) : distances. Therefore the protection agent could receive the edge that the attack traffic might pass through.
Figure 3.17 Example of link information
3.4.2 Traffic Flow Pattern Matching
In a DDoS attack, the attack traffic enters the network from multiple routers and flows to a single victim. The communication links that the attack traffic passes through form a tree (under normal routing) with the victim as the root and the entrances as the leaves. Our traceback method starts from the victim and identify the routers on the tree
37
one by one. Each sentinel will find the upstream routers on the tree.
The major problem in our traceback method lies in identifying the upstream routers of attack traffic in the sentinels. Therefore, the aim of traffic-flow pattern matching is to identify the subset of NICs on a router whose collective incoming traffic has similar signature as the attack traffic that goes out of that router. We apply two kinds of pattern matching techniques which measure both the trend and the volume of network traffic.
3.4.2.1 Trend - Pattern Matching
In trend-pattern matching, the foundation is the assumption that “the DDoS attack should dominate the changes in outgoing traffic”. Therefore we intend to identify the entrances of attack traffic by finding the sets of NICs whose aggregated traffic signatures are similar to the outgoing traffic according to the variation in developing degree, speed, and direction. Hence, the problem is turned into how to describe the developing trend quantitatively and determine if they are similar as the question in Figure 3.18.
1 2 3 4 5 6 x k x1 x2 x3 Ex : Referenced sequence : X1 Comparative sequences : X2, X3
Which of X2and X3influences X1
the most?
Figure 3.18 Example of the similarity problem
Unlike other system which achieves the comparison of traffic signature with the conventional statistic method [29] and the statistic method couldn’t fit our requirements because it favors the major sample space instead of small sample space and is easily affected by the extreme value. Therefore we applied GRA(Grey Relational Analysis) a novel kind of method to analyze the correlation degree between factors to achieve our
38
goal. This theorem is introduced in grey system theory proposed by J. L. Deng [30][31] at 1989. GRA could overcome the weakness of conventional statistic method by analyzing the relation between factors from a small amount of data set. Because the concern of the efficiency in traceback, the value of observed window was always a small number and restricts us to process under a small sample space. Therefore the GRA could satisfy our need and achieve the relational comparison in less effort within a large number of NICs. There are three steps needed to be preprocessed before we analyze the similarity, which are:
1. Grey relational generating operation 2. Grey relational coefficients computation 3. Grey relational grade computation
First, we compute the sequences through the process of grey relational generating operation depicted from Equation 3.4 to Equation 3.8 we applied the “maximizing operation”. The purpose of the generating operation is to diminish the magnitude of sequences and make them comparable.
z Initializing operation ) 1 ( ) ( ) ( x k x k y = ( 3.4 ) z Averaging operation avg x k x k y( )= ( ) ( 3.5 ) z Maximizing operation max ) ( ) ( x k x k y = ( 3.6 ) z Minimizing operation min ) ( ) ( x k x k y = ( 3.7 ) z Intervalizing operation
51 min max min ) ( ) ( x x x k x k y − − = ( 3.8 )
Where original sequence x= {x(1), x(2),…, x(n)} and generated sequence y= {y(1), y(2),…, y(n)}. After processing the generating operation above, the sequences have become comparable and could be computed the grey relational coefficients by Equation 3.9. ⎟⎟ ⎠ ⎞ ⎜⎜ ⎝ ⎛ Δ + Δ Δ + Δ = max max min 0 ) ( )) ( ), ( (
ζ
ζ
k k y k y r oi i ( 3.9 )Where the referenced sequence : y0 = {y0(1), y0(2),…, y0(n)} and comparative sequence :
y1 = {y1(1), y1(2),…, y1(n)}. ζ∈(0,1), Δ0i(k) = | y0(k) – yi(k) | : the absolute value of
difference between referenced series and compared series. And
)
(
)
(
min
min
)
(
min
min
0 0 mink
y
k
y
ik
k i i k iΔ
=
−
=
Δ
∀ ∀ ∀ ∀)
(
)
(
max
max
)
(
max
max
0 0 maxk
y
k
y
ik
k i i k iΔ
=
−
=
Δ
∀ ∀ ∀ ∀ζis a parameter and can be adjusted to any value. The main purpose of is to adjust ζ the ratio between Δ0ii and max. Therefore the value ofΔ ζ could directly affect the
value of grey relational coefficient. But the grey relational order will stand the same and not be affected by the adjusting of ζ. The default value of ζ recommended as 0.5. is The smaller the ζ is, the smaller range that the grey relational coefficient will distribute within and vice versa. After the computation of grey relational coefficient, Equation 3.10 depicts the grey relational grade computation:
∑
==
m k i k ir
y
k
y
k
y
y
r
1 0 0,
)
(
(
),
(
))
(
β
( 3.10 )Where βk: weighted-value, and
∑
= = m k k 1 1β
. Generally, βk denotes as m k 1 = β52
After computing the grey relational grades for the comparative sequences, the magnitude of relation between referenced sequence and comparative sequences could be ranked according to the computed grades. The above traditional grey relational analysis operation emphasizes on the ordinal analysis. But we not only concern the rank of the relations but also the computed weighted grey relational grades of every comparative sequence. Therefore, we apply the modified grey relational grade computation proposed by Chen and Hsia [32], which emphasizes and enhances the cardinal of the grey relational grade. It combines the grey relational coefficient and grade computation as Equation 3.11. Because different zeta could result in different grey relational grade, therefore the modified approach sets the value of zeta as 1 without exception to diminish the variance with different zeta value by this unifying.
⎟⎟ ⎠ ⎞ ⎜⎜ ⎝ ⎛ Δ − Δ Δ − Δ = min max max 0, ) ( oi i y y r ( 3.11 ) Where
∑
= Δ = Δ n k oi oi k n 1 ) (1 , according to the grey relational analysis described above,
we could determine which set of NICs has the most similarity to the outgoing attack traffic. For example: if we assume attack traffic sequence: y0 = {y0(1), y0(2), …, y0(n)} as the
outgoing attack traffic and traffic signatures from NIC set no.1: y1 = {y1(1), y1(2), …, y1(n)},
no.2: y2 = {y2(1), y2(2),…, y2(n)} as two possible sets of NICs. If r(y0,y1) > r(y1,y2), we could
make a conclusion that y1 is more similar to y0 than y2in developing trend, which means
if y0 is an attack traffic, then it’s high probability that the attack traffic flowed and passed
through the interface who aggregated y1.
3.4.2.2 Volume - Pattern Matching
53
legitimate traffic flow reflects the similarity to outgoing traffic. The degree in volume is needed to be considered. The volume of DDoS attack traffic flowing into a router should be close to the volume of traffic flowing out of the router, which means the Va in
Figure 3.19 of traffic which passed through the entrances of attack traffic should be close to the one of outgoing traffic flow.
Figure 3.19 Example of traffic pattern
Therefore volume-pattern matching is used to complement the insufficiency in trend-pattern matching. Because the geometric mean is less influenced by extreme value than arithmetic mean, therefore we apply the geometric mean ratio to help us measure the degree of volume matching.
∑
∑
= = ⋅ n k n k i k x k x k x 1 0 1 0 ) ( ) ( ) ( ( 3.12 )Where attack traffic sequence: X0= {X0(1), X0(2), …, X0(n)} and traffic signatures
from NICs set i: Xi = {Xi(1), Xi(2), …, Xi(n)}.
3.4.3
Traceback Command Forward Policy
The grade r(y0, yi) represents the similarity in shape of the two sequences y0 and yi
54
When the grade r(y0, yi) is greater than a selected threshold Ttrend, we claim that the two
sequences have the same shape. Similarly, when the volume coefficient gi is greater than
a certain threshold Tvol, we claim that two sequences have the same volume. In our
system, we use Ttrend = 0.8 and Tvol = 0.9. This would reduce the false positive/negative
ratios in our experiment.
We consider only the sequences xi for which r(y0, yi)> Ttrend and gi > Tvol. Among
these sequences, we choose the sequence with the largest r(y0, yi). The subsets of NICs
corresponding to the chosen sequence are deemed as the entrances for the attack traffic to enter the router. When there is no sequence for which gi > Tvol, we claim that all the
NICs are the entrances for the attack traffic to enter the router. Otherwise, the router is not on the attack path and the sentinel on the router will stop forwarding the traceback command.
![Figure 1.1 Classification of DoS (cited from [5])](https://thumb-ap.123doks.com/thumbv2/9libinfo/8473221.183627/13.892.169.753.469.970/figure-classification-dos-cited.webp)

![Figure 2.1 Diagram of back-propagation ANN(cited from [10])](https://thumb-ap.123doks.com/thumbv2/9libinfo/8473221.183627/23.892.206.733.198.782/figure-diagram-propagation-ann-cited.webp)