骨與植體接觸百分比對人工牙根植體穩定度影響
The Effect of Bone-Implant Contact Percentage on the Initial Stability
of the Dental Implant
許瑞廷
Jui-Ting Hsu
1, 黃恆立Heng-Li Huang
1, 蘇國誌Kuo-Chih Su
2,張志涵
Chih-Han Chang
2, 蔡明慈Ming-Tzu Tsai
3*1 中國醫藥大學牙醫學系School of Dentistry, China Medical University and Hospital
2國力成功大學醫學工程研究所Institute of Biomedical Engineering, National Cheng Kung University 3弘光科技大學生物醫學工程學系Department of Biomedical Engineering, HungKuang University
* Corresponding Email: Ming-Tzu Tsai, [email protected] 1. 中文摘要 本研究目標為探討人工牙根植體初期穩定 度和骨與植體介面狀態之相關性。本研究將人工 牙根植體植入四種不同強度的人造假骨,並取得 其利用高解析度電腦斷層掃瞄影像。利用醫學影 像 軟 體 計 算 二 維 和 三 維 的 骨 與 植 體 接 觸 百 分 比。實驗結果顯示,增加人造假骨的彈性係數可 以增加人工牙根植體的初期穩定度。人工牙根初 期穩定度與二維和三維骨與植體接觸百分比的 相關性分別為0.48 與 0.86。 關鍵詞:初期穩定度、骨與植體接觸、高解析度 電腦斷層掃瞄 Abstract
The objective of this study was to determine the correlation between the initial stability of a dental implant, as quantified by the implant stability quotient (ISQ), and the bone–implant contact percentage (BIC%). Dental implants were inserted into specimens comprising artificial cortical shell and artificial cancellous foam bone with four elastic moduli. Each artificial foam bone specimen with an implant was subjected to micro-computed tomography (CT) scanning, from which the 2D and 3D BIC% values were calculated. Pearson’s correlation coefficients (r) between the ISQ and the 2D and 3D BIC% were calculated. Increasing the elasticity of the specimen reduced the ISQ. There were statistically significant correlations between the initial implant stability, as quantified by the ISQ, and the 2D and 3D BIC% values (r=0.48 and r=0.86, respectively).
Keywords: Initial implant stability, bone–implant contact; micro-computed tomography
2. Introduction
The dental implant is now becoming a popular treatment to replace missing teeth. The initial stability of an implant immediately after it is inserted into the alveolar bone is one of the most important factors influencing the survival rate 1-3. A
higher implant initial stability can result in more bone ingrowth into the implant surface, producing better osseointegration and a higher success rate. Many factors affect the initial stability of implant, including the surgical technique, the geometry and surface treatment of the implant, and the quality and quantity of the host bone. No method for directly measuring the relative movement at the bone–implant interface level. Histomorphometric evaluation of the bone–implant interface provides information about the condition of the implant anchorage in peri-implant bone, but such approaches can only be used in animal studies. Resonance frequency analysis (RFA), which was introduced by Meredith et al. 4, can measure the
initial stability of an implant in a nondestructive manner. The alveolar bone comprises the inner cancellous bone and outer cortical shell. The implant stability is theoretically affected by the bone–implant contact (BIC) area, however, Ito et al.
5 indicated that there was no significant correlation
between RFA measurements and BIC based on animal and human cadaver studies, respectively. The objective of the present study was to use high-resolution micro-computed tomography (micro-CT) to determine the relation between the initial stability, as measured by RFA, and the BIC percentage (BIC%) obtained using both 2D and 3D approaches.
3. Materials and Methods
(1) Specimen Preparation
Four cellular rigid polyurethane foam blocks (Sawbones, Vashon, WA, USA) representing cancellous bone with elastic moduli of 137 MPa (Group 1), 47.5 MPa (Group 2), 23 MPa (Group 3), and 12.4 MPa (Group 4) were attached to a 2-mm-thick synthetic cortical shell with an elastic
modulus of 16.7 GPa (Figure 1a). A commercial dental implant (4 mm in diameter and 12 mm long; ATLAS Implant System, Cowell Medi, Busan, South Korea) was used as the target dental implant in this study(Figure 1b).
Figure 1. (a) Models of artificial foam bone
with inserted implant used in the experiments.
(b) The implant used in this study, showing the
connection of the Osstell
TMtransducer.
(2) Measurement of Initial Implant Stability
Before measuring BIC%, the OsstellTM
resonance frequency analyzer (Osstell, Göteborg, Sweden) was used to measure the initial implant stability. The resonance frequency of the abutment–implant system was assigned a value between 0 and 100 to represent the implant stability quotient (ISQ), where a larger ISQ indicates a higher stability.
(3) Measurement of Bone–Implant Contact Percentage
For calculating the 3D BIC%, micro-CT (SkyScan-1076, Skyscan, Aartselaar, Belgium) was used to obtain the 3D information of each specimen. The micro-CT images of each specimen with an implant were imported into professional medical imaging software and then segmented using different thresholds for implant and bone (Figure 2). Furthermore, the 3D BIC% and 2D BIC% were obtained by the software.
Figure 2. (a) Foam bone specimen (Group 2)
with an implant. (b) Three-dimensional (3D)
computer model of the foam bone with an
implant (internal view). (c) Model of the
implant. (d) Foam bone with an implant
(4) Statistical Analysis
The values of ISQ and BIC% obtained from
2D and 3D measurements of the implants in the four elasticity groups of artificial foam bones were summarized as mean±SD (standard deviation) values, with differences between them tested using one-way analysis of variance. Pearson’s correlation coefficients were used to evaluate whether there was a statistically significant correlation between ISQ and BIC% obtained from 2D and 3D measurements. The level of significance was determined as P<0.05.
4. Results and Discussion
Implant Stability Quotient
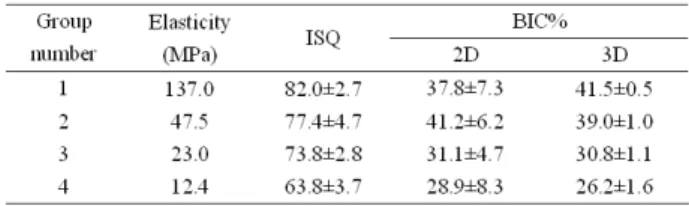
The ISQ values of the implants in the four groups are listed in the Table 1. The mean value of the ISQ in the four density groups ranged between 63.8 and 82.0, and was higher in stiffer foam bone specimens (i.e., those with higher elasticity or density). However, the difference between Groups 2 (77.4±4.7) and 3 (73.8±2.8) was not statistical significant.
Table 1. Implant stability quotient (ISQ) and
bone–implant contact percentage (BIC%)
values of artificial jawbone specimens.
Bone–Implant Contact Percentage
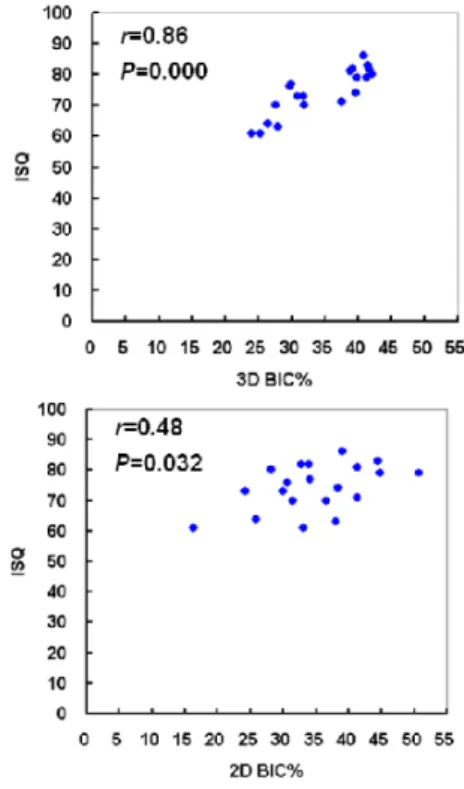
The mean ranges of BIC% values for the 2D and 3D measurements were 28.9–41.2% and 26.2–41.5%, respectively (Table 1). The 3D BIC% was higher in foam bone specimens with a higher elasticity, and the mean 2D BIC% did not differ significantly between Groups 2 (41.2%) and 1 (37.8%). In addition, the SD was much lower for 3D BIC% measurements than for 2D BIC% measurements. Pearson’s correlation coefficient was 0.86 between the ISQ and 3D BIC% (P<0.0001), indicating a strongly positive correlation, and was 0.48 between the ISQ and 2D BIC% (P=0.032), indicating a moderate positive correlation (Figure 3).
Figure 3. Scatterplots illustrating the
correlation between ISQ and BIC% obtained
from 3D measurements (up) and
two-dimensional (2D) measurements (down).
5. Conclusion
The obtained experimental results indicate that the ISQ decreases as the elasticity of the specimen increases. The initial implant stability, quantified as the ISQ, was moderately positively correlated (r=0.48) with the 2D BIC% and strongly positively correlated (r=0.86) with the 3D BIC%. Measuring the 3D BIC% using micro-CT supplements 2D histological analyses of the BIC.
6. References
[1] Huang HL, Fuh LJ, Tu MG, Hsu JT (2010). J
Med Biol Eng, 30:85-9.
[2] Huang HL, Chang YY, Lin DJ, Li YF, Chen KT, Hsu JT. Initial stability and bone strain evaluation of the immediately loaded dental implant: an in vitro model study. Clin Oral Implants Res. Online publication
[3] Seong WJ, Conrad HJ, Hinrichs JE (2009) J
Periodontol, 80:1868-74.
[4] Meredith N, Book K, Friberg B, Jemt T, Sennerby L (1997) Clin Oral Implants Res, 8:226-33.
[5] Ito Y, Sato D, Yoneda S, Ito D, Kondo H, Kasugai S (2008) Clin Oral Implants Res,