With 7-aminoflunitrazepam-specific ELISAs now readily available from several commercial sources (e.g., Cozart Bioscience: Abingdon, Oxfordshire, UK; Immunalysis: San Dimas, CA), this study was conducted to evaluate the performance characteristics of these products when applied to the 2-step testing protocol as commonly practiced in today’s workplace drug testing programs. Cross-reacting characteristics of these two assays toward a list of 25 benzodiazepines were evaluated. These assays were then applied to the analysis of urine specimens collected from patients treated with flunitrazepam (FM2) and/or other benzodiazepines. Resulting data were evaluated against gas chromatography–mass spectrometry (GC–MS) test data to ascertain corresponding cutoffs suitable for the two-step immunoassay/GC–MS testing strategy. Both Cozart and Immunalysis ELISAs are highly specific to 7-aminoflunitrazepam (7-amino-FM2), with the latter reagent generating slightly higher responses. Diazepam and FM2 (parent compound) are the only compounds with significant cross-reacting characteristics. With the ELISA reagents’ optimal dynamic ranges set between 0–25 ng/mL, urine specimens should be diluted by a factor of 5 prior to ELISA testing. If 30 ng/mL 7-amino-FM2 is adapted as the GC–MS cutoff, the corresponding ELISA cutoffs range is approximately 100–200 (or 20–40 when diluted by a factor of 5) ng/mL. Reagent lot and specimen characteristics (with or without the presence of cross-reacting compounds) affect the correlation of data derived from ELISA and GC–MS tests.
Introduction
Flunitrazepam (FM2) is extensively used for treating insomnia in many parts of the world. It has been associated with drug-assisted sexual assault cases (1,2) and is also one of the ben-zodiazepines that may affect human’s
perfor-mance and behavior (3). Earlier studies (4,5) have demon-strated that conventional immunoassays (IA) for benzodi-azepines were not effectively for the two-step IA/gas chro-matography–mass spectrometry (GC–MS) testing protocols adapted for the high-volume testing environment. One of these studies (5) has also demonstrated that 7-aminoflunitrazepam (7-amino-FM2) specific enzyme-linked immunosorbent assay (ELISA) by Cozart Bioscience (Oxfordshire, UK) can be effective under this testing environment.
More recently, 7-amino-FM2-specific ELISAs from other sources have become available. This study has been conducted to (i) provide a broader understanding on the cross-reacting characteristics of these reagents toward a comprehensive list of benzodiazepines; (ii) compare the performance characteristics of these ELISAs, especially in relating the ELISA’s apparent 7-amino-FM2 concentrations to the definite concentrations of 7-amino-FM2 as determined by GC–MS; and (iii) understand the characteristics of data derived from urine specimens col-lected from patients under the treatment of FM2 (with or without diazepam) or other benzodiazepines.
Materials and Methods
Reagents, standards, and specimens
ELISA kits, Flunitrazepam Metabolite Micro-Plate EIA— Abstract
Performance Characteristics of 7-Aminoflunitrazepam
Specific Enzyme-Linked Immunosorbent Assays
Dong-Liang Lin1, Rea-Ming Yin1, Cheng-Hsing Chen2, Ya-Lei Chen3,*, and Ray H. Liu3
1Institute of Forensic Medicine, Ministry of Justice, Taipei, Taiwan; 2Ping-An Hospital, Pingtung Hsien, Taiwan; and 3Department
of Medical Technology, Fooyin University, Kaohsiung Hsien, Taiwan
Technical Note
* Author to whom correspondence should be addressed: Dr. Ya-Lei Chen, Chair, Dept. of Medical Technology, Fooyin University, 151 Ching-Hsueh Road, Ta-Liao Hsiang, Kaohsiung Hsien 831, Taiwan.
Urine Application (M185U5, June 2002) and Flunitrazepam Di-rect ELISA Kit (216-0480, Ver: 08/2000) were purchased from Cozart Bioscience (Abingdon, Oxfordshire, UK) and
Immunal-ysis (San Dimas, CA). Standards (in 1 or 0.1 µg/mL methanolic solutions), including the analyte (7-amino-FM2), internal stan-dard (7-amino-FM2-d7), and other benzodi-azepines for cross-reactivity studies were pur-chased from Cerilliant (Austin, TX).
All clinical urine specimens were from pa-tients admitted to Pin-Ann hospital (Pin-Tong, Taiwan) and were collected by a staff nurse following a procedure established by the hospital. Fooyin University IRB proce-dure exempts urine specimen collection through non-invasive means. Specimens in Groups A (n = 13), B (n = 13), and C (n = 9) were from patients treated with other benzo-diazepines, such as lorazepam, alprazolam, and clonazepam (without FM2 or diazepam), FM2 (without diazepam), and FM2 plus di-azepam, respectively. All specimens were kept at 4∞C until analysis.
ELISAs
Assay procedures provided by respectively ELISA manufactures were followed. Dose-re-sponse calibrations were established using 5 standards (0, 5, 10, 12.5, and 25 ng/mL) pro-vided by the manufacturers (or diluted from the standards provided by the manufacturers). For cross-reactivity studies, standards were diluted to preset concentrations and tested. The observed concentrations were then di-vided by the theoretical concentrations to de-rive the tests compounds’ cross-reactivity characteristics toward the test reagents. For the assay of clinical specimens, all specimens were diluted with drug-free urine by a factor of 5 prior to testing.
GC–MS analysis
Urine specimens were adjusted to pH 9.0 (Na2CO3/NaHCO3buffer) and extracted with ethyl acetate. 7-Amino-FM2 in the dried extract was then converted to its TMS-deriva-tive using N-methyl-N-(trimethylsilyl)triflu-oroacetamide as the derivatization reagent (5).
An Agilent 6890 GC/5973N mass selective detector (MSD) (GC–MS) system was used for this study. The GC was equipped with a 30-m Hewlett-Packard (Andover, MA) 5MS fused silica capillary column (mm i.d.; 0.25-µm film thickness). The injector and interface temperature were maintained at 260 and 280°C, respectively. Oven temperature was held at 150°C for 1 min, then programmed to 300°C at 20°C/min, and held at the final tem-perature for 1 min. The following parameters were used for injecting samples into the Table I. Cross-Reactivities (%) of 7-Aminoflunitrazepam-Specific ELISAs
toward Benzodiazepines and Their Metabolites
Substance and Cozart Immunalysis
Conc. (ng/mL) Manufacturer* Experimental† Manufacturer‡ Experimental†
Diazepam 12 (85) 10 —§ 11 — 13 100 7 9.0 — 9.9 1000 > 2.5 4.3 — 2.2 10000 > 0.25 0.63 — 0.55 Flunitrazepam 83 (12) 5 < 20 18 — 34 10 13 13 — 18 25 16 17 — — 50 16 19 — 16 100 20 18 — 13 250 > 10 — — — 500 — 9.1 — 6.9 1000 — 5.4 — 1.5 10000 — 0.71 — 0.61 7-Aminonitrazepam — 0.07 (1000) — 1.9, 0.30 (100, 1000) a-OH-Alprazolam — ND§ — ND 7-Aminoclonazepam — 0.32 (250) — 1.1 (250) Alprazolam — ND, 0.02 < 1 2.1, 0.09 a-OH-Alprazolam — — < 1 — Bromazepam — ND < 1 ND, 0.01 Chlordiazepoxide — ND < 1 ND Clonazepam — ND, 0.06 2.0 (500) 0.57, 0.14 Clorazepate — — <1 — Desalkylflurazepam — ND — 0.3 (1000) Estazolam — ND, 0.03 — 0.40, 0.07 Flurazepam — ND < 1 2.0, ND (100, 10000) Halazepam — — < 1 — Lorazepam <0.01 ND < 1 1.9, 0.01 (250, 1000) Medazepam — ND < 1 ND a-OH-Medazepam — ND <1 0.28, 0.17 (500, 1000) Nitrazepam 0.09 ND, 0.02 1.1 (900) 1.8, 0.09 (100, 1000) Nordiazepam 0.12 ND, 0.02 1.25 (800) 0.24, 0.06 Oxazepam <0.01 ND < 1 ND, 0.01 Prazepam <0.01 ND < 1 ND, 0.01 Tempazepam 0.07 ND < 1 0.23, 0.02 Triazolam 0.05 ND, 0.03 1.33 (750) 0.28, 0.04 a-OH-Triazolam — ND — ND
* Data taken from reagent package insert. These data were obtained using 10,000 ng/mL of the drugs evaluated.
†Unless indicated, cross-reactivities were evaluated at two (500 and 10,000 ng/mL) concentration levels. ‡Data taken from reagent package insert. Cross-reactivities were evaluated by increasing the amount of the
test drug to a concentration (shown inside parentheses) that generated the same response as 10 ng/mL of 7-amino-FM2. The highest concentration evaluated was 1000 ng/mL.
GC–MSD system: sample size, 2 µL; injection mode, splitless; injector purge-off duration, 1 min.
Mass range adapted for collecting full-scan mass spectra was
m/z 50–550. Typical mass spectra of the analyte and the internal
standards are shown in Figure 1. Based on ion intensity data of full-scan mass spectra, the following ions were evaluated and adapted to designate TMS-derivatized analyte and internal stan-dard: m/z 355, 327, 326 (for 7-amino-FM2); and 362, 334, 333 (for 7-amino-FM2-d7). The first ion listed for each compound was used for quantitation using a five-point (10, 25, 50, 100, 200
ng/mL) calibration protocol.
Similar procedures were used for quantitative determina-tions of diazepam, nordiazepam, oxazepam, and temazepam. Qualitative determinations of other compounds (ambroxol, bro-mazepam-M, carbamazepine-M, clotiapine, cyproheptadine, lev-orphanol, lorazepam, naloxone, nitrendipine-M, and propanolol) were mainly based on the comparisons with the mass spectra collected in authors’ laboratories, provided in the GC–MS system’s library, or those included in literature mass spectra references.
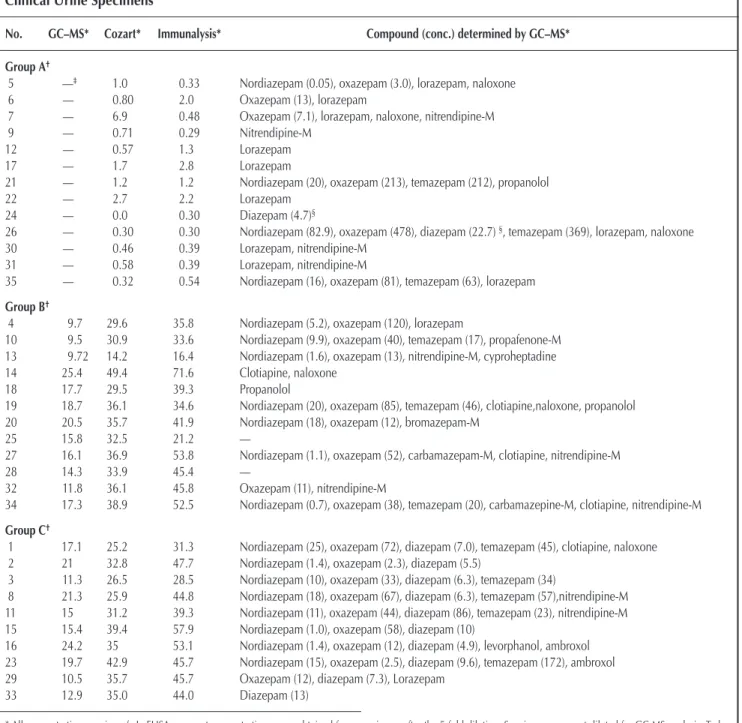
Table II. ELISA and GC–MS Test Data of the Three Groups of Clinical Urine Specimens
No. GC–MS* Cozart* Immunalysis* Compound (conc.) determined by GC–MS* Group A†
5 —‡ 1.0 0.33 Nordiazepam (0.05), oxazepam (3.0), lorazepam, naloxone
6 — 0.80 2.0 Oxazepam (13), lorazepam
7 — 6.9 0.48 Oxazepam (7.1), lorazepam, naloxone, nitrendipine-M
9 — 0.71 0.29 Nitrendipine-M
12 — 0.57 1.3 Lorazepam
17 — 1.7 2.8 Lorazepam
21 — 1.2 1.2 Nordiazepam (20), oxazepam (213), temazepam (212), propanolol
22 — 2.7 2.2 Lorazepam
24 — 0.0 0.30 Diazepam (4.7)§
26 — 0.30 0.30 Nordiazepam (82.9), oxazepam (478), diazepam (22.7) §, temazepam (369), lorazepam, naloxone
30 — 0.46 0.39 Lorazepam, nitrendipine-M
31 — 0.58 0.39 Lorazepam, nitrendipine-M
35 — 0.32 0.54 Nordiazepam (16), oxazepam (81), temazepam (63), lorazepam
Group B†
4 9.7 29.6 35.8 Nordiazepam (5.2), oxazepam (120), lorazepam
10 9.5 30.9 33.6 Nordiazepam (9.9), oxazepam (40), temazepam (17), propafenone-M 13 9.72 14.2 16.4 Nordiazepam (1.6), oxazepam (13), nitrendipine-M, cyproheptadine 14 25.4 49.4 71.6 Clotiapine, naloxone
18 17.7 29.5 39.3 Propanolol
19 18.7 36.1 34.6 Nordiazepam (20), oxazepam (85), temazepam (46), clotiapine,naloxone, propanolol 20 20.5 35.7 41.9 Nordiazepam (18), oxazepam (12), bromazepam-M
25 15.8 32.5 21.2 —
27 16.1 36.9 53.8 Nordiazepam (1.1), oxazepam (52), carbamazepam-M, clotiapine, nitrendipine-M
28 14.3 33.9 45.4 —
32 11.8 36.1 45.8 Oxazepam (11), nitrendipine-M
34 17.3 38.9 52.5 Nordiazepam (0.7), oxazepam (38), temazepam (20), carbamazepine-M, clotiapine, nitrendipine-M
Group C†
1 17.1 25.2 31.3 Nordiazepam (25), oxazepam (72), diazepam (7.0), temazepam (45), clotiapine, naloxone 2 21 32.8 47.7 Nordiazepam (1.4), oxazepam (2.3), diazepam (5.5)
3 11.3 26.5 28.5 Nordiazepam (10), oxazepam (33), diazepam (6.3), temazepam (34)
8 21.3 25.9 44.8 Nordiazepam (18), oxazepam (67), diazepam (6.3), temazepam (57),nitrendipine-M 11 15 31.2 39.3 Nordiazepam (11), oxazepam (44), diazepam (86), temazepam (23), nitrendipine-M 15 15.4 39.4 57.9 Nordiazepam (1.0), oxazepam (58), diazepam (10)
16 24.2 35 53.1 Nordiazepam (1.4), oxazepam (12), diazepam (4.9), levorphanol, ambroxol 23 19.7 42.9 45.7 Nordiazepam (15), oxazepam (2.5), diazepam (9.6), temazepam (172), ambroxol 29 10.5 35.7 45.7 Oxazepam (12), diazepam (7.3), Lorazepam
33 12.9 35.0 44.0 Diazepam (13)
* All concentrations are in ng/mL. ELISA apparent concentrations were obtained from specimens after the 5-fold dilution. Specimens were not diluted for GC-MS analysis. To be consistent with the ELISA data, raw data derived from GC-MS analysis were divided by a factor of 5 and listed in this table.
†Group A: specimens collected from patients without the ingestion of flunitrazepam or diazepam; Group B: specimens collected from patients with flunitrazepam (but not
diazepam) treatment; Group C: specimens from patients with flunitrazepam (plus diazepam) treatment.
‡Below the limit of detection.
Evaluation of analytical parameters
Analytical parameters that have been critically evaluated in-clude extraction recovery, precision/accuracy, linear range, and limits of detection (LOD) and quantitation (LOQ). To evaluate the efficiency of the extraction procedure, one set of drug-free urine was spiked with known amounts of 7-amino-FM2 (10, 25, 50, 100, 200 ng/mL) without the internal standard. Each step in the extraction process was carefully performed to avoid loss of the analyte. 50 µL of the internal standard (2 µg/mL in methanol) was added to each of these extracts and to another set of standards containing the same corresponding amounts of 7-amino-FM2 in methanol (prepared by pipetting appropriate amounts of 2 µg/mL methanolic stock solution). Samples in both sets were evaporated to dryness at 50°C under a stream of
nitrogen. The analyte and the internal standard in the residue were then derivatized, and the products were analyzed by GC–MS.
The same procedure used to prepare the first set of standards for the recovery study was used to prepare the standards for the evaluation of the analytical protocol’s precision, accuracy and linearity and the LOD and LOQ. The concentrations of the stan-dards used for LOD and LOQ study were: 10, 5.0, 2.5, 2.0, 1.0, 0.50, 0.25, and 0.10 ng/mL.
Results and Discussion
ELISA cross-reacting characteristics
A list of 25 benzodiazepines/metabolites was included to determine these compounds’ cross-reacting characteristics toward the ELISAs in-cluded in this study. The observed cross-reac-tivity data are shown in Table I. These data represent the most comprehensive informa-tion available and should be of reference value to operational laboratories.
Data derived from this study are comparable to those (when available) provided by the man-ufactures (see Table I). These data also indicate Immunalysis reagent appears to have slightly higher cross-reacting characteristics than Cozart reagent. These data are comparable with those limited data provided the manufacturers. Clinical urine specimens, collected from pa-tients treated with benzodiazepines other than FM2 and di-azepam, may also reveal the cross-reacting characteristics of these reagents. Data shown in the first section of Table II (Group A) indicate that the benzodiazepines/metabolites present in these specimens (as determined by GC–MS) do not significantly cross-react with the test ELISAs.
Evaluation of common analytical parameters associated with GC–MS analysis of 7-amino-FM2
Because 7-amino-FM2 is the analyte of primary concern, Table III. Liquid–Liquid Extraction Recoveries and Intra- and Interday
Precision Data Derived from Drug-Free Urine Fortified with 10–200 ng/mL of 7-Amino-FM2
Spiked Recovery Intra-day precision Inter-day precision Conc. n Mean, SD*, CV% Mean, SD, CV% Mean, S.D, CV%
10 3 95.06, 5.47, 5.75 11.77, 0.96, 8.16 12.50, 1.07, 8.56 25 3 91.93, 3.62, 3.94 24.60, 0.46, 1.87 25.27, 1.16, 4.59 50 3 87.51, 1.95, 2.23 47.10, 0.62, 1.32 47.72, 0.60, 1.26 100 3 94.74, 1.52, 1.60 102.6, 0.94, 0.92 101.1, 1.13, 1.12 200 3 94.64, 1.56, 1.65 201.3, 0.94, 0.47 210.1, 1.27, 0.63 *SD = standard deviation.
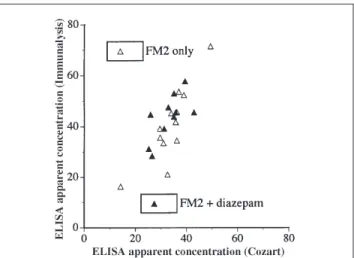
Figure 2. Correlation of ELISA and GC–MS test data. Group B: urine
spec-imens from patients with flunitrazepam (but not diazepam) treatment (A); Group C: urine specimens from patients with flunitrazepam (plus di-azepam) treatment (B); Group B + Group C (C).
Figure 3. Correlation of test data derived from two ELISAs (Group B +
common analytical parameters associated with the analysis of this compound were evaluated using the procedures de-scribed earlier. The resulting extraction efficiency and analytical precision, and accuracy are summarized in Table III. The assay protocol achieved excellent recovery and linearity (r2> 0.998) within the 10–200 ng/mL range studied. Using the criteria commonly adapted for defining LOD and LOQ, the LOQ and LOD were 2.0 and 0.50 ng/mL. Specifically, LOD is defined as the lowest concentration at which the monitored ion ratios are within ± 20% of that observed for the 50 ng/mL standard, while LOQ is defined as the lowest concentration at which the observed concentration is within ± 20% of the targeted value.
Correlation of ELISA apparent and GC–MS 7-amino-FM2 concentrations
Cross-reactivity data shown in Table I indicate diazepam as the only compound (other than FM2 parent compound) that cross-reacts with the ELISAs to a significant extent. To further understand the effect of diazepam on the correlation of the ELISA and GC–MS test data, specimens in Groups B and C were analyzed (second and third section of Table II). Resulting correlation data for these two groups are shown in Figures 2A–C, while the correlation of the apparent 7-amino-FM2 data derived from these two ELISAs are shown in Figure 3. The as-sociated correlation parameters derived from Figures 2A–C are listed in Table IV.
Data shown in Table IV indicate that the apparent 7-amino-FM2 concentration (that was equivalent to 30 ng/mL as determined by GC–MS) derived from the Immunalysis reagent is higher than that derived from the Cozart reagent. Further-more, these apparent concentrations derived from Group C specimens (patients with both flunitrazepam and diazepam exposure) are higher than the corresponding data derived from Group B specimens (patients with flunitrazepam,
but without diazepam exposure). Thus, data derived from two sets of clinical specimens further confirm that Immunalysis reagent indeed have slightly higher cross-reactivities than the reagent from Cozart. It is interesting to note that data derived from Group C specimens result in a better correlation with the GC–MS data for the Immunalysis than the Cozart reagent.
One important factor in a 2-step testing protocol is the se-lection of a cutoff concentration for the GC–MS test and an ap-propriate corresponding apparent analyte concentration for the immunoassay protocol. With this in mind and based on the excretion profile (5–10) of 7-amino-FM2 and the GC–MS assay’s LOD and LOQ established in this study, the cutoff for the GC–MS protocol is set at 30 ng/mL. Based on the correlation equations derived from data generated by the ELISAs using various sets of specimens, the equivalent ELISA apparent 7-amino-FM2 concentrations were found to range approximately 100–200 ng/mL (or 20–40 when diluted by a factor of 5). Both ELISA kits can be effectively applied to the 2-step testing pro-tocol with the recommended cutoffs and 5-fold dilution of test specimens.
Conclusion
Both Cozart and Immunalysis ELISAs are highly specific for 7-amino-FM2, with diazepam and FM2 (parent compound) as the only compounds with significant cross-reacting charac-teristics. Immunalysis reagent appears to exhibit slightly higher cross-reactivity than the Cozart reagent; however, this charac-teristic does not make it less effective in predicting the concentration of 7-amino-FM2 when the specimens are collected from donors with both flunitrazepam and diazepam exposure.
With the ELISA reagents optimal dynamic ranges set between 0–25 ng/mL, specimens should be diluted by a factor of 5 prior to ELISA testing (dilution is generally not re-quired for GC–MS analysis). Using 30 ng/mL 7-amino-FM2 as the GC–MS cutoff, the corre-sponding ELISA cutoffs are approximately 100–200 (or 20–40 when diluted by a factor of 5) ng/mL depending on the reagent and whether the specimens also contain signifi-cant levels of cross-reacting compounds, such as diazepam (and its metabolites).
Acknowledgments
The authors are thankful to Miss Ya-Ching Lee for collecting the urine samples used in this study and the financial support provided by the (Taiwanese) National Science Council (NSC 242-002, NSC 93-2745-M-242-003, and NSC-93-2745-P-521-002). Table IV. Correlation of ELISA and GC-MS Data Derived from Specimens
Collected from Patients Treated with FM2 and Other Benzodiazepines ELISA 7-amino-FM2 conc. (y) corresponding
to 6 (or 30 in original ELISA and resulting Correlation specimen) ng/mL Specimen correlation equation equation GC–MS conc. (x)*
Group B Cozart: y = 14.57 + 1.227x 0.5412 21.9 (~ 110 in undiluted specimen)
Immunalysis: y = 11.13 + 1.921x 0.4000 22.6 (~ 115 in undiluted specimen)
Group C Cozart: y = 18.82 + 0.07111x 0.003113 32.2 (~ 160 in undiluted specimen)
Immunalysis: y = 30.50 + 0.7897x 0.1660 35.2 (~ 180 in undiluted specimen)
Group B Cozart: y = 21.85 + 0.7117x 0.2250 26.1 and C Immunalysis: y = 18.78 + 1.456x 0.3088 27.5
* With the dynamic ranges of the ELISAs set between 0-25 ng/mL, specimens were diluted by a factor of 5 prior to ELISA testing (undiluted for GC-MS analysis).
References
1. D. Anglin, K.L. Spears, and H.R. Hutson. Flunitrazepam and its in-volvement in date or acquaintance rape. Acad. Emerg. Med. 4: 323–326 (1997).
2. M.A. ElSohly and S.J. Salamone. Prevalence of drugs used in cases of alleged sexual assault. J. Anal. Toxicol. 23: 141–146 (1999). 3. O.H. Drummer. Benzodiazepines—effects on human behavior
and performance. Forensic Sci. Rev. 14: 1–14 (2002).
4. A.M. Barrett, K. Walshe, P.V. Kavanagh, S.M. McNamara, C. Moran, J. Burdett, and A.G. Shattock. A comparison of five com-mercial immunoassays for the detection of flunitrazepam and other benzodiazepines in urine. Addict. Biol. 4: 81–87 (1999). 5. P.H. Wang, C. Liu, W.I. Tsay, J.H. Li, R.H. Liu, T.G. Wu, W.J.
Cheng, D.L. Lin, T.Y. Huang, and C.H. Chen. Improved screen and confirmation test of 7-aminoflunitrazepam in urine specimens for monitoring flunitrazepam (Rohypnol) exposure. J. Anal. Toxicol.
26: 411–418 (2002).
6. S.J. Salamone, S. Honasoge, C. Brenner, A.J. McNally, J. Passarelli,
K. Goc-Szkutnicka, R. Brenneisen, M.J. ElSohly, and S. Feng. Flu-nitrazepam excretion patterns using the Abuscreen OnTrak and OnLine immunoassays: comparison with GC–MS. J. Anal. Toxicol.
21: 341–345 (1997).
7. H. Snyder, K.S. Schwenzer, R. Pearlman, A.J. McNally, M. Tsilim-idos, S.J. Salamone, R. Brenneisen, M.A. ElSohly, and S. Feng. Serum and urine concentrations of flunitrazepam and metabo-lites, after a single oral dose, by immunoassay and GC-MS. J. Anal. Toxicol. 25: 699–704 (2001).
8. Z. Lin and O. Beck. Procedure for verification of flunitrazepam and nitrazepam intake by gas chromatographic-mass spectrometric analysis of urine. J. Pharm. Biomed. Anal. 13: 719–722 (1995). 9. M.A. ElSohly, S. Feng, S.J. Salamone, and R. Wu. A sensitive
GC-MS procedure for the analysis of flunitrazepam and its metabolites in urine. J. Anal. Toxicol. 21: 335–340 (1997).
10. A. Negrusz, C.M. Moore, T.L. Stockham, K.R. Poiser, J.L. Kern, R. Palaparthy, N.L. Le, P.G. Janicak, and N.A. Levy. Elimination of 7-aminoflunitrazepam and flunitrazepam in urine after a single dose of Rohypnol. J. Forensic Sci. 45: 1031–1040 (2000).