閘極介電質氧化鉿與氮氧矽鉿之可靠度研究
72
0
0
全文
(2) 閘極介電質氧化鉿與氮氧矽鉿之可靠度研究. Study on the Reliability of HfO2 and HfSiON Gate Dielectric. 研 究 生 : 林威良. Student : Wei-Liang Lin. 指導教授 : 趙天生 博士. Advisor : Dr. Tien-Sheng Chao. 國立交通大學 電子物理研究所碩士班 碩士論文 A Thesis Submitted to Institute of Electrophysics College of Science National Chiao Tung University in Partial Fulfillment of the Requirements for the Degree of Master of Science in Electrophysics July 2008 Hsinchu, Taiwan, Republic of China. 中華民國 九十七 年.
(3) Study on the Reliability of HfO2 and HfSiON Gate Dielectric Student:Wei-Liang Lin. Advisors:Dr. Tien-Sheng Chao. Institute of Electrophysics National Chiao Tung University. Abstract In this thesis, PBTI degradation for HfO2 and HfSiON NMOSFETs has been demonstrated. The generated oxide trap dominated the PBTI characteristics for Hf-based gate dielectrics. In addition, the reduction of VTH shift and oxide trap generation under PBTI stress indicates that the HfSiON is better than HfO2. On the other hand, the electron trapping/de-trapping effect has been investigated. As compared to HfO2 dielectrics, the HfSiON has shallower charge trapping level due to elimination of deep dielectric vacancies, and the temperature effects are quite different between the HfSiON and HfO2 gate dielectrics. DNBTI stress on HfO2 and HfSiON PMOSFETs has been investigated. The DNBTI model of hole trapping under NBTI stress and the electrons trapping under passivated stress have been proposed. In addition, the characteristics of the VTH shift and charge pumping current under DNBTI stress indicate that the interface states are not recovered during the passivated period.. I.
(4) 閘極介電質氧化鉿與氮氧矽鉿之可靠度研究. 研 究 生 : 林威良. 指導教授 : 趙天生 博士 國立交通大學 電子物理研究所碩士班. 摘要. 在這篇論文裡,我們展示 HfO2 和 HfSiON 介電質的 PBTI 退化特性,氧化層 中生成的捕捉電荷主導了 Hf-base 介電質得 PBTI 特性,另外,再 PBTI stress 中, 較少的臨界電壓飄移與氧化層捕捉電荷的生成證實了 HfSiON 相較於 HfO2 有較好 的特性.另一方面,我們也討論了電子的 trapping/de-trapping 效應,與 HfO2 介 電質相比,由於消除了較深層的介電質缺陷 HfSiON 有較淺的捕捉能階,而在不同 溫度下的表現,HfO2 介電質與 HfSiON 介電質有相當程度的不同.HfO2 與 HfSiON P 型場效電晶體在動態的 NBTI stress 也再論文中一併討論,我們提出在 NBTI stress 與 passivated stress 下,電洞捕捉模型.同時,我們由臨界電壓的改變與 charge pumping current 的特性得知,因為 stress 所造成的表面狀態在鈍化的 過程中將不會有回復的現象.. II.
(5) 誌 謝 趙天生老師是學生第一個要感謝的人。謝謝老師給學生這個機會在實驗室裡 學習,再我無處可歸的時候收留我,並且指導與充實學生在專業知識上的本質學 能。 再來要感謝李耀仁學長與羅文正學長。除了指導學弟課業上的問題外,兩位 學長更在學弟心中建立起做研究的良好典範;陳建豪學長在良測上的指導與技術 上的支援讓我有如久旱逢甘霖的感覺;也要感謝馬明文學長與郭柏儀學長在專業 技術上的指導與日常生活中的解惑。雖然呂宗宜學長不常出現在實驗室,也要感 謝學長時常給予實驗室經濟上的支援,讓實驗室的活動能夠成功地舉辦。 還要謝謝學長嘴砲大宗諭、邱德鑫、學姊美君、阿壘、猴子明宏以,同學冠 迪、小宗育、智盟、翊鴻、高興、顏榮家、世安、啟瑞、才民、小橋、佑倫,豐 富了我碩士班兩年的生活。讓我有了這兩年的美好回憶。 還要感謝家人的支持,讓我無後顧之憂地致力於碩士學位。也要感謝無緣的 那一位在這兩年的陪伴與照顧,雖然無緣一起走到最後,還是感謝這段時間支持 與體諒,也感謝乃傑、金龍、祥之、潔如、孟勳、蕙蓮、仲安、忠農、志賢、柏 豪、彥成、昊權在這一年多鼓勵與幫助, 此論文獻給以上諸位!. 林威良 誌於 新竹交大. III.
(6) Contents Abstract…..……………………………………………….……………….……..…Ⅰ Abstract (Chinese)…………………………………………………………....….…Ⅱ Acknowledgements (Chinese)……….……………………………….....…….….. Ⅲ Contents……………………………….……………….…..………………...…...…Ⅳ Table Caption………………………………… …….………………..…….......…..Ⅵ Figure Caption……………………………… …….……………..……….……..... Ⅵ. Chapter 1 Introduction 1.1 General Background…………………………………………..………………... .1 1.2 Motivation………………..…………………………………...………..………….2 1.3 Bias temperature instability stress mechanisms…………………..……………...3 1.4 Thesis Organization………………………………………………..……………...4. Chapter 2 Trapping and De-trapping Characteristic in Positive Bias Temperature Instability Stress Between HfO2 and HfSiON Gate Dielectric 2.1 Introduction………………………………………..…………..………………....9 2.2 Device Fabrication………………………………………….……………….......10 2.3 Results and Discussion………………………..…………...…..……………......10 2.3.1 Device Performance…………………………………..…..………...…...…11 2.3.2 PBTI Degradation for HfO2 and HfSiON Gate Dielectrics………..……....12 2.3.3 Temperature-Dependent De-trapping Characteristics for HfO2 and HfSiON Gate Dielectrics……………….…………………………………………..,,12 2.4 Summary………………………..………………..………...…..………..……....14. IV.
(7) Chapter 3 Characteristic of HfO2 and HfSiON Gate Dielectric in Negative Bias Temperature Instability Stress 3.1 Introduction………………………………………..…………..………………...32 3.2 Device Fabrication………………………………………….……………….......33 3.3 Results and Discussion………………………..…………...…..………………...33 3.3.1 Temperature instability…………………...……………..…..…………..…34 3.3.2 The characteristics of carriers trapping/de-trapping…………….…..……34 3.4 Summary………………………..………………..………...…..…………….......37. Chapter 4 Conclusion 4.1 Summary………………………..………………..………...…..………………...51. Reference……………………………………….……………..……………………..53 Publication List………………………………………………………………………59 Vita (Chinese)…………………………………………….…..……...………………60. V.
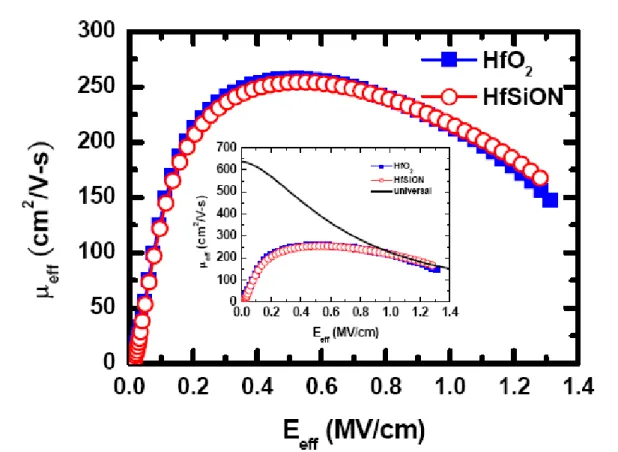
(8) Table Caption Chapter 2 Extracted Coefficients n and k after stress/passivation: ΔVth = K*tn……31. Table Ⅰ Chapter 3. Table Ⅰ Extracted Coefficient n during NBTI stress and ΔVth = K*tn. The NBTI stress voltage VG=-2.5V and the temperature T=100 oC………….…….50 Table. Ⅱ Extracted Coefficient n during passivated oeriod, and ΔVth = K*tn. The NBTI stress voltage VG=-2.5V and the temperature T=100 oC. ……...50. Figure Caption Chapter 1 Fig. 1.1. The charge trapping behavior during PBTI stress. ……………………….6. Fig. 1.2. Illustration of inverter operation. …………………………………………7. Fig. 1.3. The charge trapping behavior during PBTI stress. ……………………….8. Chapter 2 Fig.a2.1. High-frequency C-V characteristics at 100 kHz for NMOSFET with HfO. 2. and HfSiON gate dielectrics, respectively. …………………………….15 Fig.a2.2aaaThe effective electron mobility measured on HfO2 and HfSiON gate dielectrics using split CV method. …………………………………….16 VI.
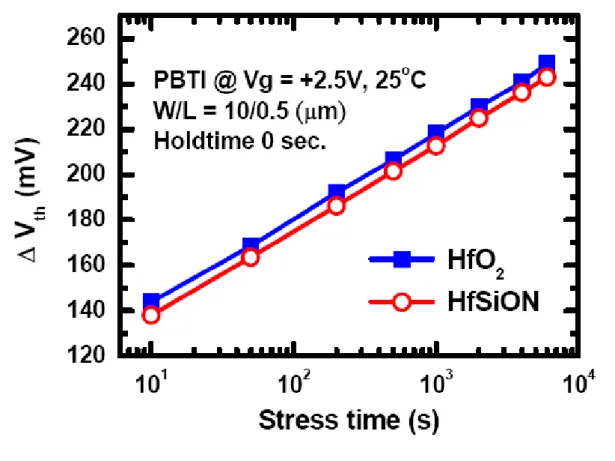
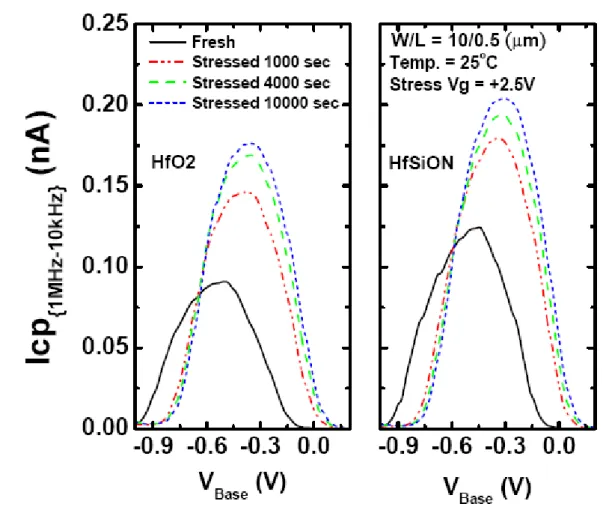
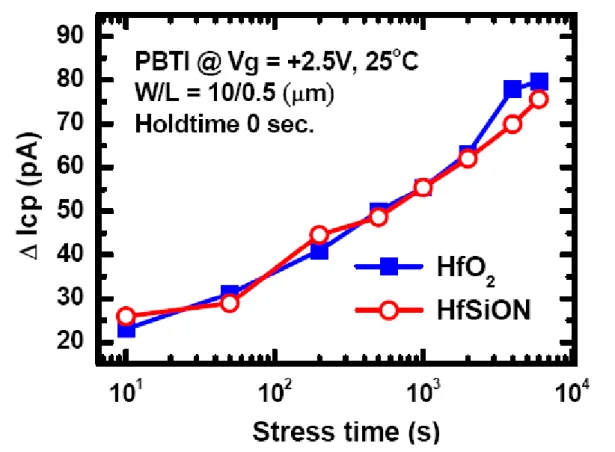
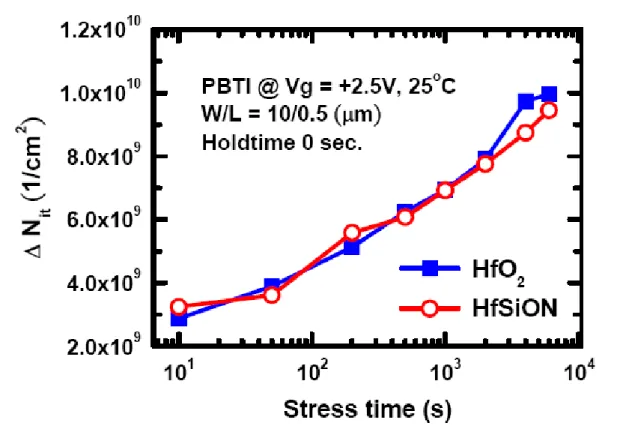
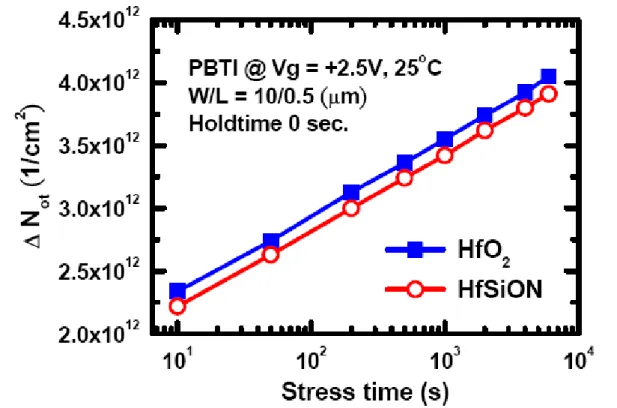
(9) Fig.a2.3. ΔVth of HfO2 and HfSiON gate dielectrics under the same PBTI stress (Vg = +2.5 V) at room temperature. …………………………….……..17. Fig. 2.4. Charge pumping current (ICP) before and after PBTI stressing at +2.5V for HfO2 and HfSiON dielectrics, respectively……………….………….18. Fig. 2.5. Charging pumping increase (ΔICP) of HfO2 and HfSiON gate dielectrics during the same PBTI stress bias (Vg = +2.5 V) at room temperature. ....19. Fig. 2.6. Interface trap increase (ΔNit) which extracted from ΔICP of HfO2 and HfSiON gate dielectrics during the same PBTI stress bias (Vg = +2.5 V) at room temperature. ……………………………………………………..20. Fig. 2.7. Generated oxide trap (ΔNot) in the bulk of higk-k film during PBTI stress for both of HfO2 and HfSiON dielectrics, respectively ………………….21. Fig. 2.8. Illustration of electron trapping model for Hf-based gate dielectrics under PBTI stress………………………………………………………………..22. Fig. 2.9(a) ΔVth of HfO2 and HfSiON gate dielectrics during PBTI stress (Vg = +2.5 V) with no hold time at different temperatures, including 25, 75 and 100 o. C. ………………………………………………………………………..23. Fig. 2.9(b) ΔVth of HfO2 and HfSiON gate dielectrics during PBTI stress (Vg = +2.5 V) with hold time 100 s at different temperatures, including 25, 75 and 100 o. C…………………………………………………………..……………..24. VII.
(10) Fig. 2.10(a) Comparison of different hold time (0 & 100 s) under PBTI stress (Vg = +2.5V) at different temperatures, including 25, 75 and 100 oC for HfO2 gate……………………………………………………………………..25 Fig. 2.10(b) Comparison of different hold time (0 & 100 s) under PBTI stress (Vg = +2.5V) at different temperatures, including 25, 75 and 100 oC for HfSiON gate dielectrics. ………………………………………………26 Fig. 2.11. Illustration of the charge trapping/de-trapping models for (a) HfO2 and (b) HfSiON gate dielectrics under PBTI stress respectively. ………………..27. Fig. 2.12(a) ΔVth of DPBTI stress versus stress/passivation at different temperature 25 oC……………………………………………………………………28 Fig. 2.12(b) ΔVth of DPBTI stress versus stress/passivation at different temperature 75 oC……………………………………………………………………29 Fig. 2.12(c) ΔVth of DPBTI stress versus stress/passivation at different temperature 100 oC…………………………………………………………………..30. Chapter 3 Fig.a3.1. show the temperature dependence of (a)HfO2 and (b)HfSiON dielectrics. …………………………………………………………......38.. Fig.a3.2aaThreshold voltage shift during DNBTI stress (-2.5V)/passivated(0V, 1V, 1.5V) 1000s cycles at T=100oC on (a) HfSiON (b) HfO2 devices. ……39 VIII.
(11) Fig.a3.3. Comparison of threshold voltage shift for (a) HfSiON and (b) HfO2 under first passivated period, and VG=0, 1, 1.5V, respectively. ……………….40. Fig. 3.4 Comparison of threshold voltage shift for (a) HfSiON and (b) HfO2 under second passivated period, and VG=0, 1, 1.5V, respectively. ……………41 Fig. 3.5. Comparison of threshold voltage shift for (a) HfSiON and (b) HfO2 under the third passivated period, and VG=0, 1, 1.5V, respectively…………....42. Fig. 3.6. Charge pumping current under the first NBTI cycle for (a) HfSiON and (b) HfO2 dielectrics, respectively……………………………………………43. Fig. 3.7. Charge pumping current under the first passivated state at 1.5V for (a) HfSiON and (b) HfO2 dielectrics, and the appearances of recovery are not obviously. ……………………………………………………………….44. Fig. 3.8. Charge pumping current under the second stressed state at -2.5V for (a) HfSiON and (b) HfO2 dielectrics, and the increase of charge pumping current are also not obviously…………………………………………...45. Fig. 3.9. Charge pumping current. under the second passivated state at 1.5V for a). HfSiON and b) HfO2 dielectrics, and the recovered phenomenon almost can be ignored. …………………………………………………….………..46 Fig. 3.10. Charge pumping current under the third stressed state at -2.5V for (a) HfSiON and (b) HfO2 dielectrics, and the increase of charge pumping. IX.
(12) current are also not obviously……………………………………...……..47 Fig. 3.11 Charge pumping current under the third passivated state at 1.5V for a) HfSiON and b) HfO2 dielectrics, and the recovered phenomenon almost can be ignored. …………………………………………………………..48 Fig. 3.12. Schematic of gate stack band diagram under (a) stress and (b) passivated. .. ……………………………………………………………………………49. X.
(13) Chapter 1 Introduction 1-1 General Background Reliability issues, such as negative-bias temperature instability (NBTI) [1-2] positive-bias temperature instability(PBTI) and hot-carrier injection (HCI) [3-4], that could induce threshold voltage shift and performance degradation in MOSFETs become a serious concern for realizing highly reliable integrated CMOS devices. Threshold voltage shift and performance degradation in MOSFETs are dominated by oxide trap and interface trap [5-6], high-k dielectric materials are especially advantageous for low-power application and for thickness uniformity control owing to the thicker physical thickness. Among high-k gate dielectric materials, Hf-based gate dielectric including HfO2 and Hf-silicate are the attractive materials because they have good device characteristics and compatible with the conventional polysilicon gate process [7-10]. However, before Hf-based gate dielectrics being successfully integrated into future technologies, their reliability characteristics still need to be better identified. Bias temperature instability (BTI) has been recognized as one of the critical concern in the reliability of modern CMOS devices. In conventional SiO2 gate oxides, NMOS under PBTI stress shows little threshold voltage degradation and hence is not a reliability concern while PMOS under NBTI. 1.
(14) stress has a continued reliability issue as the gate oxide thickness is scaled thinner[11]. On the contrary, unlike conventional SiO2 gate dielectrics, NMOS positive bias temperature instability (PBTI) could be a potential scaling limit of CMOS technology with Hf-based gate dielectrics [12]. Negative-bias temperature instability (NBTI) occurs in PMOS device which stresses with negative gate voltages at elevated temperature. In MOS circuits, it occurs most commonly during the “high” state of p-channel MOSFETs inverter operation. It also leads to timing shift and potential circuit failure due to increased spreads in signal arrival in logic circuits.. 1-2 Motivation The aggressive CMOS device scaling has been reaching the physical limit of conventional SiO2 MOSFETs as a result of significant direct tunneling current through ultrathin oxides. The resultant intolerable standby power consumption has made further oxide scaling impractical. High-k gate dielectric and metal gate expected to replace the conventional SiO2 /polysilicon gate stack to meet aggressive gate leakage current specification for advanced CMOS technologies. Replacement of SiO2 gate dielectric by high-k materials with larger physical thickness will reduce gate leakage current. Among the candidates, Hf-based materials are most promising, and considerable efforts have been devoted to their film compositions, process. 2.
(15) optimization, as well as reliability assessment and analysis. Recently, HfSiON and HfO2 have been successfully integrated into CMOS devices as gate dielectric for low-power applications with good reliability, comparable mobility (as SiO2), and greatly reduced gate leakage. Threshold voltage Vt of a field effect transistor (FET) is observed to shift with stressing time and this stress induced Vt shift is an important transistor reliability issue. Vt shifts that occur under negative gate bias is referred as NBTI and those that occur under positive bias is referred as PBTI or charge trapping.. 1-3 Bias temperature instability stress mechanisms One of the main constraints for scaling down MOSFET’s dimensions is the device instability. Degradation of MOSFET’s can be caused by hot carrier stressing, Fowler–Nordheim tunnelling injection and the bias temperature stressing (BTS). The former two have been investigated extensively, while the latter has received relatively less attention, although it is one of the earliest identified reliability problems. This is not because the bias temperature instability (BTI) has been fully understood, but because the BTI in modern MOS integrated circuit has been greatly reduced empirically. However, recent experimental results have shown that the BTI can still make a considerable contribution to the degradation of small size MOSFET’s. Further efforts have to be made, therefore, to understand the BTI phenomenon. Positive bias temperature instability (PBTI) is often reported to be one of the. 3.
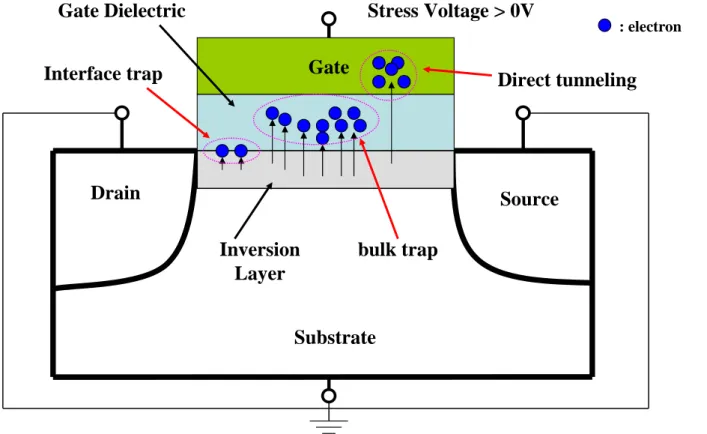
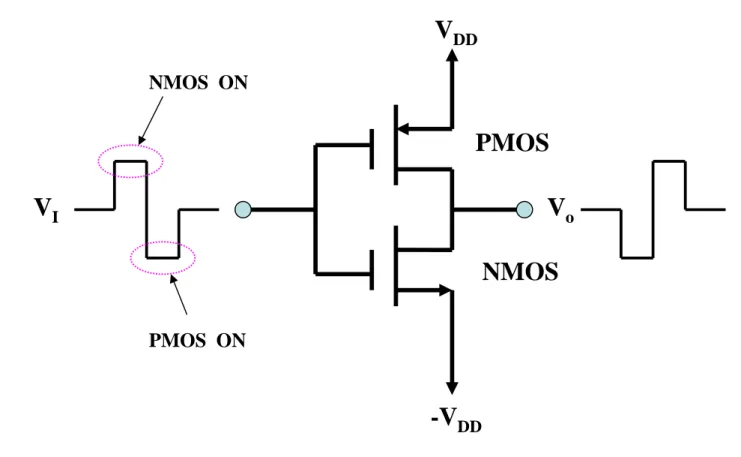
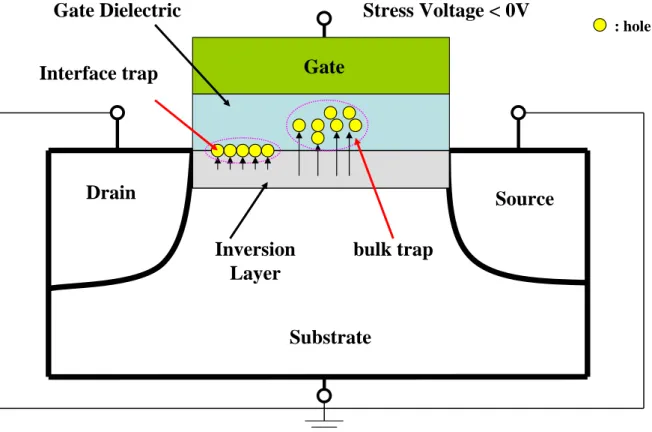
(16) primary reliability concerns in high-k gate stacks. It is generally agreed that PBTI in these gate stacks occurs due to reversible electron trapping in existing trap sites. Several groups have reported different techniques to mitigate the PBTI issues in high-k gate stacks, such as reducing the thickness of the dielectric. During PBTI stress, gate will be biased at positive voltage which induce electrons from inversion layer trapped in gate dielectric and damage the interface between gate dielectric and silicon substrate. Fig.1 shows the charge trapping behavior during PBTI stress. Negative bias temperature instability (NBTI) has been known since the very early days of MOS device development. NBTI, occurring in p-channel MOS devices stressed with negative gate voltage at elevated temperatures, manifests itself as absolute drain current and transconductance decrease, and absolute threshold voltage increase. In digital circuits fig.2, it occurs most commonly during the “high” state of p-channel MOSFETs inverter operation. It also leads to timing shifts and potential circuit failure due to increased spreads in signal arrival in logic circuits. During NBTI stress, the injected holes will induce interface state generation, and the holes also trap in gate dielectric. Fig.3 shows the charge trapping behavior during NBTI stress.. 1-4 Thesis Organization This thesis divided into four chapters. In chapter 2, shows the NMOS with high-k gate. dielectric. fabrication. and. electrical. 4. measurements.. The. experimental.
(17) measurement include effective electron mobility, charge pumping current, threshold voltage shift. In chapter 3, we demonstrated Negative-bias temperature instability (NBTI) characteristics on PMOS with high-k gate dielectric , and compare the various charge pumping current and different appearance of Trapping/De-Trapping at different stress voltage and different temperature.. 5.
(18) Gate Dielectric. Stress Voltage > 0V Gate. Interface trap. Direct tunneling. Drain. Source Inversion Layer. bulk trap. Substrate. Figure 1.1 The charge trapping behavior during PBTI stress. 6. : electron.
(19) VDD NMOS ON. PMOS VI. Vo NMOS PMOS ON. -VDD Figure 1.2 Illustration of inverter operation. 7.
(20) Gate Dielectric. Stress Voltage < 0V Gate. Interface trap. Drain. Source Inversion Layer. bulk trap. Substrate. Figure 1.3 The charge trapping behavior during PBTI stress. 8. : hole.
(21) Chapter 2 Trapping and De-trapping Characteristics in PBTI and Dynamic PBTI between HfO2 and HfSiON Gate Dielectrics 2-1 Introduction High-k dielectrics are especially advantageous for low-power application. Among high-k gate dielectric materials, Hf-based gate dielectric including HfO2 and Hf-silicate are the attractive materials because they have good device characteristics. However, before Hf-based gate dielectrics being successfully integrated into future technologies, their reliability characteristics still need to be better identified. NMOS positive bias temperature instability (PBTI) could be a potential scaling limit of CMOS technology with Hf-based gate dielectrics[13-16]. Most of the previous studies showed a significant positive threshold voltage shift for the high-k gate stack under PBTI stress, which was attributed to the preexisting traps in the high-k layer or the holes induced oxygen vacancy traps[17-21]. In addition, one of the main issues for high-k gate dielectrics is the charge trapping/de-trapping characteristics during reliability test. Since electrons can be trapped and de-trapped in the high-k dielectrics with a minimal residual damage to its atomic structure, a threshold voltage instability associated with electron trapping/detrapping in high-k layer can significantly affect. 9.
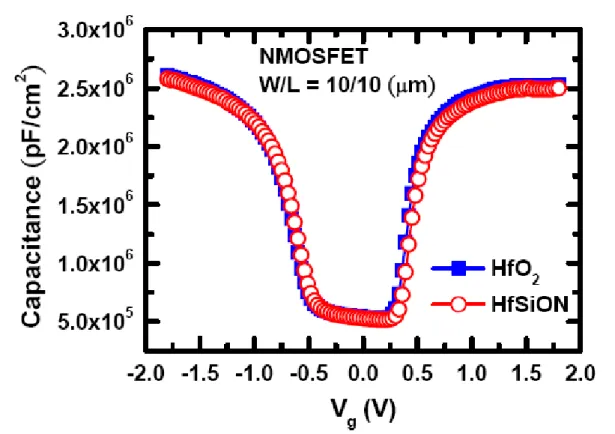
(22) the transistor performance[22].. 2-2 Device Fabrication NMOS devices were fabricated by state-of-the-art 300 mm wafer foundry technology. Shallow trench isolation (STI) was performed for devices isolation followed by super-steep retrograde well formation. The high-K dielectric including HfO2 and Hf-silicate were deposited by atomic-layer deposition (ALD). Chemical oxide was used as the interfacial layer unless it is specifically mentioned. The nitridation of HfSiO with Hf/(Hf+Si) ratio of 50% was carried by NH3 annealing in the ambient. After shallow source/drain extensions and pocket implantation, tetraethoxysilane (TEOS) liner and low-temperature silicon nitride were processed in sequence to form a sidewall spacer. Modified S/D implants were adopted to improve activation and junction capacitance while maintaining good SCE. The fabrication of a heavily doped source/drain junction by implantation was followed by a rapid thermal annealing (RTA) of 1000 oC for 5s for S/D activation and thermal stability of HfSiON. 2-3 Results and Discussion 2-3-1Device Performance Figure 2-1 shows the high-frequency C-V characteristics at 100 kHz for HfO2 and HfSiON gate dielectrics, respectively. The well C-V characteristics under accumulation, depletion and inversion regions can be observed in this work for both HfO2 and HfSiON gate dielectrics. The effective oxide thickness was also extract 10.
(23) from these C-V curves under accumulation without considering quantum effects. Since the EOT were almost the same (1.3 nm) for HfO2 and HfSiON gate dielectrics as shown in Fig. 2-1, therefore, the reliability test can be analyzed by biasing the same gate voltage in this work. At a higher field (>1 MV/cm), the mobility of HfSiON gate dielectric is large than HfO2 gate dielectrics as shown in Fig. 2-2. We speculate that the Si-O and Si-N bodings were formed for the HfSiON gate dielectrics resulting in annihilation of oxygen vacancies to offer mobility enhancement at high electric field. 2-3-2 PBTI Degradation for HfO2 and HfSiON Gate Dielectrics In order to understand the mechanism of PBTI in our high-k dielectrics, Figure 2-3 shows the threshold voltage degradation (ΔVth) of HfO2 and HfSiON gate dielectrics under PBTI stress at room temperature. Figures 2-4 show the charge pumping current (ICP) before and after PBTI stressing. Contrast to ΔVth , the HfO2 gate dielectrics have better HfO2/Si interface due to its less initial ICP. However, the Icp of HfSiON dielectrics is larger than HfO2, but the increase in ICP during PBTI stress is almost identical for HfO2 and HfSiON gate dielectrics, as shown in Fig. 2-5. From Fig. 2-5 & 2-6, it is noted that the Nit increase is quite low (< 2×109 cm-2) in this work[11]. Figure 2-7 shows the Not increase for both of HfO2 and HfSiON dielectrics during PBTI stress, respectively[12].. 11.
(24) Therefore, the charge trapping model for Hf-based gate dielectrics under PBTI stress was illustrated in Fig.2-8. 2.3.3 Temperature-Dependent De-trapping Characteristics for HfO2 and HfSiON Gate Dielectrics The temperature-dependent trapping and de-trapping characteristics for both HfO2 and HfSiON splits are also investigate in this study. In Figs. 2-9, we compare the HfO2 and HfSiON gate dielectrics under PBTI stress (Vg = +2.5 V) w/ and w/o hold time at different temperatures, including 25, 75 and 100 oC. The obvious improvement in PBTI characteristics was observed for HfSiON gate dielectrics while the hold time is 100 s as indicated in Fig. 2-9(b). This result indicates that the electron de-trapping will be easily occurred in HfSiON gate dielectrics. It means that the extra Si-O and Si-N bodings effectively removed the dielectric vacancies to have a lower trapping cross section and a lower concentration of generated traps, and reduce some trapping levels. This implies that some deep electron traps are effectively eliminated for HfSiON gate dielectrics, resulting in the characteristics as shown in Figs. 2-10(a) & (b). In Fig.2-10 (a), it indicates that the HfO2 gate dielectric generated deeper charge trap during PBTI stress and trapped electrons need higher thermal energy to de-trap from HfO2 film. In Fig.2-9 (b), because of some deeper trap were effectively eliminated; the ΔVTH in PBTI stress with 0 s hold time is larger than ΔVTH with 100 s. 12.
(25) hold time at different temperatures. Figures 2-11(a) & (b) illustrate the charge trapping/de-trapping models for HfO2 and HfSiON gate dielectrics under PBTI stress respectively. As compared to HfO2 dielectrics, the HfSiON dielectrics has deep charge trapping level under PBTI stress as illustrated in Fig. 2-11(b). In Figs. 2-12, we also compare the HfO2 and HfSiON gate dielectrics under dynamic positive bias temperature instability (DPBTI) stress (Vg = +2.5V under stress, while Vg=0V under passivation) at 25oC, 75oC, 100oC, respectively. In Fig. 2-12(a), the ΔVTH of HfSiON is lower than that of HfO2 at 25oC due to the annihilation of oxygen vacancies removed by the Si-O and Si-N bonding. From the results under higher temperature DPBTI stress in Figs. 2-12(b) and (c), we speculate that electrons need higher thermal energy to trap in deep level in HfSiON gate dielectric. In addition, the recovery amplitudes at different stress temperature during passivation periods are almost identical for both HfO2 and HfSiON splits. Finally, we extracted the coefficient n and K from DPBTI stress and summarized in TableⅠ, where n stands for trapping /de-trapping ability and K is the amplitude which is function of stress voltage Vg, temperature, dimension size, and process conditions. From the n and K values in TableⅠ, the temperature effects are quite different between the HfSiON and HfO2 gate dielectrics.. 13.
(26) 2-4 Summary The generated oxide trap during PBTI stress will dominate the PBTI characteristics for Hf-based gate dielectrics. In addition, the degree of threshold voltage degradation and oxide trap generation under PBTI stress indicates that the HfSiON thin film quality is better than HfO2 attributed to HfSiON gate dielectrics had the extra Si-O and Si-N bodings resulting in annihilation of oxygen vacancies. As compared to HfO2 dielectrics, the HfSiON has shallower charge trapping level under PBTI stress due to elimination of deep dielectric vacancies. Finally, the temperature effects are quite different between the HfSiON and HfO2 gate dielectrics.. 14.
(27) Fig. 2-1 High-frequency C-V characteristics at 100 kHz for NMOSFET with HfO and HfSiON gate dielectrics, respectively. 2. 15.
(28) Fig. 2-2 The effective electron mobility measured on HfO2 and HfSiON gate dielectrics using split CV method.. 16.
(29) Fig. 2-3 ΔVth of HfO2 and HfSiON gate dielectrics under the same PBTI stress (Vg = +2.5 V) at room temperature.. 17.
(30) Fig. 2-4 Charge pumping current (ICP) before and after PBTI stressing at +2.5V for HfO2 and HfSiON dielectrics, respectively. 18.
(31) Fig. 2-5 Charging pumping increase (ΔICP) of HfO2 and HfSiON gate dielectrics during the same PBTI stress bias (Vg = +2.5 V) at room temperature.. 19.
(32) Fig. 2-6 Interface trap increase (ΔNit) which extracted from ΔICP of HfO2 and HfSiON gate dielectrics during the same PBTI stress bias (Vg = +2.5 V) at room temperature.. 20.
(33) Fig. 2-7 Generated oxide trap (ΔNot) in the bulk of higk-k film during PBTI stress for both of HfO2 and HfSiON dielectrics, respectively. 21.
(34) Fig. 2-8 Illustration of electron trapping model for Hf-based gate dielectrics under PBTI stress.. 22.
(35) Fig. 2-9(a) ΔVth of HfO2 and HfSiON gate dielectrics during PBTI stress (Vg = +2.5 V) with no hold time at different temperatures, including 25, 75 and 100 oC.. 23.
(36) Fig. 2-9(b) ΔVth of HfO2 and HfSiON gate dielectrics during PBTI stress (Vg = +2.5 V) with hold time 100 s at different temperatures, including 25, 75 and 100. 24.
(37) Fig. 2-10(a) Comparison of different hold time (0 & 100 s) under PBTI stress (Vg = +2.5V) at different temperatures, including 25, 75 and 100 oC for HfO2 gate. 25.
(38) Fig. 2-10(b) Comparison of different hold time (0 & 100 s) under PBTI stress (Vg = +2.5V) at different temperatures, including 25, 75 and 100 oC for HfSiON gate dielectrics.. 26.
(39) Fig. 2-11 Illustration of the charge trapping/de-trapping models for (a) HfO2 and (b) HfSiON gate dielectrics under PBTI stress respectively.. 27.
(40) Δ Vth (mV). 240 220 200 180 160 140 120 100 80 60 40 20 0 -20. 2st stress 1st stress. 2st passivation 1st passivation. 0. 25 C stress @ Vg = +2.5V passivation @ Vg = 0V W/L = 10/1 (μm). 0. 1000. 2000. HfO2 HfSiON 3000. 4000. Stress time (s) Fig. 2-12(a) ΔVth temperature 25 oC. of DPBTI stress versus stress/passivation at different. 28.
(41) Δ Vth (mV). 280 260 240 220 200 180 160 140 120 100 80 60 40 20 0 -20. 2st stress 1st stress 2st passivation 1st passivation. 0. 75 C stress @ Vg = +2.5V passivation @ Vg = 0V W/L = 10/1 (μm). 0. 1000. 2000. HfO2 HfSiON 3000. 4000. Stress time (s) Fig. 2-12(b) ΔVth temperature 75 oC. of DPBTI stress versus stress/passivation at different. 29.
(42) Δ Vth (mV). 300 280 260 240 220 200 180 160 140 120 100 80 60 40 20 0 -20. 2st stress 1st stress 2st passivation 1st passivation. 0. 100 C stress @ Vg = +2.5V passivation @ Vg = 0V W/L = 10/1 (μm). 0. 1000. 2000. HfO2 HfSiON 3000. 4000. Stress time (s) Fig. 2-12(c) ΔVth temperature 100 oC. of DPBTI stress versus stress/passivation at different. 30.
(43) Table Ⅰ Extracted Coefficients n and k after stress/passivation: ΔVth = K*tn. 31.
(44) Chapter 3 Trapping Characteristics of Electrons and Holes under Dynamic NBTI Stress between HfO2 and HfSiON Gate Dielectrics 3-1 Introduction As CMOS devices are scaling down aggressively, high-k gate dielectrics have become very important[21.25]. However, there are still a number of fundamental issues[26-29], such as fixed charge, reduced channel mobility, trapped charge, and reliability characteristics, which have to be understood and solved for successful high-k integration into the silicon CMOS technology. Reliability of high-k gate dielectric is an important issue in integral circuit performance. The quality of high-k gate dielectric, including high-k bulk pre-exist charge trap, stress-induced charge trap and high-k/SiO2/Si interface are greatly influence the performance and lifetime of the devices. Negative bias temperature instability (NBTI) represents one of the major concerns for the reliability of MOSFETs. In references[30-31], the NBTI was considered due to the interface states between dielectric and silicon bulk(e.g., Reaction and Diffusion model). In this study, we would discuss the characteristics in dynamic negative bias temperature instability (DNBTI) stress between HfO2 and HfSiON gate dielectrics at. 32.
(45) different temperature and passivated voltage. The relationships between threshold voltage and charge trapping /de-trapping and the behavior of charge pumping current under stress and passivated phase are investigated[32-33].. 3-2 Device Fabrication PMOS devices were fabricated by state-of-the-art 300 mm wafer foundry technology. STI was performed for devices isolation followed by super-steep retrograde well formation. The high-K dielectric including HfO2 and Hf-silicate were deposited by ALD. Chemical oxide was used as the interfacial layer unless it is specifically mentioned. The nitridation of HfSiO with Hf/(Hf+Si) ratio of 50% was carried by NH3 annealing in the ambient. After shallow source/drain extensions and pocket implantation, TEOS liner and low-temperature silicon nitride were processed in sequence to form a sidewall spacer. Modified S/D implants were adopted to improve activation and junction capacitance while maintaining good SCE. The fabrication of a heavily doped source/drain junction by implantation was followed by a RTA of 1000 oC for 5 s for S/D activation and thermal stability of HfSiON. Device parameters, including drive current and threshold voltage, were measured using a Keithley 4200 papameter analyzer before and after reliability stressing.. 3-3 Results and Discussion 33.
(46) In this study, DNBTI on HfO2 and HfSiON PMOSFETs has been investigated. The DNBTI model of hole trapping under NBTI stress and the electrons trapping under passivated stress have been proposed. In addition, the characteristics of the ΔVTH and charge pumping current under DNBTI stress indicate that the interface states are not recovered during the passivated period.. 3-3-1 Temperature instability Figure 3-1 show the temperature dependence of (a)HfO2 and (b)HfSiON dielectrics. The change of threshold voltage is due to hole trapping/de-trapping and interface state generation/passivation. Although the high temperature enhance the hole trapping and interface state generation, but it also have better behavior under passivation state.. 3-3-2 The characteristics of carriers trapping/de-trapping Figures 3-2 show the comparisons of the threshold voltage shift (ΔVth) for (a) HfSiON and (b) HfO2 under DNBTI stress with respect to stress time. Each cycle time is 1000 seconds and the stress temperature is kept at 100 oC. The gate voltage VG is -2.5 V under NBTI stress, and VG is 0, 1, 1.5V under passivated stress, respectively. Furthermore, the terminals (source, drain, and substrate) are grounded under both conditions during the DNBTI stress. It is worth noting that the ΔVth is almost recovered at VG=1.5V. Figures 3-3 show the comparisons of the ΔVth on log scale for. 34.
(47) (a) HfSiON and (b) HfO2 under first passivated stress. From the extraction of power law, one finds that there is only one power-law exponent value for the splits of VG=0 and 1V, but there are two distinct power-law exponent values for the split of VG=1.5V. For the split of HfSiON, the n of power-law exponent value is from -0.173 to -0.456, and that of HfO2 is from -0.280 to -1.746. The decreasing magnitude of HfO2 is larger than that of HfSiON, and we suppose that the defects in HfO2 one more than that in HfSiON for electron trapping. Figures 3-4 show the comparison of that under second passivated period. For the split of HfSiON, Fig. 3-4(a), the n value of power-law exponent value is from -0.146 to -0.318, and that of HfO2 Fig. 3-4(b) is from -0.205 to -0.829. The decreasing magnitude of second passivated period is less than that of first passivated period, and the n value of third passivated period Fig. 3-5 is the smallest in these passivated states. In order to compare the difference recovered behaviors between different passivated and stress state, we extracted the coefficient n and summarized in TableⅠand Table ΙΙ. In the first passivated cycle, one can observe two different passivated behaviors for the split of VG=1.5V. In first stage, we speculate that the hole de-trapping from high-k dielectric to the substrate with small amount electrons trapping into high-k dielectric, which results in smaller n value. Then, the coefficient n decreases in second stage, because of a great amount of electrons trapped into dielectric. Furthermore, in the second passivated cycle, the absolute n values are. 35.
(48) smaller than that in the first passivated cycle. Figures 3-6 depict the charge pumping current under the first NBTI stress cycle for (a) HfSiON and (b) HfO2 dielectrics, respectively. The charge pumping current increases during the first NBTI stress cycle. However, during the first passivated stress cycle, the charge pumping current decreases slightly, as shown in Figs. 3-7. As compared with Figs. 3-2, the ΔVth would be almost recovered, especially for the split of VG=1.5V, but the charge pumping current isn’t recovered any more. Therefore, the recovery behavior isn’t due to the passivation of interface states, but due to the electrons trapping. Figures 3-8 depict the charge pumping current under the second NBTI stress cycle for (a) HfSiON and (b) HfO2 dielectrics, respectively. It is interesting that the charge pumping current doesn’t change, which is different from that during the first NBTI stress cycle. This means that the interface states increasing is close to saturation after the first NBTI cycle. In the second and third passivated/stress cycles of Figs. 3-8 to Figs. 3-11, the charge pumping current also decreases slightly. It turns out that, the recovery of ΔVTH is not dominant by the passivated behavior of interface states. Figures. 3-12 show the schematic of gate stack band diagram under (a) stress and (b) passivated cycle. Under NBTI stress state, holes in the inversion are injected into the gate dielectric layer. Under passivated states, the electrons are injected into the gate dielectric layer, and the holes are slightly escaping from the gate dielectric at the same moment.. 36.
(49) 3-4 Summary The threshold voltage shift was almost recovered at VG=1.5V, and there are two distinct power-law exponent values for the split of VG=1.5V. In addition, the charge pumping current increases only in the first NBTI cycle, and it almost has not any variation in other cycles due to the saturation of interface states generation. Therefore, we conclude that the interface states are generated at the first NBTI stress state, and they are not recovered anymore at passivation cycles. Under passivated stated, the recovery of ΔVTH is only due to the electrons/holes trapping/de-trapping.. 37.
(50) 80 75. HfSiON. 70 65 60 55. Δ Vth (mV). 50 45 40 35 30 25 20 15. o. 25 C o 75 C o 100 C. 10 5. W/L=10/1 μm. 0 -5 0. 1000. 2000. 3000. 4000. 5000. 6000. Stress time (sec.). Δ Vth (mV). (a) 90 85 80 75 70 65 60 55 50 45 40 35 30 25 20 15 10 5 0 -5. HfO2. o. 25 C o 75 C o 100 C. W/L=10/1 μm 0. 1000. 2000. 3000. 4000. 5000. 6000. Stress time (sec.) (b) Figure 3-1 show the temperature dependence of (a)HfO2 and (b)HfSiON dielectrics. 38.
(51) o. Δ Vth (mV). 80. PMOS DNBTI Stress VG = 2.5V 100 C. 60. 25mV 40. 26mV 20. passivated 0 V passivated 1 V passivated 1.5V. HfSiON. 0. 0. 1000. 2000. 3000. 4000. 5000. 6000. Stress time (sec.) (a). o. 80. PMOS DNBTI Stress VG = 2.5V 100 C. Δ Vth (mV). 60. 23mV 40. 36mV 20. passivated 0 V passivated 1 V passivated 1.5V. 0. HfO2 -20 0. 1000. 2000. 3000. 4000. 5000. 6000. Stress time (sec.) (b) Figure 3-2 Threshold voltage shift during DNBTI stress (-2.5V)/passivated(0V, 1V, 1.5V) 1000s cycles at T=100oC on (a) HfSiON (b) HfO2 devices.. 39.
(52) 100 -0.0374. 70.115X. Δ Vth (mV). -0.0687. 53.528X -0.173. 43.396X 10. HfSiON o 100 C W/L = 10/1 μm. -0.4564. 181.47X. passivated 0V passivated 1V passivated 1.5V 1 10. 100. 1000. Stress time (sec.) (a). 100 -0.0311. 67.107X. Δ Vth (mV). -0.0662. 52.481X. -0.2806. 46.796X. 10. HfO2 o. 100 C W/L = 10/1 μm. -1.3746. 12331X. passivated 0V passivated 1V passivated 1.5V 1 10. 100. 1000. Stress time (sec.) (b) Figure 3-3 Comparison of threshold voltage shift for (a) HfSiON and (b) HfO2 under first passivated period, and VG=0, 1, 1.5V, respectively. 40.
(53) 100 -0.027. 75.457X. Δ Vth (mV). -0.0687. 57.238X -0.146. 43.461X. -0.3185. 10. 119.32X. HfSiON o 100 C W/L = 10/1 μm. passivated 0V passivated 1V passivated 1.5V 1 10. 100. 1000. Stress time (sec.) (a) (a). 100. -0.0254. 73.608X. -0.053. Δ Vth (mV). 56.807X. -0.2058. 44.985X. 10. HfO2. -0.8293. o. 11324.5X. 100 C W/L = 10/1 μm. passivated 0V passivated 1V passivated 1.5V. 1 10. 100. 1000. Stress time (sec.) (b) Figure 3-4 Comparison of threshold voltage shift for (a) HfSiON and (b) HfO2 under second passivated period, and VG=0, 1, 1.5V, respectively.. 41.
(54) -0.025. 100. 80.396X. -0.0489. Δ Vth (mV). 60.226X -0.1302. 48.186X. -0.2631. 100.79X. 10. HfSiON o 100 C W/L = 10/1 μm. passivated 0V passivated 1V passivated 1.5V 1 10. 100. 1000. Stress time (sec.) (a). 100. -0.0219. 77.242X. -0.0483. Δ Vth (mV). 59.336X. -0.1819. 54.774X 10. HfO2. -0.5748. 354.27X. o. 100 C W/L = 10/1 μm. passivated 0V passivated 1V passivated 1.5V 1 10. 100. Stress time (sec.). 1000. (b) Figure 3-5 Comparison of threshold voltage shift for (a) HfSiON and (b) HfO2 under the third passivated period, and VG=0, 1, 1.5V, respectively. 42.
(55) 0.0. -7. -2.0x10. fresh stress 10s stress 50s stress 100s stress 200s stress 500s stress 1000s. -7. Icp (A). -4.0x10. -7. -6.0x10. -7. -8.0x10. -6. -1.0x10. -6. -1.2x10. HfSiON W/L=10/10 μm o Stress VG = -2.5 V @ 100 C -0.6. -0.4. -0.2. 0.0. 0.2. 0.4. 0.6. 0.8. 1.0. 0.4. 0.6. 0.8. 1.0. Base V (V) (a). 0.0. -7. -2.0x10. fresh stress 10s stress 50s stress 100s stress 200s stress 500s stress 1000s. -7. Icp (A). -4.0x10. -7. -6.0x10. -7. -8.0x10. -6. -1.0x10. -6. -1.2x10. HfO2 W/L=10/10 μm o Stress VG = -2.5 V @ 100 C -0.6. -0.4. -0.2. 0.0. 0.2. Base V (V) (b) Figure 3-6 Charge pumping current under the first NBTI cycle for (a) HfSiON and (b) HfO2 dielectrics, respectively. 43.
(56) 0.0. -7. -2.0x10. fresh passivate 10s passivate 50s passivate 100s passivate 200s passivate 500s passivate 1000s. -7. Icp (A). -4.0x10. -7. -6.0x10. -7. -8.0x10. -6. -1.0x10. -6. -1.2x10. HfSiON W/L=10/10 μm o passivate VG = 1.5 V @ 100 C -0.6. -0.4. -0.2. 0.0. 0.2. 0.4. 0.6. 0.8. 1.0. 0.4. 0.6. 0.8. 1.0. Base V (V) (a). 0.0. -7. -2.0x10. fresh passivate 10s passivate 50s passivate 100s passivate 200s passivate 500s passivate 1000s. -7. Icp (A). -4.0x10. -7. -6.0x10. -7. -8.0x10. -6. -1.0x10. -6. -1.2x10. HfO2 W/L=10/10 μm o passivate VG = 1.5 V @ 100 C -0.6. -0.4. -0.2. 0.0. 0.2. Base V (V) (b) Figure 3-7 Charge pumping current under the first passivated state at 1.5V for (a) HfSiON and (b) HfO2 dielectrics, and the appearances of recovery are not obviously. 44.
(57) 0.0. -7. -2.0x10. fresh stress 10s stress 50s stress 100s stress 200s stress 500s stress 1000s. -7. Icp (A). -4.0x10. -7. -6.0x10. -7. -8.0x10. -6. -1.0x10. HfSiON W/L=10/10 μm o Stress VG = -2.5 V @ 100 C. -6. -1.2x10. -0.6. -0.4. -0.2. 0.0. 0.2. 0.4. 0.6. 0.8. 1.0. Base V (V) (a). 0.0. -7. -2.0x10. fresh stress 10s stress 50s stress 100s stress 200s stress 500s stress 1000s. -7. Icp (A). -4.0x10. -7. -6.0x10. -7. -8.0x10. -6. -1.0x10. -6. -1.2x10. HfO2 W/L=10/10 μm o Stress VG = -2.5 V @ 100 C -0.6. -0.4. -0.2. 0.0. 0.2. 0.4. 0.6. 0.8. 1.0. Base V (V) (b) Figure 3-8 Charge pumping current under the second stressed state at -2.5V for (a) HfSiON and (b) HfO2 dielectrics, and the increase of charge pumping current are also not obviously. 45.
(58) 0.0. -7. -2.0x10. fresh passivate 10s passivate 50s passivate 100s passivate 200s passivate 500s passivate 1000s. -7. Icp (A). -4.0x10. -7. -6.0x10. -7. -8.0x10. -6. -1.0x10. HfSiON W/L=10/10 μm o passivate VG = 1.5 V @ 100 C. -6. -1.2x10. -0.6. -0.4. -0.2. 0.0. 0.2. 0.4. 0.6. 0.8. 1.0. 0.6. 0.8. 1.0. Base V (V) (a). 0.0. -7. -2.0x10. fresh passivate 10s passivate 50s passivate 100s passivate 200s passivate 500s passivate 1000s. -7. Icp (A). -4.0x10. -7. -6.0x10. -7. -8.0x10. -6. -1.0x10. -6. -1.2x10. HfO2 W/L=10/10 μm o passivate VG = 1.5 V @ 100 C -0.6. -0.4. -0.2. 0.0. 0.2. 0.4. Base V (V) (b) Figure 3-9 Charge pumping current under the second passivated state at 1.5V for a) HfSiON and b) HfO2 dielectrics, and the recovered phenomenon almost can be ignored.. 46.
(59) 0.0. -7. -2.0x10. fresh stress 10s stress 50s stress 100s stress 200s stress 500s stress 1000s. -7. Icp (A). -4.0x10. -7. -6.0x10. -7. -8.0x10. -6. -1.0x10. -6. -1.2x10. HfSiON W/L=10/10 μm o Stress VG = -2.5 V @ 100 C -0.6. -0.4. -0.2. 0.0. 0.2. 0.4. 0.6. 0.8. 1.0. 0.4. 0.6. 0.8. 1.0. Base V (V) (a). 0.0. -7. -2.0x10. fresh stress 10s stress 50s stress 100s stress 200s stress 500s stress 1000s. -7. Icp (A). -4.0x10. -7. -6.0x10. -7. -8.0x10. -6. -1.0x10. -6. -1.2x10. HfO2 W/L=10/10 μm o Stress VG = -2.5 V @ 100 C -0.6. -0.4. -0.2. 0.0. 0.2. Base V (V) (b) Figure 3-10 Charge pumping current under the third stressed state at -2.5V for (a) HfSiON and (b) HfO2 dielectrics, and the increase of charge pumping current are also not obviously.. 47.
(60) 0.0. -7. -2.0x10. fresh passivate 10s passivate 50s passivate 100s passivate 200s passivate 500s passivate 1000s. -7. Icp (A). -4.0x10. -7. -6.0x10. -7. -8.0x10. -6. -1.0x10. HfSiON W/L=10/10 μm o passivate VG = 1.5 V @ 100 C. -6. -1.2x10. -0.6. -0.4. -0.2. 0.0. 0.2. 0.4. 0.6. 0.8. 1.0. Base V (V) (a). 0.0. -7. -2.0x10. fresh passivate 10s passivate 50s passivate 100s passivate 200s passivate 500s passivate 1000s. -7. Icp (A). -4.0x10. -7. -6.0x10. -7. -8.0x10. -6. -1.0x10. -6. -1.2x10. HfO2 W/L=10/10 μm o passivate VG = 1.5 V @ 100 C -0.6. -0.4. -0.2. 0.0. 0.2. 0.4. 0.6. 0.8. 1.0. Base V (V) (b) Figure 3-11 Charge pumping current under the third passivated state at 1.5V for a) HfSiON and b) HfO2 dielectrics, and the recovered phenomenon almost can be ignored. 48.
(61) (a). (b) Figure 3-12 Schematic of gate stack band diagram under (a) stress and (b) passivated. 49.
(62) Table Ⅰ Extracted Coefficient n during NBTI stress and ΔVth = K*tn. The NBTI stress voltage VG=-2.5V and the temperature T=100 oC.. Table. Ⅱ Extracted Coefficient n during passivated oeriod, and ΔVth = K*tn.. The NBTI stress voltage VG=-2.5V and the temperature T=100 oC.. 50.
(63) Chapter 4 Conclusion In this studying, the PBTI and NBTI degradation for HfO2 and HfSiON NMOSFETs with the metal gate electrode has been successfully demonstrated. The pre-exist/generated oxide trap during PBTI stress will dominate the PBTI characteristics for Hf-based gate dielectrics. In addition, the better behaviors of threshold voltage degradation and oxide trap generation under PBTI stress indicates that the HfSiON thin film quality is better than HfO2 attributed to HfSiON gate dielectrics had the extra Si-O and Si-N bodings resulting in annihilation of oxygen vacancies. On the other hand, the electron trapping/de-trapping effect has been investigated in both HfO2 and HfSiON NMOSFETs with constant voltage stress. As compared with HfO2 dielectrics, the HfSiON has shallower charge trapping level under PBTI stress due to elimination of deep dielectric vacancies. During the NBTI stress, the threshold voltage shift was almost recovered at VG=1.5V, and there are two distinct power-law exponent values for the split of VG=1.5V. In addition, the charge pumping current increases only in the first NBTI cycle, and it almost has not any variation in other cycles due to the saturation of interface states generation. Therefore, we conclude that the interface states are generated at the first NBTI stress state, and they are not recovered at any situation.. 51.
(64) Under passivated stated, the recovery of ΔVth is only due to the electrons/holes trapping/de-trapping.. 52.
(65) References [1] T. Yamamoto, K. Uwasawa, and T. Mogami, “Bias temperature instability in scaled p+ polysilicon gate p-MOSFET's,” IEEE Trans. Electron Devices, vol. 46, pp. 921-926, 1999. [2]. D. K. Schroder and J. A. Babcock, “Negative bias temperature instability: road to cross in deep sunmicron silicon semiconductor manufacturing,” Appl. Phys. Rev., vol. 94, pp. 1-18, 2003.. [3]. B. S. Doyle and K. R. Mistry,“A lifetime prediction method for hot-carrier degradation insurface-channel p-MOS devices,” IEEE Trans. Electron Devices, vol.. [4]. 37, pp. 1301-1307, 1995.. R. Woltjer, G. M. Paulzen, H. G. Pomp, H. Lifka, and P. H. Woerlee, “Three hot-carrier degradation mechanisms in deep-submicron PMOSFET's,” IEEE Trans. Electron Devices, vol. 42, pp.109-115, 1995.. [5]. J. F. Zhang and W. Eccleston, “Effects of high field injection on the hot carrier induced degradation of submicrometer pMOSFET’s,” IEEE Trans. Electron Devices, vol. 42, pp. 1269-1276, 1995.. [6]. D. Writers, L. K. Han, T. Chen, H. H. Wang, D. L. Kwong, M. Allen, and J. Fulford, “Degradation of oxynitride gate dielectric reliability due to boron diffusion,” Appl. Phys. Lett., vol. 68, pp. 2094-2096, 1996.. 53.
(66) [7]. K. Nimizuka, K. Yamaguchi, K. Imai, T. Iizuka, C. T. Liu, R. C. Keller, and T. Horiuch, “NBTI enhancement by nitrogen incorporation into ultrathin gateoxide for 0.10-μm gate CMOS generation,” in Symp. VLSI Tech. Dig., 2000, pp. 92-93. [8]. X. Yu, M. Yu, and C. Zhu, “Advanced HfTaON/SiO2 Gate Stack With HighMobility. and. Low. Leakage. Current. for. Low-Standby-Power. Application,” IEEE Electron Device Lett., vol. 27, no. 6, pp. 498-501, 2006. [9]. M. Cassé, L. Thevenod, B. Guillaumot, L. Tosti, F. Martin, J. Mitard, O. Weber, F. Andrieu, T. Ernst, G. Reimbold, T. Billon, M. Mouis, and F. Boulanger, “Carrier Transport in HfO2/Metal Gate MOSFETs: Physical Insight Into Critical Parameters," IEEE Trans. Electron Devices, vol. 53, pp. 759-768, 2006.. [10]. C. S. Lai, W. C. Wu, J. C. Wang and T. S. Chao, “The Characterization of CF4 Plasma Fluorinated HfO2 Gate Dielectrics with TaN Metal Gate,” Appl. Phys. Lett. vol. 86, pp. 22905-22907, 2005.. [11] N. Shiono and T. Yashiro, “Surface state formation during long-term bias-temperature stress aging of thin SiO2-Si interfaces,” Jpn. J. Appl. Phys., vol. 18, pp. 1087-1095, 1979. [12]. K. Onishi, C. S. Kang, R. Choi, H.-J. Cho, S. Gopalan, R. Nieh, S. Krishnan, and J. C. Lee, “Charging effects on reliability of HfO2 devices with. 54.
(67) polysilicon gate electrode,” in Proc. IRPS, 2002, pp. 419-420. [13]. D. K. Schroder and J. A. Babcock, “Negative bias temperature instability: road to cross in deep submicron silicon semiconductor manufacturing,” J. Appl. Phys., vol. 94, pp. 1-18, 2003.. [14]. B. E. Deal, M. Sklar, A. S. Grove, and E. H. Snow, “Characteristics of the surface-state charge (QSS) of thermally oxidized silicon,” J. Electrochem. Soc., vol. 114, pp. 266-274, 1967.. [15]. N. Shiono and T. Yashiro, “Surface state formation during long-term bias-temperature stress aging of thin SiO2-Si interfaces,” Jpn. J. Appl. Phys., vol. 18, pp. 1087-1095, 1979.. [16]. K. Onishi, C. S. Kang, R. Choi, H.-J. Cho, S. Gopalan, R. Nieh, S. Krishnan, and J. C. Lee, “Charging effects on reliability of HfO2 devices with polysilicon gate electrode,” in Proc. IRPS, 2002, pp. 419-420.. [17] J. F. Zhang and W. Eccleston, “Positive bias temperature instability in MOSFETs,” IEEE Trans. Electron Devices, vol. 45, pp. 116–124, Jan. 1998. [18] M. Bourcerie, B. S. Doyle, J.-C. Marchetaux, J.-C. Soret, and A. Boudou, “Relaxable damage in hot-carrier stressing of n-MOS transistors-oxide traps in the near interfacial region of the gate oxide,” IEEE Trans. Electron Devices, vol. 37, no. 3, pp. 708–717, Mar. 1990.. 55 11.
(68) [19]. W. T. Lu, P. C. Lin, T. Y. Huang, C. H. Chien, M. J. Yang, I. J. Huang, and P. Lehnen, “The characteristics of hole trapping in HfO2/SiO2 gate dielectrics with TiN gate electrode,” Appl. Phys. Lett., vol. 85, no. 16, pp. 3525–3527, Oct. 2004.. [20]. R. Degraeve, A. Kerber, P. Roussel, E. Cartier, T. Kauerauf, L. Pantisano, and G. Groeseneken, “Effect of bulk trap density on HfO2 reliability and yield,” in IEDM Tech. Dig., 2003, pp. 935–938.. [21]. G. Ribes, J. Mitard, M. Denais, S. Bruyere, F. Monsieur and C. Parthasarathy, “Review of high-k dielectrics reliability issues,” IEEE Trans. Dev. Mat. Reliab. 2005, pp. 5–19.. [22] S. Zafar, A. Callegari, E. Gusev and M. V. Fischetti, “Charge trapping related threshold voltage instabilities in high permittivity gate dielectric stacks,” J. Appl. Phys., vol. 93, pp. 9298-9303, 2003. [23] J. S. Brugler and P. G. A. Jespers, “Charge pumping in MOS devices,” IEEE Trans. Electron Devices, vol. 16, , pp. 297-302, Mar. 1969. [24] S. M. Sze and Kwok K. Ng, Physics of semiconductor devices, 3rd edition. John Wiley & Sons, Inc., Hoboken, New Jersey, 2007, ch. 6. [25]. G. D. Wilk, R. M. Wallace, J. M. Anthony,. “High-k gate dielectrics: Current. status and materials properties considerations” J. Appl. Phys., 2001, vol. 89,. 56.
(69) pp. 5243-5275, [26]. Anthony S. Oates, “Reliability issues for High-k gate dielectrics” in IEDM Tech. Dig., 2003, pp. 923–925.. [27]. Dim-Lee Kwong, “CMOS integration issues with High-k gate stack” in Proc. IPFA, 2004, pp. 17-20.. [28] E. P. Gusev, V. Narayanan, S. Zafar, C. Cabral Jr., E. Cartier, N. Bojarczuk, “Charge trapping in aggressively scaled metal gate/High-k gate stacks” in IEDM Tech. Dig., 2004, pp. 729–732. [29]. B. H. Lee,. C. D. Young,. R. Hams, G. A. Brown,. R. Choi, J. H. Sim,. G. Bersuker, C. Y. Kang,. “Intrinsic characteristics of High-k decices and. implications of fast transient charging effects(FTCE)” in IEDM Tech. Dig., 2004, pp. 859–863. [30]. Dieter K. Schroder, Jeff A. Babcock, “Negative bias temperature instability: Road to cross in deep submicron silicon semiconductor manufacturing” J. Appl. Phys.,. [31]. 2003,. vol 94, pp. 1-18. 36. Sufi Zafar, “Statistical mechanics based model for negative bias temperature instability induced degradation” J. Appl. Phys., 2005, vol. 97, pp. 1-9. [32]. V. Huard, C. Parthasarathy, N. Rallet1, C. Guerin1, M. Mammase1, D. Barge, C. Ouvrard. “New characterization and modeling approach for NBTI. 57.
(70) degradation from transistor to product level” in IEDM Tech. Dig., 2007, pp. 797–800. [33]. T. Grasser, B. Kaczer ◦,. P. Hehenberger “Simultaneous extraction of. recoverable and permanent components contributing to bias-temperature instability” in IEDM Tech. Dig., 2007, pp. 801–804.. 58.
(71) Publication List International Conference Paper: [C-1]. Wei-Liang Lin, Yao-Jen Lee, Wen-Cheng Lo, King-Sheng Chen, Y. T. Hou4, K. C. Lin4, and Tien-Sheng Chao“Trapping and De-trapping Characteristics in PBTI and Dynamic PBTI between HfO2 and HfSiON Gate Dielectrics” 2008 INTERNATIONAL SYMPOSIUM ON THE PHYSICAL AND FAILURE ANALYSIS OF INTEGRATED CIRCUITS. 59.
(72) 簡 歷 (Vita) 姓名: 林威良 性別: 男 出生日: 1982 年 12 月 22 日 籍貫: 台灣 出身地: 台灣 台北市 學歷: 逢甲大學電子工程學系 學士班 20001 年 9 月-2006 年 1 月 國立交通大學電子物理研究所 碩士班 2006 年 9 月-2008 年 6 月. 碩士論文題目: 閘極介電質氧化鉿與氮氧矽鉿之可靠度研究. Study on the Reliability of HfO2 and HfSiON Gate Dielectric. 60.
(73)
數據
+7
相關文件
解答 根據圖 1.14 可知氮的陰電性(EN = 3.0)大於碳的 陰電性(EN = 2.5),故胺被極化成碳為 δ+ ,而 氮為 δ- 。.
In this paper, we propose a practical numerical method based on the LSM and the truncated SVD to reconstruct the support of the inhomogeneity in the acoustic equation with
1.4 Exponential and Logarithmic Functions 1.5 Finding Limits Graphically and Numerically 1.6 Evaluating Limits Analytically.. 1.7 Continuity and One-Sided Limits 1.8
• Concept of High Conflict Complainants, their characteristics and relationship with Personality Disorders.. • Tips in handling High Conflict
Biases in Pricing Continuously Monitored Options with Monte Carlo (continued).. • If all of the sampled prices are below the barrier, this sample path pays max(S(t n ) −
經過多次實驗後,團隊發現研發出的寡聚 物附著在一遇到高溫就會釋放出氧氣的正極材
酸性氣體(二氧化硫、二氧化氮)可以飄浮到離源頭很遠的地
Consistent with the negative price of systematic volatility risk found by the option pricing studies, we see lower average raw returns, CAPM alphas, and FF-3 alphas with higher
![HPSH [ 氧化數平衡反應式係數 ]](data:image/gif;base64,R0lGODlhAQABAIAAAP///wAAACH5BAEAAAAALAAAAAABAAEAAAICRAEAOw==)