國立交通大學
資訊工程系
碩士論文
軟體版本歷史資料發掘以驗證開放源碼外圍參與者的學習過程
Mining Version Histories to Verify the Learning Process of Legitimate
Peripheral Participants
研究生: 劉康民
指導教授: 黃世昆 教授
軟體版本歷史資料發掘以驗證開放源碼外圍參與者的學習過程
Mining Version Histories to Verify the Learning Process of Legitimate
Peripheral Participants
研究生: 劉康民 Student: Kang-min Liu 指導教授: 黃世昆 教授 Advisor: Shih-kung Hunag
國立交通大學
資訊工程系
碩士論文
A Thesis
Submitted to Department of Computer Science and Information
Engineering
College of Electrical Engineering and Computer Science
National Chiao Tung University
in partial Fulfillment of the Requirements
for the Degree of
Master
in
Computer Science and Information Engineering
June 2005
Hsinchu, Taiwan, Republic of China
中華民國九十四年六月
軟體版本歷史資料發掘以驗證開放源碼外圍參與者的學習過程
研究生:劉康民 指導教授: 黃世昆 教授
Abstract 因為程式的修改與演進過程反映軟體發展者的參與程度,版本控 制的歷史資料也呈現了發展者間的互動與軟體模組的介面關係。 基於此概念,我們以開放源碼專案(來自 sourceforge.net)為 實驗資料,利用版本控制系統的歷史紀錄,區分程式發展者的角色關 係與軟體模組的核心層次。為了呈現發展過程中的互動關係,我們將 程式發展者依照歷史紀錄與其學習過程分組,並採用「漸進式週邊參 與」(LPP)模型作為描述的方法,將軟體源碼分成「核心模組」與「非 核心模組(如「使用者介面」)」兩部份。 過去傳統上,區分軟體源碼與發展者的方法多半取決於非制式的 要素。在此論文中,我們提供發展者與模組間的關係模型,可作為分 析成員與模組間的結構。我們依此建構出發展者的網絡圖,並計算圖 上相對重要的角色關係。此網絡圖呈現核心與非核心成員的互動關係 、並核心與非核心模組的界限與介面。 關鍵詞: 核心外圍參與者, 源碼的開放界限, 開放源碼軟體發展Mining Version Histories to Verify the Learning Process of Legitimate Peripheral Participants Student: Kang-min Liu Advisor: Shih-kung Huang
Abstract
Since code revisions reflect the extent of human involvement in the software development process, revision histories reveal the interactions and interfaces between developers and modules.
We therefore divide developers and modules into groups according to the revision histories of the open source software repository, for example, sourceforge.net. To describe the interactions in the open source devel-opment process, we use a representative model, Legitimate Peripheral Partici-pation (LPP) [8], to divide developers into groups such as core and peripheral teams, based on the evolutionary process of learning behavior.
With the conventional module relationship, we divide modules into kernel and non-kernel types (such as UI). In the past, groups of developers and modules have been partitioned naturally with informal criteria. In this work, however, we propose a developer-module relationship model to analyze the grouping structures between developers and modules. Our results show some process cases of relative importance on the constructed graph of project de-velopment. The graph reveals certain subtle relationships in the interactions between core and non-core team developers, and the interfaces between kernel and non-kernel modules.
Keywords: Legitimate Peripheral Participants(LPP), Open Boundary, Open Source Software Development Process.
致謝
此論文的完成首先需要感謝黃老師對我的信任與指點,無論在何時都真 切準確地指出重點, 使得論文時有進展。也要感謝介紹黃老師給我的士 傑,士傑對於各方面的涉獵一直是使我眼界大開。 還以實驗室學長學弟的 建議與支持,使我沒有什麼後顧之憂。 也要感謝常常聽我重複述說研究方 面進展、苦樂互談的各位朋友們。 雖然有時辛苦,不過還是撐過來了。 這兩年來感謝各位了。Contents
1 Introduction 9 1.1 Background . . . 9 1.2 Motivation . . . 9 1.3 Objective . . . 11 2 Methods 12 2.1 Basic Definitions . . . 122.2 Relative Importance Algorithms . . . 13
2.3 Project Characteristic Function . . . 14
3 Implementation 16 3.1 Fetch Revision Data . . . 16
3.2 Normalize Revision Data . . . 17
3.3 Analyzing The Data . . . 18
3.4 Installation Dependencies . . . 19
4 Results and Discussions 20 4.1 Developer Social Network . . . 20
4.2 Project Kernel Statistics . . . 21
4.3 Project Characteristic Function . . . 22
5 Related Work 29
6 Conclusion 31
List of Figures
1 The awstats developer social network . . . 23
2 The phpmyadmin developer social network . . . 23
3 The moodle developer social network . . . 24
4 The filezilla developer social network . . . 25
5 The gallery developer social network . . . 25
6 The bzflag developer social network . . . 26
7 Slashcode Characteristic Function . . . 27
8 Pugs Characteristic Function . . . 28
List of Tables
1 Introduction
1.1 Background
Open source software (OSS) has been one of the most important topic for past ten years. Communities have contributed many qualitative and useful software utilities and libraries. Nevertheless, the reason that OSS has gained so much activity still wants to be delineated.
Many researchers have explored and tried to explain the differences between the software processes of OSS and conventional approaches. Among them, Eric S. Raymond was the first to publish his findings in the noted Cathedral and Bazaar model [14].
Ye and Kishida also proposed an OSS development process model [20]. It is based on the evolving nature of a community with projects and a learning theory
--Legitimate Peripheral Participation (LPP), proposed by Lave and Wenger [8]. In
[20], an OSS project may be associated with a virtual community, and developers may play certain roles in both the community and the project. During the learning process, the role of each member of the virtual community co-evolves in both the project and the community.
1.2 Motivation
Because of the success of Linux, GNU, Apache, and tens of thousands of open source development (OSD) projects in sourceforge.net, we are able to obtain public data easily, and review the process of OSD and compare it with conventional approaches to proprietary software development. It came to our mind that these
among of data source should be able to be used as a quantitative evidence of proof of theories about OSD.
Few of the criteria of conventional software engineering methods, which are concerned with process models and control of schedules, can be applied in open source project development. In OSD, developers of a project may work together without knowing each other and build a successful system with millions of users worldwide. Although OSD does not appear to allow complete control and schedul-ing over software, it works well in reality. Besides, OSD projects often release new versions of software that are comparable to high quality proprietary software with similar functions. Such sustainable nature of the OSD process is worth ex-ploring. Nonetheless, although OSD has low initial deployment costs, there may be higher long-term costs.
In our experience, many open source developers do not contribute a great deal to OSD. They only do relatively minor work, such as fixing non-critical bugs, and do not make major contributions to the development process. Even so, although such minor contributors form weak links in developer networks, they are often a major driving force behind a project growing larger. This is similar to the small-world phenomenon [18].
The project-community evolutionary model, proposed by Ye and Kishida [20], states that any change of roles in the community maps to a change of roles in the project. The model also lists eight possible project roles and states that users, or peripheral developers, change their roles by learning about the project in detail, and are therefore central to the project. Nevertheless, most of development process statements adapts qualitative approach. Which means more measurements or more measurement methods are required in this field to describe OSD process
more precisely.
1.3 Objective
In this paper, we propose a quantitative approach to analyzing the data of open source project development in order to evaluate the role changes of developers in a project. Through this analysis, we verify the learning process of LPP and provide a quantitative measurement for open source development models. The major advantage of our approach is that it is fully automatic. Manual verification is not required in the middle of the data mining process.
We believe that, in each open source project, there is a large amount of source code that does not need to be open. The success of an open source project depends on only a small proportion of its code. This would allow commercial developers of software to work with peripheral teams in the development of products without loosing control of their source codes. Such openness boundary could be used as a measurement of any open source project.
Since we can measure the openness of any project, ideally we wish to construct a hybrid software developing process for proprietary software vendor to embed OSD into their process and embrace the advantage of public developing without worrying loosing their authority of project source code. OpenDarwin project is a good example for this thought. It's the open source base of Apple Mac OS X.
2 Methods
2.1 Basic Definitions
We use a similar approach to that of Luis et al [10]. For each target project, we perform network analysis of its version control repository. Our main source of data is sourceforge.net, which provides a full CVS repository archive.
From revision histories, we can construct social network graphs that represent the relations between developers of different parts of a project. The evolutionary pattern of a social network reflects some process features and anomalies during a project's evolution. With network analysis methods, we can measure the relative importance of each developer, and classify each one's role.
For notation convenience, for any project in discussion, define these sets:
D ={d|d is a directory in source code} P ={p|p is a developer}
Then for each developer, we can have a set of directories that he/she has modified:
D(p|p ∈ P ) = {d|d ∈ D, p has modified d}
For each directory d found in the revision log, we define a developer set D(d), which presents the developers who has modified directory d.
D(d|d ∈ D) = {p|p ∈ P d ∈ D(p)}
Formally, we define a developer social network graph GP as following:
GP = {VP, EP}
VP = P
EP = {(p1, p2)|∃d ∈ D s.t p1∈ D(d) and p2 ∈ D(d)}.
In [10], the affiliation graph group is associated with the source code modules, while our group is associated with the directory. Our approach requires relatively less prior knowledge about the source code itself, and is more independent in terms of programming language; hence, it does not require human involvement to decide the affiliation group, as every step can be processed automatically.
We use the following definitions in our analysis.
2.2 Relative Importance Algorithms
Distance Centrality (Dc) [16] : also called closeness centrality. The higher the
value of Dc, the closer the vertices are to each other. Given a vertex, v, and a
graph , G, Dcis defined as:
Dc(v) =
1 P
t∈GdG(v, t)
For each project, we first generate the developer social network, then compute the distance centrality of each node. From the distribution of the centrality val-ues, we can discover the properties of different stages in the project development process.
HITS algorithm [6] is also a proper way to calculate the relative importance
of vertices on a network. For each developer d, we calculate the authority weight
x<p> and hub weight y<p>using following definition:
x<d> ← X q:(q,d)∈Ed y<q> y<d> ← X q:(d,q)∈Ed x<q>
2.3 Project Characteristic Function
After the importance of developers are determined, we choose the group of devel-opers with highest importance to be the core of project team, expressed by Pcore,
while others are relatively to be non-core, or peripheral, expressed by Pnon−core.
We then use this information to decide the kernel portion of project source code, which are only modified by core developers. The kernel portion is defined here:
While
Dnon−kernel = {d|∃p ∈ Pnon−cores.t. d ∈ D(p)}
Although such intuitive decision of core may not be wrong, it could be refined with the consideration of project-dependent factors. Therefore, we propose a
project characteristic function:
f (x) = y|y = "Kernel Ratio" with respect of "Core Ratio" x
That is, since we don't know the best ratio core for a specific project, we just give the whole picture. With this function we may tell different processing characteristic of each project, and then decide a better core portion of team. Since this function is defined on two ratios, the domain and field are naturally from 0 to 1.
3 Implementation
The implementation of this work is done with the Perl programming language. Its general variable type provide and existing numerous Perl modules provides both easy way to define abstract data type and useful libraries.
3.1 Fetch Revision Data
Sourceforge.net provide nightly repository tarballs for people to download, which has the following URL pattern:
http://cvs.sourceforge.net/cvstarballs/unixname-cvsroot.tar.bz2. Where the unixname of a project is the project id for sourceforge projects. For example, project Gaim has unixname gaim, the URL of its CVS repository tarball is then
http://cvs.sourceforge.net/cvstarballs/gaim-cvsroot.tar.bz2. One may also use anonymous CVS access for a project by setting CVSROOT to:
:pserver:[email protected]:/cvsroot/unixname But it's more preferred to download the whole repository then analysis it on-line. Doing analysis on-line is very time-consuming and thus not recommended. Unless your target project provides only CVS anonymous access.
Considering that many projects start using more modern version control system such as Subversion or Perforce, it would be come an issue if we want to analyze all these project not using CVS. There are already some conversion tools for people to convert repository between Subversion, Perforce, and CVS. Thus we would normalized all the project repositories into a single format so that it's easier to
perform further analysis.
3.2 Normalize Revision Data
In this work, we use SVK [9] as the normalization tool for analyzing data from hybrid revision control systems. As a version control client, SVK is capable of synchronizing with different kinds of servers, such as CVS, Subversion, and Per-force. SVK is based on Subversion system, and use the same internal file-system as Subversion to store revision data. Remote CVS and Perforce repositories are converted into Subversion internal storage format, while the revision structure are logically equivalent to the original ones.
Besides providing interoperability between multiple revision control systems, SVK also provide comprehensive program libraries for people to manipulate SVK system in their own program. Anyone could use Perl language to manipulate SVK as a subsystem, or reusable components.
The underlying library which normalize revision data from different revision control systems is called VCP. VCP stands for ``Version Copy'', which is a public domain library. It has been, however, not maintained from the original author for a while. The actual version that works well with SVK is maintained by Autrijus Tang.
VCP is required for importing revision data from CVS or Perforce system, but not required for importing a subversion repository. SVK supports Subversion repository naturally.
Besides interoperability, SVK also mirror every revision data locally. There-fore it saves time to perform analysis process for it usually requires to look up a repository over and over multiple times.
3.3 Analyzing The Data
Programs analyzing revision data mostly involve three paragraphs. First, ini-tialize a SVK object with given repository path. Second, traverse revision logs and extract only wanted data. Third, performing further data transformation and analyzing on extracted data.
Since main analysis is in a network-based approach, it is necessary to use some abstract data structure to present graphs. A handy Graph class from CPAN is used to represent all kinds of intermediate graph during analyzing process. Graph::SocialMap is written for easy construction social networks graphs.
After several graph objects are constructed, the next step is to perform network-based analysis on these graphs. Algorithm::SociaNetwork is written to have several useful algorithm on graphs that could be used to analyze social networks. Algorithm::HITS or Algorithm::PageRank is also there for people who want to try different algorithms on network analysis.
For non-network-based approach, people may also use Log::Accounting::SVK to generate basic statistic counting and distribution result of a SVK repository. It depends on Algorithm::Accounting module the accumulate the distribution of each different values in many fields.
The visualization in this work is done by GraphViz graph visualizer made by AT&T Lab. Also there is a corresponding Perl module with the same name that could be found on CPAN. The GraphViz Perl module is not a reimplementation of GraphViz program. Instead, it is a bridge of GraphViz program. It provides Perl interface and invoke GraphViz program to render graph output according to whatever given by it's Perl interface.
3.4 Installation Dependencies
All the analyzing scripts and libraries are written in Perl, except for the SVK, which depends on Subversion C library. Perl 5.8.0 or higher is recommended. For SVK installation details, see http://svk.elixus.org website.
4 Results and Discussions
4.1 Developer Social Network
Figure 1 shows the developer social network for the project awstats [3]. Although this is a typical small project with only three developers, it has been very active according to sourceforge.net's records. Its social network is fully connected, which means that all developers co-develop at least one directory. Project
php-myadmin [12] also has this kind of developer social network (Figure 2). In such a
network, it is impossible to determine the importance of each developer, because they all have exactly the same attributes. Hence, we say that each developer plays the same role in the development process.
The above network pattern may reflect a possible flaw in our analytical method, grouping developers based on directories is not detailed enough. Nonetheless, it is also possible that the design of the software lacks proper modularity so that developers cannot modify a feature without modifying many directories in the source code.
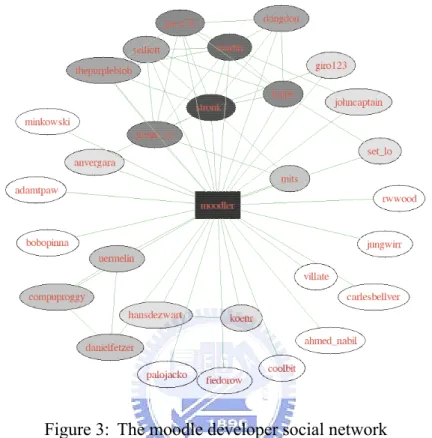
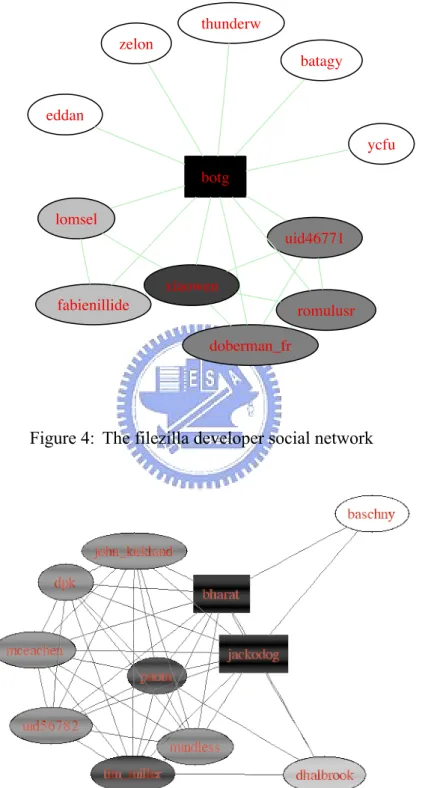
The result of project moodle [4] (Figure 3) demonstrates another extreme case of social network patterns. A vertex's color represents its distance centrality value; the darker the color, the higher the centrality value. Nodes with the highest centrality values are rectangular in shape. The central portion of a node has only one vertex and all other vertexes connect directly to that vertex. There are very few connections between non-central vertexes. Project filezilla [7] (Figure 4) is another example of this kind of pattern.
Projects with this pattern start with a few developers deciding to work together, and they keep control of the source code as the project grows bigger. Non-central
developers only make relatively minor contributions.
Nearly all projects with more then 10 developers have the same social network pattern as project gallery [11] (Figure 5). In such a pattern, only a small group of developers have a relatively high distance centrality, i.e., they are the center of the developer relationships; other developers play peripheral or intermediate roles. Project bzflag [15] (Figure 6) is another example of this kind of pattern.
Such social networks have many distance centrality values, which reflect many different kinds of project roles. Developers with high centrality values play im-portant roles (core members or active developers), while those with lower values play peripheral roles (peripheral developers or bug fixers.)
Ye and Kishida [20] propose a project-community co-evolution process model, and define eight different roles in an open source project: Project Leader, Core
Member, Active Developer, Peripheral Developer, Bug Fixer, Bug Reporter, Reader, and Passive User. Although, from the repository mining process, we
are unable to associate each developer with a certain role, we can at least group developers into two large categories: active developer and above; and peripheral developer and below.
4.2 Project Kernel Statistics
Figure 4.2 is a list of 8 analyzed projects from either sourceforge.net or stan-dalone repositories of their own. The column ''% Core'' presents the relative size of core team members in the project. Project with fewer developers may have a higher ratio of core team size, but the core team size doesn't grow larger when the number developers becomes more.
code, also the portion that is only modified by core team member. For projects with fewer developers the kernel portion is usually larger then the non-kernel portion. As the project source code grows larger, more and more contributions are made by non-core members
The column ''% Kernel Modifications'' presents the ratio of number of modifi-cations made on kernel. Apparently for projects with more developers, this ratio is smaller, because non-core members are also lot more then core members. These numbers tell us that contributions made by non-core members take very big part in big projects.
But core developers may still contribute to non-kernel portion of project source code, not all modifications on the non-kernel portion are made by non-core devel-opers. We can state that, during the developing process of a project, non-kernel portion of source code have more activity then the kernel portion. Since non-kernel source code is also contributed by non-core developers, it is where the advantage of public developing process show up. While the kernel portion is still fully belonged to core developers.
Put it all together, we can state that, while having the advantage of public
development process, core team still have a certain degree of authority of the project. Although the size of kernel may depends on more detail of project process,
we successfully prove the existence of such kernel boundary.
4.3 Project Characteristic Function
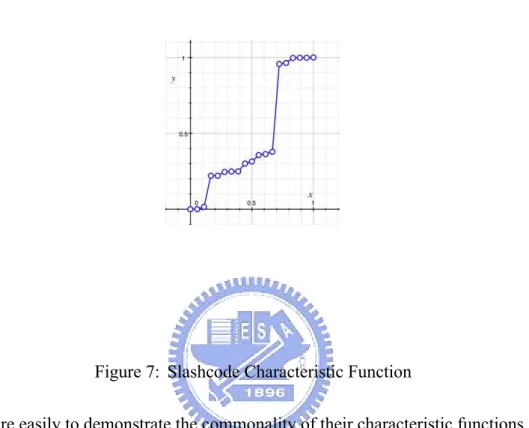
For better boundary of core, we can refer to the result of project characteristic func-tion. Figure 4.3, 4.3 and 4.3 are the characteristic functions of project slashcode, gcc, and pugs [17]. These mid-large projects have more developers then others
Figure 1: The awstats developer social network ne0x glund lem9 gandon uid52400 mikebeck armel spiggy swix korakot staybyte uid81396 robbat2 loic1 rabus uid23515 garvinhicking nijel
Figure 3: The moodle developer social network
Project Developers % Core % Kernel % Kernel Modifications
gcc 227 3.96% 10.66% 1.90% Pugs 62 1.56% 7.68% 5.43% slashcode 18 16.67% 22.06% 5.36% RT 11 9.91% 57.83% 54.13% irssi 9 11.11% 88.63% 64.87% OpenVanilla [2] 6 50% 96.12% 73.37% Qooing 6 16.67% 69.05% 45.63% awstats 4 25% 78.21% 79.41%
botg eddan thunderw batagy doberman_fr ycfu zelon uid46771 xiaowen romulusr fabienillide lomsel
Figure 4: The filezilla developer social network
chestal davidtrowbridge timriker atupone brlcad larsl dbrosius rae mmu_man bzflag jeffm2501 journey nafees galkire micahjd crs23 cyberpi shkoo eddienull trepan michaelh20 valoche uid125564 dbw192 dtremenak cobraa1 bz-akira cjmandrake
Figure 7: Slashcode Characteristic Function
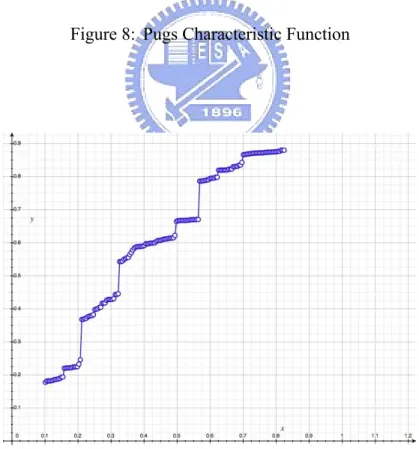
and are easily to demonstrate the commonality of their characteristic functions. Slashcode project has 18 developers, on the characteristic function Figure 4.3, it shows that developers are roughly split into 3 clusters according to the platforms of the ladders shape. Pugs [17] project has 62 developers and also has 3 clusters, although the curve shape is more smooth. Project gcc has 227 developers, and has 8 clusters we can be easily seen from the characteristic function figure 4.3.
Figure 8: Pugs Characteristic Function
5 Related Work
In 1999, Eric Steven Raymond proposed the community-based development model in his famous work Cathedral and Bazaar [14]. In this work, he takes the devel-opment process of the fetchmail project as an example and proposes the bazaar process development model.
Ye and Kishida [20], state that, in an open source project, ``Every user is a potential developer,'' and propose a role hierarchy to show that participation in a project is actually a learning process for both peripheral users and core developers. Project Bloof [13] gives a statistical revision log analysis for the source code evolution of a software project. The aim of Bloof is to help people comprehend software systems and the underlying development processes.
Project CVSMonitor [5] provides a more comprehensive presentation of revi-sion analysis of the CVS repository, a verrevi-sion control system that has been widely used in the last ten years.
Zimmermann et al [21] recently proposed that mining version control histories can be helpful during the project development process, as they give programmers information about all the changes of a given revision.
White and Smyth [19] discuss several methods for analyzing large and complex network structures. In their experiments, they evaluated the different properties of many algorithms on toy graphs and demonstrated how their approach can be used to study the relative importance of nodes in real-world networks, includ-ing a network of interactions among the September 11th terrorists, a network of collaborative research in biotechnology among companies and universities, and a network of co-authorship relationships among computer science researchers.
Scacchi and Jensen [1] use techniques that exploit advances in artificial intel-ligence to discover the development processes of publicly available open source software development repositories. Their goal is to facilitate process discovery in ways that use less cumbersome empirical techniques and offer a more holistic, task-oriented process than current automated systems provide.
6 Conclusion
In this work, we use social network analysis methods to analyze the developer social network of a project created from the project's revision history.
Developers involved in the revision process reveal their skill and familiarity with the source modules by different degrees of interfacing and interaction with core members. From the revision histories, we build a link structure between de-velopers and code modules and analyze the relationships between these structures to determine their level of involvement with core teams and kernel modules. The extent of developers' involvement can be ranked.
From the ranking results, we propose a potential boundary between conceptual kernel and non-kernel modules. This boundary gives a clear indication of the degree of source code openness in joint development projects involving core and none-core teams of developers.
Although our verification of LPP process in Ye and Kishida's work [20] is not very accurate, we can at least split project developers into two groups: core and peripheral. This supports our conjecture that even in an open source project, there is a part of the source code that can be retained by core members only. With further graph-based network analysis, we believe that it would be possible to achieve more accurate results. Using more possible meta-data or derived data from revision history could also be helpful in the argument.
Even though the verification work is not very successful, we still make more improvement based on the result of social network analysis. We successfully construct a ``project character function'' to represent the developer clustering of any given project.
At the end we discussed about the statistic on several projects we analyzed, and conclude that, while having the advantage of public development process, core team still have a certain degree of authority over the project.
References
[1] Walt Scacchi Chris Jensen. Data mining for software process discovery in open source software development communities. In Proc. Workshop on
Mining Software Repositories, page 96, 2004.
[2] Lukhnos d. Liu and Kang min Liu. Openvanilla is a vanilla input method framework., 2004. http://openvailla.org/.
[3] Laurent Destailleur. Awstats is a free powerful and featureful server logfile analyzer, 2000. http://sourceforge.net/projects/awstats/.
[4] Martin Dougiamas and Eloy Lafuente. Moodle is php courseware aiming to make quality online courses (eg distance education) easy to develop and conduct., 2001. http://sourceforge.net/projects/moodle/.
[5] Adam Kennedy. Project cvsmonitor. cvsmonitor is a cgi application for looking at cvs repositories in a much more useful and productive way, 2002. http://ali.as/devel/cvsmonitor/.
[6] Jon M. Kleinberg. Authoritative sources in a hyperlinked environment.
Jour-nal of the ACM, 46(5):604--632, 1999.
[7] Tim Kosse. Filezilla is a fast ftp and sftp client for windows with a lot of features. filezilla server is a reliable ftp server, 2001. http://sourceforge.net/projects/filezilla/.
[8] J. Lave and E. Wenger. Situated Learning: Legitimate Peripheral
[9] Chia liang Kao. svk is a decentralized version control system written in perl. it uses the subversion filesystem but provides additional, powerful features., 2003. http://svk.elixus.org/.
[10] Luis Lopez-Fernandez, Gergorio Robles, and Jesus M. Gonzales-Barahona. Applying social network analysis to the information in cvs repositories. In
MSR2004, 2004.
[11] Bharat Mediratta and Chris Smith. Gallery. a slick, intuitive web based photo gallery with authenticated users and privileged albums, 2000. http://sourceforge.net/projects/gallery/.
[12] Oliver M¨uller, Marc Delisle, and Lo¨ic Chapeux. phpmyadmin is a tool written in php intended to handle the administration of mysql over the web, 2001. http://sourceforge.net/projects/phpmyadmin/.
[13] Lukasz Pekacki. Project bloof. bloof is an infrastructure for analytical pro-cessing of version control data, 2003. http://sourceforge.net/projects/bloof/. [14] Eric Steven Raymond. The Cathedral and the Bazaar: Musings on Linux
and Open Source by an Accidental Revolutionary. O'Reilly, 1999.
[15] Tim Riker and David Trowbridge. Opensource opengl multiplayer multi-platform battle zone capture the flag. 3d first person tank simulation, 2000. http://sourceforge.net/projects/bzflag/.
[16] Gert Sabidussi. The centrality index of a graph, volume 31, pages 581--603. Psychometrika, 1966.
[18] D. Watts and S. Strogatz. Collective dynamics of small-world networks.
Nature, page 393, 1998.
[19] Scott White and Padhraic Smyth. Algorithms for estimating relative impor-tance in networks. In KDD '03: Proceedings of the ninth ACM SIGKDD
international conference on Knowledge discovery and data mining, pages
266--275. ACM Press, 2003.
[20] Yunwen Ye and Kouichi Kishida. Toward an understanding of the motivation open source software developers. In ICSE '03: Proceedings of the 25th
International Conference on Software Engineering, pages 419--429. IEEE
Computer Society, 2003.
[21] T. Zimmermann, P. Weigerber, S. Diehl, and A. Zeller. Mining version histories to guide software changes. In 26th International Conference on