JOURNAL OFCLINICALMICROBIOLOGY, Sept. 2006, p. 3130–3133 Vol. 44, No. 9 0095-1137/06/$08.00⫹0 doi:10.1128/JCM.00984-06
Copyright © 2006, American Society for Microbiology. All Rights Reserved.
Quantitative Assessment of Serum NV-F Virus DNA Concentrations
in Samples from Patients Coinfected with Hepatitis B or C Virus
Chao-Wei Hsu,
1Ju-Chien Cheng,
2and Chau-Ting Yeh
1,3*
Liver Research Unit, Chang Gung Medical Center, Taipei, Taiwan1; Department of Medical Technology, China Medical College,
Taichung, Taiwan2; and Chang Gung University College of Medicine, Taoyuan, Taiwan3
Received 11 May 2006/Returned for modification 3 July 2006/Accepted 5 July 2006
A novel hepatotropic virus, named NV-F virus, was recently identified. The clinical information for this virus is still scarce. Using PCR assay, NV-F viral DNA (NV-F-DNA) was detected in 12 of 50 (24%) hepatitis C virus (HCV)-infected patients (HCV-coinfected [HCVCI] group), 34 of 250 (13.6%) hepatitis B virus (HBV)-infected patients (HBV-coinfected [HBVCI] group), and 28 of 100 (28%) non-A-to-E (NAE) hepatitis patients. Basic clinical parameters were not significantly different among the three groups. By use of a PCR-based quantitative assay, the NV-F-DNA concentration was found to be above the detection limit (1.2ⴛ 105
copies/ml) in 12/12 (100%) HCVCI patients, 14/34 (41.2%) HBVCI patients, and 4/28 (14.3%) NAE patients. The median serum NV-F-DNA concentration was 9.3ⴛ 105
copies/ml in HCVCI patients, but it was below the detection limit in HBVCI and NAE patients (P values were 0.0045 and 0.0001, respectively). Stepwise multiple regression analysis identified the presence of anti-HCV as an independent factor for NV-F-DNA concentrations ( ⴝ 6.2ⴛ 109
; Pⴝ 0.0245). In HBVCI patients, the NV-F-DNA concentration was inversely correlated with the HBV DNA concentration. The median NV-F-DNA concentration was below the detection limit in patients with HBV DNA concentrations above 1.4ⴛ 105
copies/ml, but it was 1.58ⴛ 106
copies/ml in patients with HBV DNA concentrations below 1.4ⴛ 105
copies/ml (Pⴝ 0.030). In conclusion, NV-F-DNA concentrations were higher in HCVCI patients. A reciprocal relationship was found between NV-F-DNA and HBV DNA concentrations in HBVCI patients, indicating the presence of viral interference between these two DNA viruses.
Viral hepatitis is mostly caused by one of five known hepa-titis viruses, namely, hepahepa-titis A virus (HAV), hepahepa-titis B virus (HBV), hepatitis C virus (HCV), hepatitis D virus (HDV), and hepatitis E virus (HEV) (2, 9). With the help of commercially available tests as well as molecular diagnostic tools, the etiol-ogy of over 95% of patients with chronic viral hepatitis can be determined. Nevertheless, in the remaining small portion of patients, the causes of chronic hepatitis remain unknown. In the United States, no definite etiology could be found for 4.9% of patients with chronic hepatitis or cirrhosis, cases which were termed “cryptogenic” (8). Half of these patients had received blood transfusions, suggesting a viral etiology. In another re-port, patients with chronic non-A-to-C hepatitis were found to have enhanced HLA expressed in their liver samples, impli-cating a viral etiology (14). Furthermore, therapeutic trials using alpha interferon to treat chronic non-A-to-C hepatitis resulted in a response level of about 50%, again suggesting a viral pathogen (19).
For sporadic acute hepatitis, the proportion of patients with disease of undetermined etiology is even higher. In Taiwan, 15.9% of hospital inpatients with acute hepatitis and 9.7% of patients with fulminant hepatitis were categorized as non-A-to-E (NAE) hepatitis patients (3, 4). Similarly, in Japan, 20% of patients with acute sporadic hepatitis were diagnosed as NAE patients and 2 of 16 (12.5%) patients with fulminant or severe acute hepatitis were categorized as NAE patients (7). Collectively, it can be deduced that in about 5% of chronic
hepatitis, 15 to 20% of acute sporadic hepatitis, and 10% of fulminant hepatitis cases, unrecognized pathogens remain to be discovered. Inspired by these observations, scientists struggled to unearth the theoretically existing hepatitis viruses. As a result, several new viruses were found, including GB virus C, TT virus, and SEN virus (12, 13, 18). Although these discoveries were highly significant in the field of molecular virology, epidemiolog-ical data failed to verify a causative role of these viruses in human hepatitis (1, 5, 6, 10, 16). Most studies showed that these viruses infected a high percentage of healthy individuals who did not have hepatitis. Furthermore, some investigators argued that GB virus C was in fact not a hepatotropic virus (6, 10).
Recently, a novel hepatotropic virus, named NV-F, was dis-covered (20). Initial epidemiological study indicated that only 2.8% of healthy individuals carried this virus, whereas 24.6% of patients with NAE hepatitis were seropositive for the NV-F sequence. In this study, we have developed a semiquantitative method to measure the serum concentrations of NV-F viral DNA (NV-F-DNA) in patients with NV-F virus infection. Fur-thermore, clinical parameters were compared among NV-F virus-infected patients with or without HBV or HCV coin-fection.
MATERIALS AND METHODS
Patients.Under informed consent, the remaining aliquots of serum samples previously submitted for biochemistry tests in patients visiting Hepatitis Clinics in Chang Gung Medical Center were collected for this study. A total of 400 patients were included. All patients had histories of mild serum transaminase elevation. Among them, 250 patients were positive for serum HBV surface antigen (HBsAg), 50 patients were positive for antibody against HCV (anti-HCV), and 100 patients were negative for both HBsAg and anti-HCV. All patients were tested for serum NV-F-DNA, for which results were positive for 34 of 250 (13.6%) HBV patients, 12 of 50 (24%) HCV patients, and 28 of 100 (28%)
* Corresponding author. Mailing address: Liver Research Unit, Chang Gung Medical Center, 199, Tung Hwa North Road, Taipei, Taiwan. Phone: 886-3-3281200, ext. 8102. Fax: 886-3-3282824. E-mail: [email protected].
NAE patients. These 74 patients with positive serum NV-F-DNA were subjected to clinical analysis. Gender, age, aspartate aminotransferase (AST), alanine aminotransferase (ALT), total bilirubin, alpha-fetoprotein (AFP), leukocyte counts, hemoglobin concentrations, platelet counts, and a clinical diagnosis of liver cirrhosis were documented. A clinical diagnosis of liver cirrhosis was de-fined as the presence of liver cirrhosis by ultrasound examination, plus at least one of the following: spider nevi, gynecomastia, esophageal varices (by upper gastrointestinal endoscopy), and palmar erythema. Ultrasound diagnosis for liver cirrhosis was made according to an established scoring system (11).
Results from all patients were negative for immunoglobulin M (IgM) class antibody against HAV HAV), antibody against hepatitis D virus (anti-HDV), IgM class antibody against HBV core antigen (anti-HBc), and HEV RNA. None of these patients were alcoholic, and no known hepatotoxic medi-cine had been taken. Patients with fatty livers were not excluded from this study. Autoimmune markers, including nuclear antigen, smooth muscle anti-gen, and anti-mitochondrial antianti-gen, were all negative. Test results for other virological markers, including antibody for human immunodeficiency virus, IgM class antibody for Epstein-Barr virus, and IgM class antibody for cytomegalovi-rus, were all negative.
Serology.HBsAg, IgM anti-HAV, IgM anti-HBc, and anti-HDV were assayed using radioimmunoassay kits (Ausria-II, HAVAB-M, and anti-delta; Abbott Laboratories, North Chicago, IL). Anti-HCV was detected using an enzyme immunoassay kit (HCV-II; Abbott laboratories). HCV RNA was quantified using a COBAS Amplicor HCV monitor test (version 2.0; Roche Diagnostics, Branchburg, NJ). The detection limit was 1.44⫻ 103copies/ml. HBV DNA was
quantified using a hybrid capture assay (Digene Hybrid Capture II HBV DNA test; Digene Corp., Gaithersburg, MD). The detection limit was 1.4⫻ 105
copies/ml. The method for HEV RNA detection was described previously (3, 4). Detection of NV-F-DNA.Serum (100l) was mixed with 300 l of buffer (13.3 mmol/liter Tris-HCl, pH 8.0; 6.7 mmol/liter EDTA; 0.67% sodium dodecyl sul-fate; 133g/ml proteinase K) and incubated at 55°C for 4 h. Two phenol-chloroform extractions were followed by one phenol-chloroform extraction, and DNA was precipitated with cold ethanol. The precipitate was dissolved in 20l of Tris-EDTA buffer (10 mmol/liter Tris-HCl, pH 8.0; 1 mmol/liter EDTA). PCR was performed in 100l of a mixture containing 10 l of DNA, 2 units of Super Tag (HT Biotechnology, Cambridge, United Kingdom), 200 mol/liter de-oxynucleotide triphosphate, 100 pmol of each primer, and the provided reaction buffer. The primers were NV-Lo (5⬘-TGTTGGTGGCACAAAGCCCC-3⬘) and NV-Ro (5⬘-CTTTGTGGTCTCGCTCTCTC-3⬘) for the first-step PCR and NV-Li (5⬘-GCAAAGTTGGCAACCCCCGC-3⬘) and NV-Ri (5⬘-CTCCAGGC CCGGAGCAGAAG-3⬘) for the second-step PCR. The reaction was allowed to proceed at 94°C for 1 min, 60°C for 1 min, and 72°C for 1 min in each cycle. The amplification was done for 30 cycles in a DNA thermal cycler (Perkin-Elmer Cetus, Norwalk, CT). Two steps of PCR (nested) were performed.
Quantitative assay for NV-F-DNA.A fragment of NV-F sequence was isolated using restriction enzyme digestion from our original NV-F clone and was sub-sequently inserted into the pCR2.1-TOPO vector (Invitrogen, Carlsbad, CA). Single-stranded PCR was subsequently performed using only the NV-Lo primer. The PCR was performed in 100l of mixture containing 1 pg of DNA, 2 units of Super Tag (HT Biotechnology, Cambridge, United Kingdom), 200mol/liter deoxynucleotide triphosphate, 50 pmol of the single primer, and the provided
reaction buffer. The reaction was allowed to proceed at 94°C for 1 min, 60°C for 1 min, and 72°C for 1 min in each cycle for 40 cycles. A series of standard controls using the single-stranded NV-F sequence were made to the concentrations of 1010
copies/ml to 101
copies/ml with tenfold serial dilution. The quantity was determined by spectrophotometry, and the copy numbers were calculated ac-cordingly. All samples, including the standard controls, were subjected to one-step PCR as described in the previous section. Subsequently, 30l of the PCR products was submitted to agarose gel electrophoresis and Southern blot anal-ysis. A digoxigenin-labeled probe was generated according to a published pro-tocol. The signal was detected by a DIG luminescent detection kit (Boehringer Mannheim, Germany). The density of the signal was read by a computer-assisted densitometer (imaging densitometer, model GS-670; Bio-Rad). To plot out the standard curve, all standards were tested in triplicate with the percent coefficient of variation (standard deviation/mean) kept within 15%.
Statistical analysis.Results were given as means⫾ standard deviations or medians (ranges) for nonparametric data. Analysis was conducted using the t test, the Mann-Whitney U test, the chi-square test with Yates’ correction, and Fisher’s exact test as appropriate. All statistical testing was two tailed at the 5% level. A stepwise multiple regression model was undertaken by using a stringent
P value for entry (P⫽ ⬍0.05) and exit (P ⫽ ⬎0.10) criteria. The overall model
fit was examined by likelihood function. Statistical analysis was carried out with the help of the Statistical Package for Social Science, version 13.0 (SPSS, Inc. Chicago, Ill.).
RESULTS
Basic clinical data for patients infected by NV-F virus. Re-sults from 74 patients were positive for NV-F viral DNA. Among them, 34 were coinfected by HBV (HBVCI) (positive for HBsAg), 12 were coinfected by HCV (HCVCI) (positive for anti-HCV), and 28 were NAE patients. The clinical parameters, including gender, age, AST, ALT, total biliru-bin, AFP, leukocyte counts, hemoglobin concentrations, platelet counts, and a clinical diagnosis of liver cirrhosis, were not significantly different among the three groups of patients (P⬎ 0.05) (Table 1).
Quantitative assessment of NV-F viral DNA.By use of serial standard controls, a standard curve was plotted for Fig. 1. Although the limit of percent coefficient of variation (standard deviation/mean) of each point was set to be within 15%, a range of 0 to 10% was achieved. The standard control with 106
copies/ml always gave a positive and clear signal, whereas the standard control with 105 copies/ml sometimes resulted in a
negative signal. Repeated testing indicated that a control with 1.2⫻ 105copies/ml was always detectable. The lower limit of
this assay was thus set at 1.2⫻ 105 copies/ml. A polynomial
TABLE 1. Basic clinical data for NV-F virus-infected patients
Parameter
Value of parameter for group
HBV coinfected HCV coinfected NV-F virus only
No. of patients 34 12 28 Male/female 25/9 7/5 17/11 Age (yr)a 44.1⫾ 10.6 42.8⫾ 16.0 51.6⫾ 15.1 AST (U/liter)b 25.5 (14–499) 39.5 (22–94) 29 (12–1,708) ALT (U/liter)b 32 (9–1,468) 55.5 (10–244) 30.5 (10–3,157) Bilirubin concn (mg/dl)a 1.5⫾ 2.0 0.9⫾ 0.5 1.9⫾ 2.9 AFP concn (ng/ml)a 8.0⫾ 11.4 4.9⫾ 3.6 10.0⫾ 6.2c
Leukocyte count (103cells/l)a 5.4⫾ 1.9 7.3⫾ 2.4 6.0⫾ 3.1
Hemoglobin concn (g/dl)a 13.5⫾ 2.1 12.9⫾ 2.4 11.4⫾ 2.9
Platelet count (103cells/mm3)a 189.8⫾ 59.9 188.8⫾ 55.6 174.5⫾ 80.3
No. of patients with cirrhosis diagnosis (%) 5 (14.7) 3 (25.0) 6 (21.4)
aMean⫾ standard deviation. bMean (range).
cIn one patient with NV-F virus infection, AFP was 3,024 ng/ml (excluded).
equation was obtained by using MedCalc, version 8.1.0.0 (MedCalc Software, Mariakerke, Belgium). Regression analy-sis showed a good correlation (log [Y]⫽ 5.0567 ⫹ 0.0995X ⫹ 7.577X2; R2⫽ 0.98411). All samples were thus submitted for
this NV-F viral DNA concentration assay. The results showed that NV-F-DNA concentration was above the detection limit (1.2⫻ 105 copies/ml) in 14 of 34 (41.2%) HBVCI, 12 of 12
(100%) HCVCI, and 4 of 28 (14.3%) NAE patients. The num-ber of patients with measurable (i.e., higher than the detection limit) serum NV-F-DNA levels was significantly less in the NAE group (HBVCI group versus NAE group, P⫽ 0.02596; HCVCI group versus NAE group, P⬍ 0.0001; Fisher’s exact test). Additionally, more patients in the HCVCI group had measurable NV-F-DNA levels than did those in the HBVCI group (P⫽ 0.00036). The median NV-F-DNA concentration was 9.3 ⫻ 105 copies/ml (range, 1.3 ⫻ 105 to 3.6 ⫻ 1010
copies/ml) in HCVCI patients, but it was below the detection limit in HBVCI (range,⬍1.2 ⫻ 105to 2.72⫻ 108copies/ml)
and NAE (range,⬍1.2 ⫻ 105to 3.10⫻ 109copies/ml) patients
(HCVCI versus HBVCI group, P ⫽ 0.0045; HCVCI versus NAE group, P ⫽ 0.0001; HBVCI versus NAE group, P ⫽ 0.101; Mann-Whitney U test).
Stepwise multiple regression analysis was performed to es-timate the serum NV-F DNA concentration based on the pres-ence of the independent variables of gender, age, AST, ALT, total bilirubin, AFP, leukocyte count, hemoglobin concentra-tion, platelet count, HBsAg, anti-HCV, and clinical diagnosis of liver cirrhosis. Of these variables, gender, HBsAg, anti-HCV, and clinical diagnosis of liver cirrhosis were included as categorical variables. The result showed that the presence of anti-HCV ( ⫽ 6.2 ⫻ 109; standard error⫽ 2.7 ⫻ 109; 95%
confidence interval of  ⫽ 8.22 ⫻ 108 to 1.16 ⫻ 1010; P ⫽
0.0245) was the only independent factor for NV-F viral con-centrations.
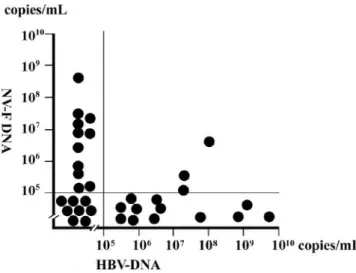
Correlation between serum NV-F-DNA concentrations and HBV DNA or HCV RNA concentrations.HBV DNA concen-trations were measured in all HBVCI patients. Of the 34 pa-tients, 15 had HBV DNA concentrations above the detection limit of the quantitative test (1.4⫻ 105copies/ml), whereas 19
had HBV DNA concentrations below the detection limit (Fig. 2). The median HBV DNA concentration was 5.2⫻ 106
cop-ies/ml (range, 3.90⫻ 105 to 6.02⫻ 109copies/ml) in the 15
patients with detectable HBV DNA. In these 15 patients, only 3 (20%) had measurable NV-F-DNA concentrations, whereas in the remaining 19 patients, 11 (57.9%) had measurable NV-F-DNA concentrations (P⫽ 0.0382; Fisher’s exact test). The median NV-F-DNA concentration was below the detection limit (range, under the detection limit to 3.69⫻ 106copies/ml)
in patients with higher and measurable HBV DNA, whereas the median NV-F-DNA concentration was 1.58 ⫻ 106
cop-ies/ml (range, under the detection limit to 4.25⫻ 108copies/
ml) in the patients with lower and undetectable HBV DNA (P⫽ 0.030; Mann-Whitney U test).
HCV RNA concentrations were measured in all HCVCI patients. Of the 12 patients, 7 had HCV RNA concentrations above the detection limit of the quantitative test (1.44⫻ 103
copies/ml), whereas 5 had HCV RNA concentrations below the detection limit. In this group of patients, all NV-F-DNA concentrations were measurable. The median NV-F-DNA concentrations were 3.29⫻ 105copies/ml (range, 1.22⫻ 105to
3.70⫻ 106copies/ml) and 4.32⫻ 106copies/ml (range, 1.58⫻
105to 7.56⫻ 1010copies/ml) in patients with lower and higher
HCV RNA levels, respectively (P⫽ 0.0873; Mann-Whitney U test).
DISCUSSION
The prevalences of NV-F virus infection in hepatitis B, hep-atitis C, and hephep-atitis non-A-E patients were 13.6, 24, and
FIG. 1. Quantitative assessment for serum NV-F-DNA concentra-tions. (A) Serially diluted standard controls were used to establish a standard curve. cps, copies; short line, the position of amplified DNA. (B) Standard curve for quantitative assessment of NV-F-DNA. The horizontal axis shows the density unit by densitometer; the vertical axis shows the copies/milliliter. (C) Samples submitted for NV-F-DNA quantitation. P, 1010copies/ml of positive standard; N,
1010copies/ml of pCR2.1-TOPO vector.
FIG. 2. Reciprocal relationship of HBV DNA and NV-F-DNA concentrations in HBVCI patients. The horizontal axis shows HBV DNA concentrations; the vertical axis shows NV-F-DNA concentra-tions.
28%, respectively. This is consistent with our previous report, in which the prevalences were 14.0, 28, and 24.6%, respectively (20). In this study, we have developed an assay for quantitative assessment of serum NV-F-DNA levels. The detection limit in this method was 1.2⫻ 105copies/ml. In the future, it will be
possible to develop a quantitative assay with increased sensi-tivity and specificity by using other methods such as real-time PCR or branched DNA probes.
Strikingly, the NV-F-DNA concentrations were significantly higher in HCVCI patients, whereas the NV-F-DNA concen-trations in NAE patients were generally below the lower limit of our quantitative assay. In addition, stepwise multiple regres-sion analysis identified the presence of anti-HCV as a predictor for high NV-F-DNA levels. The reason for this finding is not clear. It is possible that in patients with chronic HCV infection, the immune response is somewhat impaired, allowing for a second hepatitis virus, such as NV-F, to replicate better. This view is supported by recent studies indicating that regulatory T cells play roles in impaired immune responses in patients with chronic hepatitis C (17). Therefore, NV-F virus could replicate better in a host with higher regulatory T-cell function. On the other hand, in NAE patients, the host immunity has not yet been altered, thus prohibiting a high level of NV-F virus rep-lication. Alternatively, viral protein derived from one virus may enhance the replication of the other virus. For instance, HBV X protein can transactivate the promoters in the long terminal repeat of human immunodeficiency virus (15). Whether HCV viral proteins are capable of enhancing NV-F virus replication remains to be elucidated.
Although a higher percentage of HBVCI than NAE patients with measurable NV-F-DNA was found, the median con-centrations were not significantly different. However, for HBVCI patients, it was found that the HBV DNA tion was inversely correlated with the NV-F-DNA concentra-tion. Since both viruses are DNA viruses, we speculate that some common molecular resource is shared between these two viruses during viral replication and, thus, competition occurs. In summary, higher NV-F-DNA concentrations were found in HCVCI patients. A reciprocal relationship was found be-tween HBV DNA and NV-F DNA concentrations in HBVCI patients. This finding suggests a clinical role of NV-F virus infection, at least in HBVCI patients.
ACKNOWLEDGMENT
This study was supported by a grant from Chang Gung Medical Research Program (CMRPG340271).
REFERENCES
1. Akiba, J., T. Umemura, H. J. Alter, M. Kojiro, and E. Tabor. 2005. SEN virus: epidemiology and characteristics of a transfusion-transmitted virus. Transfusion 45:1084–1088.
2. Chen, D.-S. 2003. Viral hepatitis: from A to E, and beyond? J. Formos. Med. Assoc. 102:671–679.
3. Chu, C.-M., D.-Y. Lin, C.-T. Yeh, I.-S. Sheen, and Y.-F. Liaw. 2001. Epide-miological characteristics, risk factors, and clinical manifestations of acute non-A-E hepatitis. J. Med. Virol. 65:296–300.
4. Chu, C.-M., S.-M. Lin, S.-Y. Hsieh, C.-T. Yeh, D.-Y. Lin, I.-S. Sheen, and Y.-F. Liaw.1999. Etiology of sporadic acute viral hepatitis in Taiwan: the role of hepatitis C virus, hepatitis E virus and GB virus-C/hepatitis G virus in an endemic area of hepatitis A and B. J. Med. Virol. 58:154–159.
5. Cossart, Y. 2000. TTV—a virus searching for a disease. J. Clin. Virol. 17:1–3. 6. Kao, J.-H., W. Chen, P.-J. Chen, M.-Y. Lai, and D.-S. Chen. 1999. Liver and peripheral blood mononuclear cells are not major sites for GB virus-C/ hepatitis G virus replication. Arch. Virol. 144:2173–2183.
7. Kobayashi, M., E. Tanaka, and K. Kiyosawa. 1997. Non-A-E acute and chronic hepatitis in Japan. Nippon Rinsho. 55:530–534. (In Japanese.) 8. Kodali, V. P., S. C. Gordon, A. L. Silverman, and D. G. McCray. 1994.
Cryptogenic liver disease in the United States: further evidence for non-A, non-B, and non-C hepatitis. Am. J. Gastroenterol. 89:1836–1839. 9. Kurstak, E., A. Hossain, and C. Kurstak. 1996. Progress in diagnosis of viral
hepatitis A, B, C, D and E. Acta Virol. 40:107–115.
10. Laskus, T., M. Radkowski, L. F. Wang, H. Vargas, and J. Rakela. 1998. Detection of hepatitis G virus replication sites by using highly strand-specific Tth-based reverse transcriptase PCR. J. Virol. 72:3072–3075.
11. Lin, D.-Y., I.-S. Sheen, C.-T. Chiu, S.-M. Lin, Y.-C. Kuo, and Y.-F. Liaw. 1993. Ultrasonographic changes of early liver cirrhosis in chronic hepatitis B: a longitudinal study. J. Clin. Ultrasound 21:303–308.
12. Linnen, J., J. Wages, Jr., Z. Y. Zhang-Keck, K. E. Fry, K. Z. Krawczynski, H. Alter, E. Koonin, M. Gallagher, M. Alter, S. Hadziyannis, P. Karayiannis, K. Fung, Y. Nakatsuji, J. W. Shih, L. Young, M. Piatak, Jr., C. Hoover, J. Fernandez, S. Chen, J. C. Zou, T. Morris, K. C. Hyams, S. Ismay, J. D. Lifson, G. Hess, S. K. Foung, H. Thomas, D. Bradley, H. Margolis, and J. P. Kim.1996. Molecular cloning and disease association of hepatitis G virus: a transfusion-transmissible agent. Science 271:505–508.
13. Nishizawa, T., H. Okamoto, K. Konishi, H. Yoshizawa, Y. Miyakawa, and M. Mayumi.1997. A novel DNA virus (TTV) associated with elevated transam-inase levels in posttransfusion hepatitis of unknown etiology. Biochem. Bio-phys. Res. Commun. 241:92–97.
14. Romeo, R., S. Pol, C. Demeret, V. Thiers, D. Kremsdorf, E. Cuillerier, P. Berthelot, and C. Brechot.1995. Evidence of non-A, non-B, non-C infection in chronic hepatitis by polymerase chain reaction testing for hepatitis B and C viruses. J. Hepatol. 22:125–129.
15. Seto, E., P. J. Mitchell, and T. S. Yen. 1990. Transactivation by the hepatitis B virus X protein depends on AP-2 and other transcription factors. Nature 344:72–74.
16. Stapleton, J. T. 2003. GB virus type C/hepatitis G virus. Semin. Liv. Dis. 23:137–148.
17. Sugimoto, K., F. Ikeda, J. Stadanlick, F. A. Nunes, H. J. Alter, and K. M. Chang.2003. Suppression of HCV-specific T cells without differential hier-archy demonstrated ex vivo in persistent HCV infection. Hepatology 38: 1437–1448.
18. Tanaka, Y., D. Primi, R. Y. Wang, T. Umemura, A. E. Yeo, M. Mizokami, H. J. Alter, and J. W. Shih.2001. Genomic and molecular evolutionary analysis of a newly identified infectious agent (SEN virus) and its relation-ship to the TT virus family. J. Infect. Dis. 183:359–367.
19. Van Thiel, D. H., J. S. Gavaler, N. Baddour, L. Friedlander, and H. I. Wright.1994. Treatment of putative non-A, non-B, non-C hepatitis with alpha interferon: a preliminary trial. J. Okla. State Med. Assoc. 87:364–368. 20. Yeh, C.-T., M.-L. Tsao, Y.-C. Lin, and I.-C. Tseng. 2006. Identification of a novel single-stranded DNA fragment associated with human hepatitis. J. In-fect. Dis. 193:1089–1097.