國
立
交
通
大
學
經營管理研究所
碩
士
論
文
價格促銷在私有品牌和國際品牌上的長期效果
The long-term effects of price promotions on
store- and national brands
研 究 生:方嘉伶
指導教授:唐瓔璋 教授
價格促銷在私有品牌和國際品牌上的長期效果
The long-term effects of price promotion on
store- and national brands
研 究 生:方嘉伶 Student:Chia-Ling Fang
指導教授:唐瓔璋 教授 Advisor:Dr. Edwin Tang
國 立 交 通 大 學
經 營 管 理 研 究 所
碩 士 論 文
A Thesis
Submitted to Institute of Business and Management College of Management
National Chiao Tung University
in Partial Fulfillment of the Requirements for the Degree of
Master of
Business Administration
June 2007
Taipei, Taiwan, Republic of China
價格促銷在私有品牌和國際品牌上的長期效果
研究生:方嘉伶 指導教授::唐瓔璋 國立交通大學經營管理研究所碩士班
摘要
本論文為了解各個品牌在銷售和促銷運用上的長期互動情形,使用時間序列分析 的 VAR 模型,分析芝加哥大學的 Dominick's Finer Food Database,並選擇衛生紙品 類內的 13 個國際品牌產品和 1 個私有品牌產品做分析。 依照產品銷售量和平均折扣率的長期穩定性,這些產品最後被分成四群。維持穩定 銷售量和平均折扣率的產品,表示是處於金牛或利基市場,長期來說,並不會受到小型 競爭者的影響;大部份前 5 名的產品都同樣擁有不受影響的穩定銷售量,但卻有不穩定 的平均折扣率,暗示了這些產品很可能是主導市場上價格促銷程度的品牌,和其領導地 位相符;擁有不穩定銷售量和穩定平均折扣率的產品,則表示其銷售量會受其它競爭者 的影響;銷售量和平均折扣率都不穩定的產品,推測是剛上市的新產品,無法馬上鞏固 銷售量,也無法訂定適當的折扣率,在此篇論文中,並沒有產品屬於這塊區域,故顯示 這段時間沒有新產品。 我們的結果同時也發現,私有品牌的促銷活動的確會跟隨著市場領導品牌,此為其 重要的定位策略之一。私有品牌的促銷甚至可能干擾市場的長期均衡,並且對其它國際 品牌的銷售量會有負向影響,特別的是,愈大的國際品牌受到的影響也愈劇烈。 關鍵詞:促銷、私有品牌、長期效果、時間序列
The long-term effects of price promotion on store- and national brands
Student:Chia-Ling Fang Advisor:Dr. Edwin Tang
Institute of Business and Management
National Chiao Tung University
Abstract
In order to demonstrate the long-term interaction between brands, we apply the time series model, VAR, to analyze the Chicago Dominick's Finer Food Database. We chose 13 national brand products and 1 store brand product in bath tissue category.
The result divides these products into four groups, according to the stability of their sales and average price discounts in the long run. Products which have stationary sales and average price discounts are cash cows or market niches which won’t be influenced by small competitors in the long run. Most of the top 5 products have stationary sales but unstable average price discounts, and it implies that they are probably the potential triggers for the price promotions in the market. Products which have unstable sales but stable average price discounts are small brands, and it means that the brand sales is fluctuated by other competitors. Finally, products which have unstable sales and average price discounts are probably new products. They can’t control their sales and lack of information to decide the proper discounts. In this research, there is no new products.
My result also indicates store brand’s price promotion activities always follow the market leader. Moreover, the store brand’s promotion might interfere the long term market equilibrium and negatively influence the sales of the other brands. The bigger the national brand is, the greater the impact is.
誌 謝
感謝我的家人,在就學期間無條件地支持,提供舒服的環境讓我專心於學業研究。 感謝被我〞壓搾〞了二年的指導教授---唐瓔璋老師,雖然偶爾會露出〞被打敗了〞 的表情,還是竭力地帶領我完成論文,在與老師的討論中獲得許多靈感,也明白行銷這 門學問的深奧之處;以及胡均立老師,如果沒有先修了老師的課,這篇論文根本就不會 出現了;當然,還有各位口試委員,謝謝各位在百忙之中抽空前來,讓我順利完成最後 一個階段。 最後,感謝唐門的大家,一路相扶持到今天,在我有疑問時,陪我一起討論,也幫我打 氣。Contents
Chinese abstract i English abstract ii 誌謝 iii Contents iv Contents of tables vi Contents of figures vii1.
Introduction 11.1 The store brand 1
1.2 The purpose of this research 4
2.
Literature 62.1 The long-term effects of the price promotions 6 2.2 The role of the different category characteristics 7
2.3 Store brands and national brands 8
3.
Framework and Methodology 10
3.1 Research framework 10
3.2 VAR modeling and variables operationalization 12
3.3 Unit root test and co-integration 15
4.
Data description 184.1 The selection of the dataset 18
4.2 The form of the subsystems 22
5.
Result and conclusion 265.1 Group1 26
5.1.1 The effects on the product sales 28
5.1.2 The effects on the average price index 29
5.1.3 Summary 31
5.2 Group2 and Group3 33
5.2.1 Group2 35
5.2.2 Group3 35
5.3 Group2-3 37
7.
Conclusion and future research 486.
Managerial implication 456.1 A price promotion is surely an “attack strategy”? 45 6.2 How does the store brand alter this market? 47
Reference 50 Appendix1 51 Appendix2 52 Appendix3 55 Appendix4 57 Appendix5 61
Contents of tables
Table 1 Explanation of lagged variables 14
Table 2 The top 5 national brands in the category and store brand 20 Table 3 The top 13 national brand products and the best-selling
store brand product (1991.8.8 ~ 1993. 9.23) 21 Table 4-1 The significant result in group1
(Product sales) 28
Table 4-2 The significant result in group 1
(Average price index) 30
Table 5 The comparison 31
Table 6-1 The direction of the error correct in group2 34
Table 6-2 The significant result in group2 34
Table 7-1 The direction of the error correct in group3 36
Table 7-2 The significant result in group2 36
Table 8-1 The direction of the error correct in group2-3 37
Contents of figures
Figure 1 VAR model 17
Figure 2 VEC model 17
Figure 3 The distribution of the products 19
Figure 4 The distribution of the unit prices (for a single roll)
within each package 19
1. Introduction
1.1 Store brand
People consume commodity goods everyday; this is usually just for satisfying their basic needs. Since the usage volume is high, the price of product naturally could be a main factor which determines consumers’ purchases. Consequently, there are always price promotions in retailing stores, especially for commodity goods, like foods or paper products. The different category characteristics may influence the result of promotions (Bell, Ganish and Padmanabhan, 2002; Narasimhan, Neslin and Subrata, 1996); price promotions are recognized as an important tool to cause brand switching.
The entry of store brands makes the situation more complicated. Store brands have been playing an important role after 1900s. Unlike national brands which are produced by a specific manufacturer and distributed to different retailers, store brands, or private labels, are those brands which are created and sold by a specific retailer, including department stores, discount stores, and supermarkets. These store brands usually have their name which is the same as the retailer, for example: Tesco Extra brand of Tesco. This naming can bring store loyalty into the store brand, catching those consumers who are used to shopping in that store. It also implies that the more powerful the retailer is, the more profitable the store brand is. Store brands reveal the power of retailers, and show the absolutely low prices to attract consumers who are sensitive to price. Comparing with national brands, they don’t need to pay for trade promotions, and their low prices are the most useful selling point. Their advertisement is combined with the advertisement of a retailer. When the retailer is advertising for calling consumers to shop, it is also bringing those consumers to the front of the store brand at the same time. Therefore, store brands can keep the low costs, and of course the low prices.
quality which looks like an inherent disadvantage of store brands, and need not to consider store brands as formal competitors. Nowadays, store brand products cover almost everything in the store, such as all kinds of foods, bath tissues, diapers, even the drugs and cosmetics. Because of the expansion of the products, store brands began to have a name different from that of the retailers. That is, a retailer can own various brand names in various categories. For example, the Great Value brand and the Sam’s Choice brand are introduced in the grocery market and the Get It Together brand is introduced for furniture and house wares; are all introduced by Wal-Mart. This makes them more like national brands. Consumers are gradually viewing store brands as a real “brand”. A new global research which was conducted by ACNielsen in 47 national and regional markets shows that store brands dominate many fresh categories. As a whole, store brands post 60% market share in three categories: cakes, ready to eat salads, and frozen fruit.
The store brands are getting trust from more and more consumers. According to a research study of seven countries from PLMA (Private Label Manufacturers Association), the consumers throughout Europe express their high acceptance to the store brands. This leads more purchase of the store brands, too. Except the buying intention, this study also showed that the quality is almost as important as the price when selecting the store brand products.
These findings declared the coming of a new age. The consumers would buy the store brand products, not just because of the low prices. The sales of the store brands in Europe are amazing. The highest market share is 49%, almost half of the total sales, in Switzerland. The lowest market share is 14% in Poland. This should arouse the attention of the national brands. It is obvious that this trend is changing the relationship between the manufacturers and retailers. They are not exactly partners any more. They are becoming competitors. The existence of the store brands can allow the retailers have stronger bargaining power, especially against the smaller national brands, due to the supports of the store brand products. Likewise, the power of the retailers can ensure the store brand products enjoying better
treatment, for instance, a better place on the shelf. The national brands absolutely need a plan to guard their sales against the store brands. And, the first step should be to understand the interaction between the store- and national brands in the market.
1.2 Research purpose
To catch price-sensitive consumers, national brands are used to holding price promotions. But the prices of national brands under promotions are usually still higher than store brands, and the competition is not determined by price alone. There is one more crucial factor: price elasticity. Because of different quality tier, national brands and store brands own asymmetric price elasticity. In other word, price reduction for national brands can attract more consumers from store brands than vice versa. This can be also related to the intention of brand loyalty. Therefore, the result is still very blurred, especially what is exactly going on between national brands and store brands. Related research has been done to price consciousness, quality consciousness, loyalty, or asymmetric effects on store brands and national brand promotions (Ailawadi, Neslin and Gedenk, 2001; Sivalumar and Raj, 1997).
However, previous studies have been focused on short effects of marketing variables; little research has been done on long-term effects. Dean (1966) proposed that the benefit of time lag resulted from promotions is substantially. To take time into consideration, Neslin (1990) used econometric market response model to measure the effect of coupon promotions upon market share. Dekimpe and Hanssens (1995) introduced persistence model to derive long-term marketing effectiveness from time-series observations on sales and marketing expenditures. Nijs, Dekimpe, Steenkamp, and Hanssen (2001) studied the category-effects of consumer price promotions through vector-autoregressive models with exogenous variables (VARX). Although price promotions have increased in both commercial use and quantity of academic research over the last decade, most of the attention has been focused on there effects on brand choice and brand sales. Little is known about the long-term effect of price promotions on store brand.
This research focuses on the interaction of sales and discount rates under price promotions, and takes the lagged effects into consideration. We chose the bath tissue category which surely belong to commodity goods, and adapted a VAR model to catch the long-term
effects of the price promotions. This research also tries to build a model which can be treated as a system, to simulate the long-term dynamic progress caused by price promotions in the market. The findings would not be only on the precedent cross-brand effects, but also a new version: cross-subsystem effects. This research is supposed to provide a sketch of the following questions: (1) Does long-term effects of price promotion on sales exist? (2) How does this system work? Does any long-term equilibrium exist? (3) How does a store brand influence the operation of this system?
2. Literature
There are a lot of articles probing into the effects of promotions. Methodology and issues have been changing with the time. As brand-switching effects exist, previous research usually concentrated on brand-level issues, such as brands sales and brand choice. In addition, because of the limit of methodology, much research has been focused on short-term effects which were estimated by simple regressions. Nowadays, time series models are developed and the category management is emerging, recent articles turn to category-level issues and long-term effects of promotions.
2.1 The long-term effects of price promotions
Several studies have shown that promotions lack of long-term category-demand effects (Dekimpe, Steenkamp, and Hanssens, 2001; Hanssens, Koen and Siddarth, 2002). This conclusion was proved more detailed by Vincent, Dekimpe, Steenkamp, and Hanssens(2001). They checked 560 categories and found that positive long-term category-demand effects exist in only 2 percent of these categories, even though short-term effects are all significantly positive. The incidence of positive price-promotion effects decline and become a rare occurrence in the long-run. Hanssens, Koen and Siddarth (2002) then classified previous research on promotion effects on two dimensions: (1) immediate effects, adjustment effects, and permanent effects according to time frame and (2) category incidence, brand choice, and purchase quantity according to the type of purchase behavior. For canned soup and yogurt, no long-term effects exist. In terms of adjustment effects, the promotional effects are short-lived (on average 2 weeks, at most 8 weeks). Without a doubt, this is consistent with the general attitude toward the effects of the marketing activities.
2.2 The role of different category characteristics
Different category characteristics can also influence the result of promotions. Narasimhan, Neslin and Subrata (1996) reported that promotions for brands in easily stockpiled high-penetration categories with short interpurchase times, like paper products and canned products, should produce larger sales increase. However, this is not exactly true. The promotion elasticity measured in this research is short-term elasticity. They noted that the ultimate profitability of promotion may be diminished, if much of the incremental sales due to promotion are really the result of consumers stockpiling their favorite brands. In other words, easily stockpiled categories are not always good for promotions. The determinant is whether the category shows the flexible consumption effect. When consumers stockpile without increasing their consumption, a temporary sales increase may be followed by a longer-than-normal elapsed time before consumers reenter the market for another purchase. This is called a postpromotion dip. Bell, Ganish and Padmanabhan (2002) also found that firms tend to use more frequent and deep promotions for categories which show the flexible consumption effect.
According to the above articles, we assume that bath tissue category shows no flexible consumption effect and therefore is expected a postpromotion dip. Moreover, the long-term category-expansion effects of promotions could be zero. With no long-term category-expansion effects, the brand sales increase can be almost assigned to the brand-switching effects. Under this condition, the switching between store brands and national brands will be observed more correctly.
2.3 Store brands and national brands
Store brands have been playing an important role after 1900s. Their low price becomes a threat to national brands. Thus, using promotions is the most common way for national brands to attract price-sensitive consumers. Ailawadi, Neslin and Gedenk (2001) analyzed the value which consumers perceive through store brands and national brand promotions. Consistent with general thinking, they confirmed that store brand use is particularly associated with price consciousness, low quality consciousness, and store loyalty. Furthermore, they suggested that national brands can target quality-conscious consumers and encourage the stockpiling behavior through promotions, while store brands should keep an every day low price. In the end, they touched a serious issue, that is, whether national brands can combat the store brand threat effectively through promotions. The answer is a partial yes. Furthermore, for national brands, grasping those consumers who are impulse-buying will be the key point. Sivalumar and Raj (1997) elaborated on the asymmetric effects on national brands and store brands caused by price changes. Promotions could be more effective for national brands than store brands due to the different quality tier. Consumers usually prefer to switch up rather than switch down quality tiers. Except for the choice share movement between national brands and store brands, they implied that national brands also have a much greater ability to induce consumers to change their category purchase timing.
In brief, the national brands seem to hold the edge in this war. Could this mean that store brands are nothing? If it is true, those retailers won’t invest in store brands so fervently. Hoch and Banerji (1993) provided some opinions on when store brands will succeed. First, the competitive structure of the category could be a vital factor. Store brands are well advised to tread lightly in the categories where there are many national brands and they make a lot of advertising efforts as a result of the more competitive arena. Second, the consumers don’t buy store brands only because they are cheap. Beyond expectation, quality is more important. Store brands should concentrate on categories where they can offer quality levels comparable
to those of national brands. That is, to offer high-value products (high quality-lower relative price). Besides, be less concerned with delivering deep discounts. This could correspond with the asymmetric effects which are demonstrated by Sivalumar and Raj (1997). Deep discounts won’t help store brands too much.
3. Framework and Methodology
3.1 Research framework
This research analyzes the effects of promotions in three aspects, they are as follows: Price promotions can stimulate the sales in three levels: category incidence, brand choice, and purchase quantity. Increase in category incidence can benefit all products in that category, called category expansion; increase in brand choice means a zero-sum game--someone wins and someone loses, called brand switching; increase in purchase quantity exhibits the stockpiling behavior of those old consumers.
Moreover, consumers who results in the increase are also different. The increase in category incidence and brand choice are caused by new consumers. These new consumers choose the category and the brand under the price promotions. But the increase in purchase quantity is caused by old consumers. It is clear that price promotions should aim at a specific target as well: new consumers or old consumers, and this will influence how to give the price promotions. We will find these causes via the model.
How long can the effects of price promotions exist? Most researchers agree with the short life of the effects. Price promotions are good at attracting consumers for a while, not forever. We exactly agree with this conclusion, if under a stable condition. Past research did not show what happened if long-term equilibriums exist. Those unknown long-term equilibriums will affect the whole system, like invisible hands. Product sales and the average price indexes all are able to construct long-term equilibriums, as long as they are evolving series. This research put more emphases on the existence of the long-term equilibrium, and how their pull affects a market slowly.
Price elasticity decides the magnitude of the effects, and it is not the same among these brands. The higher the price elasticity is, the stronger the effects are. The entry of store brands heightens the price sensitivity. Consumers feel more sensitive to the prices, because of the
comparison between store brands and national brands. They suddenly know that these products can be bought with much less money. This is not good to national brands. Nevertheless, the effects of price promotions with or without the store brands should be dissimilar. This research particularly notices how a store brand influences the market.
Additionally, in our systematic model, two distinct perspectives would be reflected by the endogenous variables which are product sales and average price index. One is the consumer response to the price promotions which could be unfolded by product sales variables, and the other is competitive reactivity after the price promotions which could be unfolded by the average price index variables. These two parties, consumer response and competitive reactivity, frequently interact with each other. The price promotions stimulate the product sales, then the store brand and national brands decide their next price promotion strategy according to the consumer response and competitive reactivity.
3.2 VAR modeling and variable operationalization
Recently, the most popular time series model which is adapted to the persistent modeling of marketing is a VAR (vector-autoregressive) model. Compared with basic ARMA and ARIMA models, a VAR model is obviously more flexible. In an ARMA or ARIMA model, the relationship between endogenous variables and exogenous variables must be identified; and exogenous variables won’t be influenced by endogenous variables. It means that there is only one-way direction, from exogenous variables to endogenous variables. In reality, it is impossible to be always so simple. Sometimes it is difficult to define the exogenous variables, for everything could be influenced by each other. In a word, each variable could be an endogenous variable. A VAR model can show the complex interaction of several endogenous variables at a time, including their lagged terms. Its original purpose is to predict how the variance in one variable will act on the others. This is more like a system equations than ARMA and ARIMA models. In conclusion, when the interactions between so many variables and lagged variables in a complex environment need to be investigated, a VAR model is suitable.
Our modeling concept was derived from a classic sales-response model --- Koyck model, which is:
where Y is sales at time t, and X could be any measurement of marketing activities, like advertising expenditures. β is assumed to show the geometric decay over time. That is, the magnitude of marketing activities is supposed to decrease over time. To include the
competitive reactivity, we developed a set of expanded Koyck model for each product n:
=
Σ
βi +μti=0
∞ +
where Y and X are sales and average price index of product n at time t, totally N products in the model. β1 and β2 are also assumed to show the geometric decay, the same as γ1 and
γ2.
We didn’t take the autoregression of error terms into consideration. The autoregression of error terms can show if any shocks on the sales and average price index will last forever and affect the operating process. This often can be used to measure the long-run impact of isolated events, such as negative product news. But, persistence models have to assume that events don’t change the process that generates endogenous variables, like sales (Dekimpe and Hanssens, 1995). Moreover, we used aggregated data which alleviated accidental shocks and didn’t have any information of those special events. Hence, according to the major part of previous articles, we only applied a VAR model, not VMA (vector-moving-average) model.
The measures of endogenous variables: sales and average price index are as follow:
Sales: It is weekly product sales volume, measured by the number of actual item sold.
For bath tissue, that is how many packages are sold. Although a brand can own several products, we did not aggregate their sales in the brand level, because the different prices would be messed up. Anyhow, these products belong to two groups: national brands and store brand. The comparisons of the product sales are not only done between national brands and store brand, but also within national brands.
Average price index: While the mass of previous research used price along to be the
variable reflecting promotions, we use the weekly average price index, which is the weekly average ratio of regular price and actual price for a single roll across each store. The regular
(2) (3) + + = + μ2t Xn t ω
Σ
γ2iXn t-i i=1 ∞ N n=1Σ
i=1 ∞Σ
γ1iYn t-i N n=1Σ
+ = + μ1t Yn t α + N n=1 i=1 ∞Σ
β1iYn t-i-iΣ
Σ
β2iXn t-i i=1 ∞ N n=1Σ
price is usually defined as the highest price in the database. If the ratio is 1, it means there are no promotions. In contrary, if the ratio is less than 1, it can represent the promotion depth, or the discount rate. This index can tell the price promotion strategy more directly, and also eliminate the influence of inflation.
In equation (2), β1 can infer the occurrence of category-expansion, brand-switching and
stockpiling effects; β2 can infer the occurrence of brand-switching and stockpiling effects,
and the existence of complementary and substitute relationships. In equation (3), γ1 can
infer the self control of price discounts and attitude toward the others (a competitor or companion); In addition to the self control, γ2 can also infer the reaction to the others’ price
discounts (following or differing, see table 1).
Endogenous variable Exogenous
variable
Product sales variables Average price index variables
Lagged
Product sales variables
Category expansion Brand switching Stockpiling Self control Companion or Competitor Lagged average price index
variables Brand switching Stockpiling Complementary relationship Substitute relationship Self control Following or Differing Table 1
3.3 Unit root test and co-integration
The unit root test must be performed before building a VAR model. With the presence of the unit root, the time series is supposed to be an evolving series. We applied the augmented Dickey-Fuller (ADF) test to all logarithms of the sales and average price index variables. It is demonstrated that there are several evolving series. Next, these products are partitioned into four groups:
1. Stable sales and average price index (group1).
2. Stable sales and evolving average price index (group2). 3. Evolving sales and stable average price index (group3). 4. Evolving sales and average price index (group4).
The detailed illustration will be given in chapter 4. In addition to diagnosing the unit root, ADF test can also determine the proper length of lagged periods, judged by AIC. According to ADF test, the lagged periods vary from 2 to 8 weeks. This number happened to match the result of the previous articles, which stated that the effects of marketing activities can last 2 to 8 weeks (Hanssens, et al. 2002). Nevertheless, the model already included too many variables (the sales and average price index variables of each product). Based on the assumption of geometric decay, we just set the lag for 1 week to simplify the model.
With evolving series, two procedures can be executed. One is to differentiate the evolving endogenous variables, than implement ADF test again. Repeat this step until they become stationary, and specify the model in the differentiated endogenous variables. But, it may lose some long-run information if there is a certain kind of long-run equilibrium within these evolving endogenous variables, called co-integration. Thus, the other is to perform the co-integration test and build the error correction model (ECM).
Co-integration occurs when the linear combination of several evolving endogenous variables becomes stationary. It denotes that these variables will gradually converge toward their equilibrium in the long-run, even though they may diverge in the short-run. The
mechanism will bring them to correct the error. For example, in the long run, supply will equal to demand. For marketing, the existence of equilibriums can result from limits of market. The fixed amount of consumers in the market could form a long-term equilibrium and make sales volumes of all products construct a co-integration equation.
To engage with the later VAR model, we used the Johansen’s Full Information Maximum Likelihood procedure. This procedure examines the co-integration relationship via the eigenvalue. The result showed several co-integration vectors, and it means that a VAR model should be changed into a VEC model (a VAR model with error correction).
With the standard operation, the VEC model will be estimated directly after the Johansen’s procedure. Yet, it is likely to be properly executed only on the premise that all endogenous variables are evolving series. The problem is that some of our endogenous variables are stationary series. In order to keep the completeness of our framework, we adjusted the procedure and divided the specification of the VEC model into two steps:
1. Substitute the co-integration vectors for real numbers, converting them into new variables which can be seemed as adjustment parameters.
2. Add the adjustment parameters into the differentiated VAR model as exogenous variables.
Thus, VAR and VEC models are all fitted in this research. If the endogenous variables in the group are all stationary, such as group1, a VAR model will be applied (see figure 3). If not, a VEC model will be applied (see figure 4).
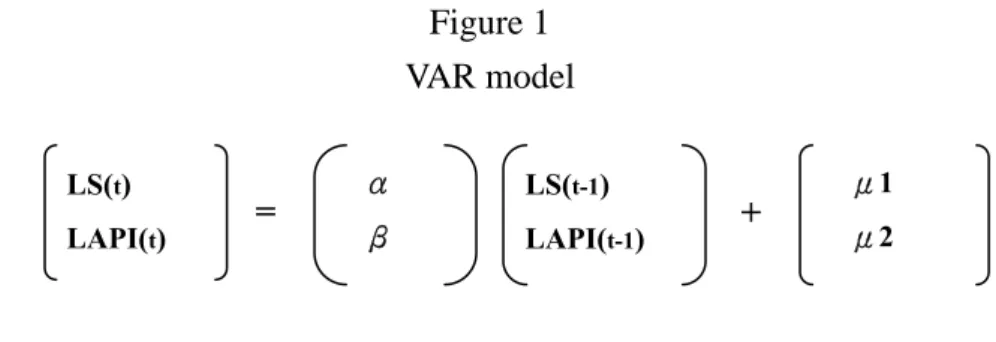
Figure 1 VAR model
Note :
Movet = the vector of the sales of the product 1~14 in week t
APIt = the vector of the weekly average price index of the product 1~14 in week t
t-1= the lag of 1 week.
LS(t) LAPI(t) α β LS(t-1) LAPI(t-1) + μ1 μ2 = Note :
Movet = the vector of the sales of the product 1~14 in week t
APIt = the vector of the weekly average price index of the product 1~14 in week t
E i = the ith adjustment parameter
t-1= the lag of 1 week.
Σ
γ i E i △LS(t) △LAPI(t) + μ1 μ2 △LS(t-1) △LAPI(t-1) α β i=1 n = + Figure 2 VEC model4 . Data description
4.1 The selection of the dataset
The database is Dominick's Finer Food Database from the university of Chicago graduate school of business. We considered the bath tissue category. There are 118 products and 15 brands, including 1 store brand. Figure 5 shows the number of the products according to the different size. Obviously, the competition is the most intense in 4-roll market, which is followed by 1-roll market, and totally occupied about 90% market share in the category. The store brands, called DOM, launched products in 1-roll, 4-roll, 12-roll and 24-roll market. Some people may think that entering the market which has fewer competitors is the best strategy for the store brand. In fact, it is not true. Fewer competitors in the market can refer to less demand, especially for the mature product, like the bath tissue.
Figure 6 shows the distribution of the unit prices (for a single roll) within each package and the boxplot of all the unit prices. The distribution of the unit prices within 4-roll market is the most dispersive due to the intense competition. Overall, 50 percent of the unit prices converge on the middle-low position. In other words, most products are positioned in low prices, and consumers already have many choices of low-price products. This is maybe not good for the store brand, DOM, unless it can provide a much lower price. However, the unit prices of DOM are not always the lowest. In 4-roll market, its unit price is near the middle.
The top 5 national brands in the category are SCOTT, CHARMIN, QUILTED NORTHERN, COTTONELLE and KLEENEX in order. The brand share of SCOTT doubles that of CHARMIN. Surprisingly, DOM still own 7.7% brand share which is a little larger than that of COTTONELLE and KLEENEX, even it introduced less products than those two national brands. The potential of the store brand can be proved here. Consistent with the implication in table 4, 1-roll and 4-roll are expected to be the most popular packages (see table 2).
The amount of the products
Figure 3
The distribution of the products
Size (roll)
Figure 4
The distribution of the unit prices (for a single roll) within each package
The unit price
Our final dataset ranges from August 8, 1981 to September 16, 1993 and covers the top 13 national brand products and 1 best-selling store brand product, totally 72.3% market share (see table 3). These national brands are SCOTT, CHARMIN, COTTONELLE, QUILTED NORTHERN, WHITE CLOUD and KLEENEX. Our main idea is to sketch complicated interactions caused by promotions. Hence, we didn’t consider any detailed characteristics of products, like different packages. However, for commodity, products are highly homogeneous. Even those in different packages can also interact with each other. For instance, they may hold complementary relationship. This dataset indeed displays two factors which can help the store brand succeed. First, there are so many national brands in the market --- the 13 products belonged to 6 national brands. We already referred to this point in chapter 2 (Hoch and Banerji, 1993). Second, the gap of the sales volume between the no.1 and no.2 products is very large, about a half of the volume of the no.2 product. The leader of the market is very strong. It is more beneficial for store brand to mimic the strong leader. We will talk about this in later chapter.
Brand Amount of products Brand share The most popular package
SCOTT 11 39% 1 roll CHARMIN 26 17% 4 roll QUILTED NORTHERN 19 14% 4 roll COTTONELLE 15 7.5% 4 roll KLEENEX 17 4.4% 4 roll
DOM (store brand) 7 7.7% 1 roll
Table 2
Product Sales volume Package Unit price (for single roll)
SCOTT WHITE BATH TISSUE 3,363,686 1 roll $0.67 CHARMIN WHITE BATH TISSUE 1,833,799 4 roll $0.32 SCOTT BEIGE BATH TISSUE 1,369,771 1 roll $0.68 SCOTT PINK BATH TISSUE 1,279,743 1 roll $0.68 SCOTT SINGLE BATH TISSUE 1,182,520 1 roll $0.68 COTTONELLE DECOR. BATH TISSUE 1,123,945 4 roll $0.37 CHARMIN YEL/BLU BATH TISSUE 1,101,453 4 roll $0.74 NORTHERN WHITE BATH TISSUE 1,030,526 4 roll $0.40 NORTHERN SOFT PRINTS BATH TISSUE 955,176 4 roll $0.40 WHITE CLOUD WHITE BATH TISSUE 935,914 4 roll $0.40 COTTONELLE WHITE BATH TISSUE 929,825 4 roll $0.40 SCOTT YELLOW BATH TISSUE 923,072 1 roll $0.89
KLEENEX BATH WHITE 817,941 4 roll $0.37
DOM WHITE BATH TISSUE (store brand) 770,378 1 roll $0.59
Brand Brand share
SCOTT 33.3% CHARMIN 12% COTTONELE 8.4% QUILTED NORTHERN 8.1% WHITE CLOUD 3.8% KLEENEX 3.3%
DOM (store brand) 3.1%
Table 3
The top 13 national brand products
4.2 Subsystems
Recall that we separated these products into four groups according to the result of the unit root test, and the null hypothesis of this test is that the series is evolving, with the unit root (see appendix 1). Every group can be treated as a subsystem in this market, and owns different characteristics (see figure 7):
1. Goup1.
Group1 is the biggest. They hold their sales volumes and price discounts in the long run. It refers that any short-term impacts caused by someone else will vanish at last, no matter in the sales or price discounts. This is a very stable subsystem. Connecting with marketing concept, group 1 looks like a niche market. Each one has its own domain, which may be small but a stable one. These products all could be small “cash cows” for their companies. Here, No.2 obviously is a nearly perfect product, because of its high sales volume and stable performance.
2. Group2
No.10 and No.13 are located in group2. In the long run, their sales volumes are still fluctuant. Even if their price promotions are given in a constant state as well, like those in group1, unfortunately, they cannot control their sales volumes, because of their weak market power. The stable price discounts also presumably resulted from the lack of the promotion budget, because of their unstable sales. This arena could be a vicious circle. If these products keep staying in this condition, they might become “dogs”.
3. Group3
Products in group3 are especially attention-getting, for containing the best seller of national brands and store brand. It may be a little strange, but this is relevant to the
positioning strategy of the store brand, which also generated the evolving average price index series, like the no.1 national product. However, it shouldn’t be neglected that the store brand product could hold stable sales. Apparently, the store brand is still able to have its own consumers who will be loyal for a long time, like the national brands. In my opinion, consumers are transforming their store loyalty into the brand loyalty to the store brand. This process is still moving forward. It can be supported by the optimistic outcome of the research study of PLMA in section 1.1.
Except No.2, group3 embraced the top 5 products of national brands. On the one hand, the changing price promotion strategies of these powerful national brands indeed have substantial impacts on the other brands, and this could be one of the purposes of their price promotions. They use unexpected price discounts to scare the small brands. On the other hand, their sales volumes won’t be shaken in the long run, like their leading positions in the market.
4. Group4
Conspicuously, there is no product in group4. Given diverging sales and price discounts, everything in this subsystem is in an uncertainty, or chaos. This will happen to new products which just launched into the market. They are not able to settle down immediately and lack of information to make a decision for their price promotion strategies.
Group1
No.2 CHARMIN WHITE BATH TISSUE No.6 COTTONELLE DECOR. BATH TISSUE No.7 CHARMIN YEL/BLU BATH TISSUE No.8 NORTHERN WHITE BATH TISSUE No.9 NORTHERN SOFT PRINTS BATH TISSUE No.11 COTTONELLE WHITE BATH TISSUE No.12 SCOTT YELLOW BATH TISSUE
Group2
No.10 WHITE CLOUD WHITE BATH TISSUE No.13 KLEENEX WHITE BATH TISSUE
Group3
No.1 SCOTT WHITE BATH TISSUE No.3 SCOTT BEIGE BATH TISSUE No.4 SCOTT PINK BATH TISSUE No.5 SCOTT SINGLE BATH TISSUE No.S DOM WHITE BATH TISSU
Group4
Note:
No.1 to No.13 : the products of the national brands, standing for the rank of the total product sales from August 8, 1981 to September 16, 1993
No.S :the product of store brand
The logarithm of the product sales (LS)
Evolving
Stable Evolving
Stable The logarithm of the average price index
(LAPI)
Figure 5
As a whole, most of these products are situated in left side, possessing stable sales when time passed by, and no products are situated in group4. These phenomena are matched with features of commodity categories, whose sales volume are fixed in a certain size and new products are very few.
In the end, there are totally four models in this research. The procedure of constructing our models is as follow:
1. Three models are applied to three groups, a VAR model for group1 and two VEC models for group2 and group3.
2. With a stable status, group1 is a close subsystem. It doesn’t interact with the other subsystems. But, with evolving series, group2 and group3 are open subsystems. The cross-subsystem effects might exist. To find out possible causes of the instability of the sales and price discounts inside these two groups, we also combined group2 and group3, named group2-3, to build another VEC model.
For example, the equations of No.2 which were estimated by a VAR model in group1 are as follows:
And, the equations of No.1 which were estimated by a VEC model in group2-3 are as follows:
where E2-3-2 and E2-3-3 are both adjustment parameters.
LSNo.2 = 0.612*LSNo.7(-1) + 0.265*LAPINo.8(-1) - 0.157*LAPINo.9(-1) + 0.517 (4) LAPINo.2 = 0.508*LAPINo.7(-1) - 0.319*LSNo.11(-1) + 0.309*LSNo.12(-1) + 0.56 (5)
△ LSNo.1= -1.705*(E2-3-3) (6) △ LAPINo.1= 0.012*(E2-3-2) + 0.163*(E2-3-3) (7)
5. Result and discussion
5.1 Interaction within group1 (see appendix2)
5.1.1 The effects on the product sales
There are somehow frequent short-term interactions in this subsystem. For products sales, it is testified that category expansion is as essential as brand switching, even though most of the previous research undervalued the category expansion resulted from price promotions. Amazingly, it appears no significant postpromotion dip, which denotes that the stockpiling behavior is not observed. For bath tissue category, this may go against the popular opinion in the past. A further discussion will be provided in chapter 6. These significant parts include (see table 4):
1. Category expansion
No.2, No.6, No.7, No.9 and No.12 received category-expansion effects. In general, the bigger brands enjoyed more of the effects than the smaller brands. Interestingly, they didn’t benefit each other. That is, one who carried category-expansion effects to a certain product wouldn’t exactly enjoy the feedback from the same product. Consumers would be re-allocated to the other products. This is common in a commodity category, for the diversity is rare. Consumers would easily change their minds. No.9 even received a worse treatment from No.7. It brought the category-expansion effect to No.7, but No.7 brought the brand-switching effect to it. The unfairness between bigger and smaller brands is very obvious here.
2. Brand switching
No.9 and No.12 received brand-switching effects at the same time. They severally competed in a different pattern. No.9 loss the sales to No.7 and No.8, and they sat in the
middle position of this subsystem. They were close to each other;No.12 loss the sales to No.2, and they are very far away from each other--- the best and the most powerless in group1. The consumers of No.9 and No.12 behaved in distinct ways.
By the way, brand-switching effects are weaker than category-expansion effects for each product. It proves the recent belief that the category expansion is actually important.
3. Complementary relationship
Excluding No.6, all products reflected complementary relationships. This relationship was not symmetric. Like the asymmetric price elasticity (Sivalumar and Raj, 1997)), we found that the cross-elasticity could also be asymmetric. The complementary relationship which is reflected by one product maybe doesn’t reflected by the opposite side. The reason should be the same as that of the asymmetric price elasticity. But, some proved that their category-expansion effects came from complementary relationships. For example, No.2 enjoyed the category-expansion effect from No.7, and the complementary relationship is reflected in No.7.
4. Substitute relationship
Only No.2 reflected the substitute relationship with No.9. This looks impossible. How can the price of the No.9 product decrease the sales of the No.2 product? The only one reasonable explanation is that No.7 might be a mediator between them. No.9 interacted with No.7 much frequently, including the category-expansion effect, brand-switching effect and complementary relationship. And, there are also interactions between No.7 and No.2, including the category-expansion effect and complementary relationship. The overlapped complementary relationship is possible to be transformed into the substitute relationship between No.9 and No.2.
Interaction Product Category-expansion effect Brand-switching effect Complementary relationship Substitute relationship No.2 CHARMIN WHITE BATH TISSUE
No.7 No.8 No.9
No.6
COTTONELLE DECOR. BATH TISSUE
No.8
No.7
CHARMIN YEL/BLU BATH TISSUE
No.9 No.2
No.8
NORTHERN WHITE BATH TISSUE
No.6
No.9
NORTHERN SOFT PRINTS BATH TISSUE
No.12 No.7
No.8 No.7
No.11
COTTONELLE WHITE BATH TISSUE
No.7 No.8
No.12
SCOTT YELLOW BATH TISSUE
No.8 No.2 No.9
Table 4-1
The significant result in group1 (Product sales)
5.1.2 The effects on the average price index
For the average price index, the competitive reactivity in price promotion strategies is very confusing. Fighting against (react to) the one whose movement can be influential is a primary rule. In other word, for a certain product, the one who affects the sales and price discounts should be the same. Yet, it is not really the same from the result. Apparently, when a product holds the price promotions inside this subsystem, it is difficult to aim at the right targets and will involve the other harmless ones in the war, probably because the bath tissue products are so alike. The most incalculable one is No.11, for its price discounts didn’t be influenced by any others. All factors in this model are not significant to it. The significant parts include (see table 4-2):
1. Self control
Only No.7 revealed the clear self-control effect. It adjusted its price discounts according to the sales volume last time.
2. Attitude toward the others
All products had their assumed companions, and this may correlates with the frequent category-expansion effects. No.2, No.6, No.7, and No.9 additionally had their assumed competitors. But, it seems that these four products cared about their companions more than their competitors in terms of the weights ahead the variables.
3. Reaction to the others’ price promotion strategies
All products chose to follow the others’ promotions. When someone starts price promotions, the other will follow it. Nobody wants to differ from the others. It implies that following the others maybe is the correct way to survive in this market. I think that this behavior delivers an interesting issue, and the discussion is in chapter 6.
Interaction
Product
Self-control The attitude (competitor) The attitude (companion) The reaction (following) No.2 CHARMIN WHITE BATH TISSUE
No.11 No.12 No.7
No.6
COTTONELLE DECOR. BATH TISSUE
No.12 No.7 No.8
No.7
CHARMIN YEL/BLU BATH TISSUE
(-) Sales No.12 No.8 No.9
No.8
NORTHERN WHITE BATH TISSUE
No.9 No.2
No.9
NORTHERN SOFT PRINTS BATH TISSUE
No.6 No.11 No.6
No.12
SCOTT YELLOW BATH TISSUE
No.7 No.8
Table 4-2
The significant result in group 1 (Average price index)
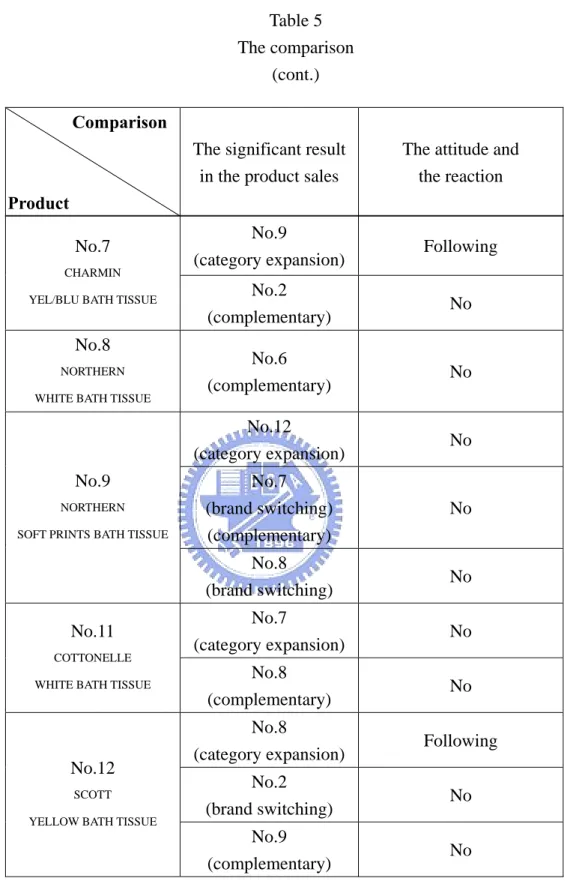
5.1.3 Summary
This section matches the above two parts to examine if these products reacted to the right target and in the right way. We will focus on the two components --- the attitude they took and the reaction they made (see table 5).
No.2, No.6, No.7, and No.12 really reacted to products which brought the category expansion and follow their promotions. They did the right thing. But, they didn’t catch the actually existing brand switching effects, complementary and substitute relationships. They might be misled. However, No.8, No.9 and No.11 were even in a worse condition. They either picked the wrong targets (No.9 and N0.8) or felt nothing about things happened (No.11).
Whatever, all effects are short-lived. About eight weeks later, they will become insignificant, and this is supported by an eight-week lagged VAR model. Therefore, this subsystem still keeps stable in the long run.
Comparison Product
The significant result in the product sales
The attitude and the reaction No.7
(category expansion) Following No.8
(complementary) No No.2
CHARMIN WHITE BATH TISSUE
No.9
(substitute) No
No.6
COTTONELLE DECOR. BATH TISSUE
No.8
(category expansion) Following Table 5
Comparison
Product
The significant result in the product sales
The attitude and the reaction
No.9
(category expansion) Following No.7
CHARMIN
YEL/BLU BATH TISSUE No.2
(complementary) No
No.8
NORTHERN WHITE BATH TISSUE
No.6 (complementary) No No.12 (category expansion) No No.7 (brand switching) (complementary) No No.9 NORTHERN SOFT PRINTS BATH TISSUE
No.8 (brand switching) No No.7 (category expansion) No No.11 COTTONELLE
WHITE BATH TISSUE No.8
(complementary) No
No.8
(category expansion) Following No.2
(brand switching) No No.12
SCOTT YELLOW BATH TISSUE
No.9
(complementary) No
Table 5 The comparison
5.2 Interaction within group2 and group3
The most critical discovery in group2 and group3 is the existence of long-term equilibriums. That is, even though those series are evolving, but the variations of them are predictable. According to the co-integration test, there are one co-integration equation in group2, and two in group3. We converted these co-integration equations into adjustment parameters, according to the steps in chapter 3. And, to ensure the stability of these adjustment parameters, we still applied the unit-root tests to them (see appendix 3~5).
The effects within these two groups are almost insignificant. Contrary to group1, they are open subsystems. The interaction within each group is possible to be weaker than that across these two open subsystems. This outcome convinced me that I should build another VEC model for the group2-3 which is composed of group2 and group3. Anyway, we will interpret the result of group2 and group3 individually first.
5.2.1 Interaction within group2 (see appendix 3)
The variables which are applied to the co-integration test are product sales variables in this group, because they are evolving. Two variables (two products inside group2) created one co-integration equation, E2-1, which represents the long-term error correction mechanism of the sales of No.13. The variation of the sales volume of No.13 will be corrected downward by that of No.10 (see table 6-1). And, this adjustment parameter indeed influenced the product sales here.
Their price promotions seems to be unaffected by factors inside this group. The significant parts include (see table 6-2):
1. Brand switching
2. Adjustment effect
Both No.10 and No.13 received adjustment effects from the adjustment parameter. The variation of the product sales of No.10 is corrected upward;The variation of the product sales of No.13 is corrected downward, and it is consistent with the original co-integration equation. As a result, the loss of No.10 caused by brand switching would be partly covered by the adjustment effect.
Variable LSNo.10
△LSNo.13
- E2-1
Interaction
Product Adjustment effect Brand-switching effect
No.10
WHITE CLOUD WHITE BATH TISSUE
(+) E2-1 No.13
No.13
KLEENEX
WHITE BATH TISSUE
(-) E2-1 Table 6-1
The direction of the error correct in group2
Table 6-2
5.2.2 Interaction within group3 (see appendix 4)
The variables which are applied to the co-integration test are average price index variables in this group. Five variables (five products inside group3) created two co-integration equations, E3-1 and E3-2, which represents the long-term error correction mechanism of the average price index of No.S and No.5. The variation of the price discounts of No.S will be corrected downward by that of No.3 and No.1, but corrected upward by that of No.4;The variation of the price discounts of No.5 will be corrected downward by that of No.4, but corrected upward by that of No.3 and No.1. In brief, No.S showed much faster speed of the adjustment than No.5 (see table 7-1). Yet, adjustment effects didn’t work potently in this group. Their force explicitly loss to something else, such as adjustment effects in group2-3. In conclusion, because the effects within group2 and group3 are almost insignificant, their variation should result from the interaction across these two subsystems. The significant parts include(see table 7-2):
1. Stockpiling (postpromotion dip)
Both No.5 and No.S received postpromotion dips. No.5 received a much larger postpromotion dip than No.S, almost four times. This reveals that the increasing sales in No.5 under price promotions primary comes from the stockpiling behavior of the old consumers. But, it is also worthy of attention that there were consumers to stockpile the store brand product. Why did they want to stockpile the store brand product? After checking the price of the store brand product, we supposed that the price is the reason. It is not the lowest price in our dataset, and even higher than that of some national brands. So, the consumers will try to stockpile the product under price promotions. However, this shows that there are consumers who could be lovers of the store brand, just like those lovers of the national brands.
2. Reaction to the others’ price promotion strategies
No.S chose to follow the price discounts of No.1. This demonstrates an important part of the positioning strategy of the store brand. It is undoubted that the store brand prefers to mimic the leader in the market. This will be retold in next section.
Variable LAPINo.4 LAPINo.3
△LAPINo.S
+ -
E3-1
△LAPINo.5- +
E3-2
Interaction Product stockpiling (postpromotion dip) The reaction (following) No.5 SCOTT SINGLE BATH TISSUEYes
No.S
DOM WHITE BATH TISSUE
Yes No.1 Table 7-1
The direction of the error correct in group3
Table 7-2
5.3 Interaction within Group2-3 (see appendix 5)
Evolving series, including two product sales variables and five average price index variables, are all applied to the co-integration test. Seven variables created five co-integration equations, E2-3-1, E2-3-2, E2-3-3, E2-3-4 and E2-3-5, which represents the long-term error correction mechanism of the sales of No.13 and No.10 and the average price index of No.S, No.3 and No.1. Roughly speaking, the smaller the brand is, the faster its speed of the adjustment is (see table 8-1).
Variable LAPINo.4 LAPINo.5
△LSNo.13
+ -
E2-3-1
△LSNo.10+ -
E2-3-2
△LAPINo.S+ -
E2-3-3
△LAPINo.3- +
E2-3-4
△LAPINo.1- +
E2-3-5
Table 8-1As a whole, short-term effects, estimated by lagged variables, are almost diluted by long-term vectors which are estimated by adjustment parameters in this larger subsystem. The adjustment effects are the most crucial factor here.
Basically, those effects what happened significantly within group2 and group3 almost retained here, except for the postpromotion dip of No.S. The significant parts include (see table 8-2):
1. Brand switching and stockpiling (postpromotion dip)
No.10 still received the brand switching effect from No.13, but only No.5 kept the postpromotion dip in this group. The magnitudes of both made no difference from that in group2 and group3.
2. Substitute and complementary relationships
No.10 received the substitute and complementary relationship at the same time. The substitute effect and the brand-switching effect made No.10 lose more sales than that in group2.
3. Self-control, attitude and reaction (1) Self-control.
No.10 controlled the price discounts according to its former price discounts. (2) Attitude toward the others.
Even though No.10 received the brand switching effect from No.13, it still counted No.13 as a companion in this subsystem. The reason is probably that they are both smaller brands in the market. While facing much stronger rivals, No.10 determined to take friendlier attitude toward No.13. Anyway, they are both in the same situation.
(3) Reaction to the others’ price promotion strategies.
No.10 chose to follow the promotions of No.5, but differ from that of No.4. So far, No.10 is the only one whose promotion strategy differed from that of the other. This may be relative to the complementary relationship between them. No.10 was still able to gain sales without following the price promotions of No.4.
Particularly, it is certificated again that the price discounts of No.S positively follow that of No.1. The store brand adopted its price promotion strategy which is driven by the no.1 national brand. This fact adheres to the argument that it will be more profitable if the store brand positions itself near the strongest national brand.
4. Adjustment effect
The most influential adjustment parameters are E2-3-2 and E2-3-3. Half of the products in this group were simultaneously affected by them.
(1) The long-term converged variation of the sales of No.10 (E2-3-2) would have slight impacts on the variation of the price discounts and sales of most products, to increase or decrease the degree of the variation. But it is hard to say that the variation will be plus or minus.
(2) The long-term converged variation of the average price index of No.S (E2-3-3) would have the same impacts on the variation of the price discounts and sales of most products, especially those national brands in top 5. It conspicuously would decrease the variation of their sales and increase that of their price discounts, which means that it may reduce the growth and deepen the price discounts of the national brands in the future.
We think that E2-3-3 discovered the power of the store brand in the long run. Unbelievably, these products on top are inescapable to be influenced by store brand’s entry, although they may feel nothing in the short run. The long-term equilibrium will
move these national brands inch by inch and take them to the other place, or a new equilibrium in the market, resulted from the disturbance of the store brand. We believe that this is the secret of the flush of the store brands since 1900s.
Interaction
Product
Adjustment effect
on sales
Adjustment effect on average price index
Stockpiling &
Brand switching
No.1
SCOTT SINGLE BATH TISSUE
(-) E2-3-3 (+) E2-3-2 (+) E2-3-3
No.3
SCOTT BEIGE BATH TISSUE
(-) E2-3-3 (+) E2-3-2 (+) E2-3-3
No.4
SCOTT PINK BATH TISSUE
(-) E2-3-3 (+) E2-3-2 (+) E2-3-3 Table 8-2
Interaction
Product
Adjustment effect
on sales
Adjustment effect on average price index
Stockpiling &
Brand switching
No.5
SCOTT SINGLE BATH TISSUE
(-) E2-3-3 (+) E2-3-2
(+) E2-3-3 Stockpiling
No.10
WHITE CLOUD WHITE BATH TISSUE
(+) E2-3-1 (-) E2-3-2
(-) E2-3-1
(+) E2-3-2 No.13(brand switching)
No.13
KLEENEX WHITE BATH TISSUE
(-) E2-3-1
(+) E2-3-2 (-) E2-3-2 No.S
DOM WHITE BATH TISSUE
(+) E2-3-3 (-) E2-3-3 Table 8-2
The significant result in group2-3 (cont.)
Interaction Product Substitute & Complementary Self-control & Attitude & Reaction No.1 SCOTT SINGLE BATH TISSUE
No.3
SCOTT BEIGE BATH TISSUE
No.4
SCOTT PINK BATH TISSUE
No.5
SCOTT SINGLE BATH TISSUE
No.10
WHITE CLOUD WHITE BATH TISSUE
No.5(substitute) No.4(complementary) Self-control No.13(companion) No.5(following) No.4(differing) No.13 KLEENEX WHITE BATH TISSUE
No.S
DOM WHITE BATH TISSUE
No.1(following) Table 8-2
The significant result in group2-3 (cont.)
5.4 Discussion
According to the result, we will try to answer the questions in chapter 1.
1. Does long-term effects of price promotion on sales exist?
Under a stable subsystem, like group1, the long-term effects of price promotion on sales
don’t exist. The short-term effects in group1, like category expansion, brand switching and stockpiling, will disappear after eight weeks. Here is an implication. These products had better hold price promotions every eight weeks to keep the effects.
Under an inherently unstable subsystem, like group2-3, some effects are possible to exist in the long run. These long-term effects contain those which come from the long-term equilibriums.
2. How does this system work? Does any long-term equilibrium exist?
There exist long-term equilibriums. Moreover, when there are adjustment effects in the subsystem, short-term effects will be diluted, or aggregated at those adjustment effects. All the effects inside are not absolutely symmetric. One brand maybe has an impact on the other brand, but doesn’t suffer from the same impact. This correlates to the brand loyalty, positioning strategy, and a lot of things.
Overall, the interaction within the close subsystem is more frequent than that within the open subsystem. In this research, the open subsystems, including group2, group3 and group2-3, are still influenced by things outside. Adjusted R-squares of these equations in the close subsystem are obviously higher than those in the open subsystems, up to 97% (see appendix2). And, among them, small brands have lower adjusted R-squares than big brands. It is initiative that small brands are more easily affected by something else.
3. How does the store brand influence the operation of this system?
The store brand, No.S, followed the price promotion strategies of No.1, which is a very powerful leader in the market. Furthermore, the influence of the store brand hides in the long-term adjustment effects.
6. Managerial implication
In conclusion, there are two issues extended from the result. One is the rare brand-switching effects between these products;The other is the power of the store brand over the market structure.
6.1 A price promotion is surely an “attack strategy”?
The majority of past research preached brand-switching effects caused by price promotions. To get the others’ consumers, price promotions are regarded as an “attack strategy”. A brand gives the temporally lower price to attack competitors, because it believes in brand-switching effects. But, what if there are no truly great brand-switching effects under price promotions, as what is shown in this research? Price promotions are not just used to attack the others. Moreover, the outstanding category-expansion effects can benefit all products in the category.
In this whole system, we supposed that price promotions are used as a “defend strategy”. While a brand starts the price promotion, the others choose to follow it. This behavior was confirmed in chapter 5. It looks like that the purpose of using price promotions in this market is to “protect” the sales volume. From negative impacts of adjustment parameters in group 2-3, it is more evident that most of the variation of product sales will tend to decrease, which means that the sales will not be able to vary in a large scale, no matter moving upward or downward. So, we called it “protection”. Here, this protection could work in two forms:
1. Keep the original sales volume
Price promotions just remind old consumers to come back, but they don’t intend to increase their purchase quantity. This can be evidenced by the lack of the postpromotion dips. The price discounts can encourage consumers to buy again, but not buy more. There are too
many homogeneous products in the market, which indicates that there are always discounted products. It seems that consumers don’t have to stockpile.
2. New consumers brought by the category expansion
However, sometimes old consumers don’t come back to repurchase. In this situation, new consumers brought by the category expansion can bridge the gap. Yet, this is more beneficial to larger national brands. From the result, those larger national brands also enjoy more category-expansion effects.
Therefore, the old and new consumers are both the targets of price promotions. For the old consumers, out-of-store promotions can be suitable, like sending coupons;For the new consumers, in-store promotions can be suitable, like the display promotions, to stimulate the impulse purchase.
Under this circumstance, the role of price promotions is likely repositioned. What are taught in the previous research maybe won’t exactly happen. So, many perspectives on price promotions can be renewed. For example, do price promotions really weaken the brand loyalty? If these brands target at the old consumers to give price promotions, the lower price can be seemed as a reward for the consumers’ loyalty. Contrary to the traditional acknowledgement, price promotions could be somehow a plus factor in the loyalty, provided a price promotion are used as a defend strategy.