汽車產業創新與品質之研究
91
0
0
全文
(2) 誌 謝 本論文之順利付梓,幸蒙恩師盧淵源教授悉心指導。在研究方向、論文架構 及寫作之諸多提點,令我獲益匪淺。修業三年半期間,除課業的教導外,恩師作 育菁莪、循循善誘,其風範更是令我深深感佩。 論文口試期間,承蒙本系蔡憲唐教授、劉常勇教授、郭倉義教授以及雲林科 技大學工管系古東源教授、高雄大學亞太工商管理系莊寶鵰教授、屏東科技大學 工管系黃允成教授諸位口試委員,不吝賜教、逐一指正本論文之缺失,並提供寶 貴意見,使本論文更臻完善。在此對六位老師費心指導,致上誠摯謝忱。 此外,對同門諸位師兄弟日新、國強、俊賢、志用及系上育瑞、媛琳、Jodie 姐、阿滿姐的幫助,一併致上萬分謝意。. 林亮宏 謹誌 九十三年十二月二十一日.
(3) 論文提要 學年度:93 學期:1 校院名稱:國立中山大學 系所名稱:企業管理學系博士班 論文名稱(中):汽車產業創新與品質之研究 論文名稱(英):A Study of Innovation and Quality in the Automotive Industry 學位類別:博士 語言別:英文 學 號 : 9041814 論 文 頁 數 : 82 頁 研 究 生 (中 )姓 名 : 林 亮 宏 研 究 生 (英 )姓 名 : Liang- Hung Lin 指 導 教 授 (中 )姓 名 : 盧 淵 源 指 導 教 授 (英 )姓 名 : Iuan-Yuan Lu 口 試 委 員 ( 中 )姓 名 : 古 東 源、 莊 寶 鵰、 黃 允 成、 蔡 憲 唐、 劉 常 勇 、 .郭 倉 義 、 盧 淵 源 口 試 委 員 (英 )姓 名 : Tong- Yuan Koo, Pao- Tiao Chuang, .Yun- Cheng Huang, Hsien-Tang Tsai, Chang-Yung Liu, Tsuang Kuo, Iuan-Yuan Lu. i.
(4) 中文摘要 過去十年以來,創新管理的新方法已成為許多產業發展的主要驅動力。為了 探討汽車廠商產品品質、產品創新與服務創新等議題,本研究試採賽局理論與實 質選擇權觀點,分別探討廠商間之競爭策略與消費者之購買決策。並且採用「高 品質廠商比較願意從事創新投資」的論點,嘗試論證高品質產品將帶動創新活動。 據此研究目標,本文將創新活動區分為產品創新與服務創新,並以汽車產業 為具體例證,分別討論其產品品質對產品創新與服務創新之影響。針對創新與品 質之賽局模型推導出創新所需成本為廠商從事創新活動之障礙,此障礙唯於廠商 生產高品質產品時可將之克服。再者,另一動態賽局亦指出產品品質與服務創新 之間具有非常強固之關聯性。本研究並嘗試以實質選擇權模式評估汽車廠商所採 行之服務創新,包括半價保證及延長試駕服務,結果發現有效的服務創新能夠提 升消費者購買慾望,進而增加廠商的營收與獲利。本研究亦發現,除了品質之外, 消費者對創新產品或服務的偏好程度,亦為創新成功與否之關鍵因素。成功的創 新管理有賴企業不斷地創新改良產品,並須持續關注市場狀況,確實掌握消費者 需求。 即使不同產業各自的產品創新與服務創新尚未達到普遍一致性,本研究仍強 烈支持生產高品質產品之廠商將會在創新活動中非常活躍之論點。從流程管理之 論點而言,全面品質管理能夠提昇產品品質,同時可以支持創新管理。 關鍵字:產品品質、產品創新、服務創新、賽局理論、實質選擇權. ii.
(5) ABSTRACT Over the past decade, new approaches to innovation management have become prime drivers of various industries. Considering product quality, product innovation and service innovation in the automotive industry, this study tries to adopt game theory and real option models to analyze competing and consuming behavior among high- quality firms, low-quality firms and rational consumers. With an argument that firms will undertake innovation activities if they produce high-quality products, this study wishes to demonstrate that high quality products will induce both product and service innovations simultaneously. To achieve the research objective, this study divides innovation into product and service innovations, and then, discusses quality’s impacts on product and service innovations separately. Game theory models concerning quality and product innovation indicate that the fixed cost of innovation, the barrier to a firm’s engaging in innovative activities, is overcome only if a firm produces high-quality products. Moreover, another dynamic game also shows the strong relationship between product quality and service innovation. Applying real options models to evaluate service innovations in the automotive industry, including half-price purchase warranty and extended test drive service, also verify that effective service innovations might increase consumer willing- to-buy and enlarge the sales and profits for the innovative firms. Besides quality, this study also reveals that consumer preference to new product or service is another key successful factor for business innovation management. Successful innovation management depends on continuously improving product and service, concerning the status of expected market, and understanding the needs of potential consumers. Even though a general consensus on product and service innovations among different industries remains lacking, this study strongly supports the argument that firms producing high-quality products will be active in innovations. From the broader perspective of process management, total quality management, which increases product quality, undoubtedly supports innovation management. Keywords: Product Quality, Product Innovation, Service Innovation, Game Theory, Real Options. iii.
(6) A Study of Innovation and Quality in the Automotive Industry TABLE OF CONTENTS. ABSTRACT… … … … … … … … … … … … … … … … … … … … … … … … … … … … ii TABLE OF CONTENTS … … … … … … … … … … … … … … … … … … … … … … … iv LIST OF TABLES … … … … … … … … … … … … … … … … … … … … … … … … … .. vi LIST OF FIGURES … … … … … … … … … … … … … … … … … … … … … … … … ... vii CHAPTER 1 INTRODUCTION … … … … … … … … … … … … … … … … … … … … .. 1 1.1 Research Background … … … … … … … … … … … … … … … … … … … … … … … . 1 1.2 Research Objectives… … … … … … … … … … … … … … … … … … … … … … … ... 3 1.3 Research Boundaries… … … … … … … … … … … … … … … … … … … … … … … . . 4 1.4 Overview of the Research Methodology… … … … … … … … … … … … … … … .... 5 1.4.1 Game Theory… … … … … … … … … … … … … … … … … … … … … … … … . 5 1.4.2 Real Option Theory… … … … … … … … … … … … … … … … … … … … … ... 5 1.5 Outline of the Dissertation… … … … … … … … … … … … … … … … … … … … … ..6 CHAPTER 2 LITERATURE REVIEW … … … … … … … … … … … … … … … … … ... 8 2.1 Innovation… … … … … … … … … … … … … … … … … … … … … … … … … … … ... 8 2.2 Typology of innovation… … … … … … … … … … … … … … … … … … … … … … ... 8 2.3 Service Innovation… … … … … … … … … … … … … … … … … … … … … … … … ..11 2.4 Product Quality … … … … … … … … … … … … … … … … … … … … … … … … … ..14 2.5 Product Quality and Innovation Management… … … … … … … … … … … … … .14 2.6 TQM and Innovation Management… … … … … … … . . . … … … … … … … … … … . 1 5 2.7 Tools to Evaluate Innovation… … … … … … … … … … … … … … … … … … . . … … 1 7 2.8 Other Potential Determinants of Innovation… … … … … … … … … … … … . . … … 1 8 2.8.1 Individual Influences on Innovation… … … … … … … … … … … … … . . … … 1 9 2.8.2 Organizational Influences on Innovation… … … . … … … … … … … … … … 1 9 2.8.3 Environmental Influences on Innovation… … … . … … … … … … … … … … 2 0 CHAPTER 3 PRODUCT QUALITY AND PRODUCT INNOVATION: A GAME THEORY APPROACH… … … … … … … … … … … … … … 2 1 3.1 Basic Model… … … … … … … … … … … … … … … … … … … … … … … … … … … 2 2 3.2 Quality-based Innovation Model… … … … … … … … … … … … … … … … … … … 2 5 3.3 Dynamic Games of the Quality-based Innovation Model… … … … … … … … … ..28 3.4 Findings and Discussion… … … … … … … … … … . . . … … … … … … … … … … … . . 30 CHAPTER 4 PRODUCT QUALITY AND SERVICE INNOVATION: A GAME THEORY APPROACH… … … … … … … … … … … … … … 3 2 4.1 Service Innovations in the Automotive Industry … … … … … … … … … … … … … 3 2. iv.
(7) 4.2 Half-priced Warranties Service… … … … … … … … … … … … … … … … … … … ..34 4.3 Basic Model… … … … … … … … … … … … … … … … … … … … … … … … … … … 3 5 4.4 Generalized Model of Durable Products with Half-Price Warranties Service…...38 4.5 Characterization of Equilibrium… … … … … … … … … … … … … … … … … … … . 4 8 4.5.1 Full Information Equilibrium… … … … … … … … … … … … … … … … … … 4 8 4.5.2 Incomplete Information Equilibrium… … … … … … … … … … … … … … … .50 4.6 Findings and Discussion… … … … … … … … … … … … … … … … … … … … … … . 53 CHAPTER 5 AN EMPIRICAL STUDTY: APPLYING OPTIONS TO EVALUATE SERVICE INNOVATIONS … … … … … … … … … … … ..55 5.1 Service Innovations in the Automotive Industry… … … … … … … … … … … … … 5 5 5.1.1 Extended Test Drive Service … … … … … … … … … … … … … … … … … … .56 5.1.2 Sale of Half-priced Warranties… … … … … … … … … … … … … … … … … ..56 5.2 Providing Option-Based Service Innovations… … … … … … … … … … … … … … 5 7 5.2.1 Options-based Valuation of Extended Test Drive Service … … … … … … … 5 9 5.2.2 Options-based Valuation of Half-price Purchase Warranties… … … … … … 6 0 5.3 Findings and Discussion… … … … … … … … … … … … … … … … … … … … … … .62 CHAPTER 6 CONCLUSIONS AND IMPLICATIONS … … … … … . . … … … . . . … … 6 4 6.1 Conclusions… … … … . . … … … … … … … … … … … … … … … … … … … … . … ..64 6.2 Management Implications… … … … … . … … … … … … … … … … … … … … … ..69 6.3 Future Research… … … . … … … … … … … … … … … … … … … … … … … … … … .70 REFERENCES … … … … … … … … … … … … … … … … … … … … … … … … … … … 74 Appendix 1 … … … … … … … … … … … … … … … … … … … … … … … … … … … … . . 81 Appendix 2 … … … … … … … … … … … … … … … … … … … … … … … … … … … … .. 81. v.
(8) LIST OF TABLES. Table 2.1 Crucial Types of Innovation… … … … … … … … … … … … … … … … … … .10 Table 2.2 Characteristics of Service Innovation… … … … … … … … … … … … … . . … 1 3 Table 5.1 Summary of service innovations in the motor market… … … … … … … … . 62. vi.
(9) LIST OF FIGURES. Figure 1.1 The Flow of this Thesis… … … … … … … . . … … … … … … … … … … . . ….7 Figure 3.1 Processes of Quality-based Innovation Models… … … … … … … … … … ..21 Figure 3.2 Market Demand Curves of Innovative and Non- innovative Firms… … … 2 7 Figure 3.3 Extensive-form Game Corresponding to the Quality-based Innovation Model… … … … … … … … … … … … … … … … … … … … … … … … … … .29 Figure 3.4 Dynamic Game of Complete Information under q = H … … . … … … … . 31 Figure 3.5 Dynamic Game of Complete Information under q = L … … … … … … ...31 Figure 4.1 Product Stages and Corresponding Innovation Activities in the Automotive Industry. … … … … … … … … … … … … … … . … … … … … … .33 Figure 4.2 Extensive- form Game Corresponding to the Generalized Model… … … . . . 3 9 Figure 4.3 Consumer Utility when P ≦ r(1/2) = y ≦ r(0), or q = H … … … . 4 3 Figure 4.4 Consumer Utility when 0 ≦ r(1/2) = y ≦ P , or q = L … … … . … ..44 Figure 4.5 Full- information Solutions in the Subforms of S = 0 and S = 1 … … … . . . 4 7 Figure 4.6 Dynamic Games of Complete Information under q = H … … … … … … .49 Figure 4.7 Dynamic Games of Complete Information under q = L … … … … … … .50 Figure 4.8 Extensive- form Dynamic Game of Incomplete Information… … … … … ..51. vii.
(10) CHAPTER 1 INTRODUCTION. 1.1 Research Background Over the past decade, new approaches to innovation management have become prime drivers of various industries. As product life cycles condense and substitutive product offerings expand, product innovation becomes increasingly outstanding for establishing sustainable competitive advantage. In the manufacturing industries, product quality is regarded as a strong basis of innovation conducts the implementation of new product development. Therefore, the causal relatio nship between product quality and product innovation must be clarified before innovation can be adequately assessed in all industries. Besides manufacturing industries, the service sector is an important role to the economy of every advanced society and accounts for over two-thirds of the jobs in most advanced countries. This situation results from historical developments from extraction through manufacturing to services. To remain competitive in the global market, manufacturing firms have innovated to meet customer demand, to raise their market share, and to increase profitability. Service firms have acted similarly and innovation theory has been extended to the service industries (Evangelista & Sirilli, 1998; Aa & Elfring, 2002). Recently, researchers have examined the meaning and characteristics of product innovation. However, little information is available on the understanding and valuation of service innovations. For example, only technological and process innovations have been examined in studies of the manufacturing industries (Afuah, 1997; Takeishi, 2001; Laosirihongthong, Paul, & Speece, 2003; Marchau & Van der Heijden, 2003), while service innovation in the service sector has not been widely studied. The lack of such information constitutes a gap in our knowledge of innovation management. 1.
(11) Markets for durable products have attracted increasing interest from firms that provide innovative services for their new products. In the automotive industry, for instance, nearly all motor companies sell new cars with financial, marketing, maintenance, repairing, warranty and repossession services. Unsurprisingly, most consumers prefer products with pre-sold and post-sold services, which increase motivation to purchase. Firms accordingly provide more extended services to satisfy the tastes of consumers and establish the reputation of their products. Focusing on automotive industry, this study tries to explore the nature and characteristics of service innovation, and also wishes to discuss product quality’s impacts on the adoption and development of innovative services. In some recent studies, Dubey and Wu (2002) and Romijn and Albaladejo (2002) showed that product innovation will occurs only when the industry size is intermediate. In addition, oligopolistic firms will engage in innovation to advance their product quality. This research wishes to challenge this viewpoint and argues that firms will not undertake innovation activities unless they produce high-quality products. The determinant of innovation contains product quality but not industry size. Innovation involving high risk in the initiation stage is not necessary to improve product quality (Damanpour & Gopalakrishnan, 2001). This study will demonstrate that high quality products will induce both product and service innovations. As important providers for both product and service innovations, automakers around the world have undertaken many famous innovative activities since automobiles had been invented in the late nineteen century. To be universally known, safety belt, ABS (anti- lock braking system), and air bags are three most important innovative products in the history of passenger cars; in addition, process innovation, such as JIT (just in time) technique of Toyota motors also provides competitive advantage for the motor firms. Extending to the sales of automobiles, firms also offer 2.
(12) various service innovations because consumers prefer products that come with pre-sold and post-sold services, which generally promote their purchase motivation. Meanwhile, service innovations cover all financial and marketing innovations before products are sold, as well as all maintenance, repairing, warranty and repossessing activities after products are sold. In fact, every purchase activity combines the consumption of products and services at different rates (Fitzsimmons & Fitzsimmons, 1994). Automotive industry represents an important example of the combination of products and services.. 1.2 Research Objectives In the marketplace where innovators and followers compete fiercely, who will benefit from the competition? To clarify the causal relationship between product quality and innovation, this study divides innovation into product innovation and service innovation, and then, discusses quality’s impacts on product and service innovations separately. With a quality-based approach, this study wishes to establish models to demonstrate that both product and service innovations will be strongly influenced by product quality itself. Focus on the automotive industry, which is one of the most important durable products, this study also contributes to quality management by empirically analyzing how some firms manage to be more innovative than their competitors. This study argues that firms producing high-quality products will actively engage in both product and service innovations. Moreover, this research discusses product and service innovations for durable products because most service innovations are provided concerning a long time of usage. Thus, the objectives of this research are as below: (1) To construct a game theory model to explore the causal relationship between product quality and product innovation. 3.
(13) (2) To construct a game theory model to explicate the quality’s impacts on service innovation in the automotive industry. (3) To apply real option theory to test and verify the quality’s impacts on service innovation in the automotive industry. (4) With further discussion and suggestion, this study also wises to contribute to more understanding of product innovation, service innovation and quality management by analyzing their interrelationships and managerial implications. (5) This study also suggests systematic methods to evaluate and analyze different forms of innovation activities from perspectives of game theory and option pricing models.. 1.3 Research Boundaries To discuss the relationship between product quality and innovation, product innovations in this study involve new products, processes, procedures and technologies introduced; service innovations cover all marketing innovations before products are sold and all associated financial, maintenance, repairing, warranty and repossessing activities. And for simplicity, the definition of product quality will adopt a simpler form when building game theory models, that is, quality is defined as the probability of a randomly selected consumer being satisfied with a product. On the other hand, the empirical analyses of this research introduce the general error (problems) in products sold and used by customers to represent product quality in the automotive ind ustry. All details of the definitions and recent literature on quality and innovation will be further discussed in Chapter 2. Concerning the target industry to be analyzed in this research, automotive industry will be proposed in the stages of models building and empirical investigation.. 4.
(14) 1.4 Overview of the Research Methodology To achieve the research objectives described above, this study uses two main research methods including game theory and real option theory. Since all detailed research methods will be presented on Chapter 3 to 5, only the reasons why this dissertation adopt these research methods will be briefly introduced below.. 1.4.1 Game Theory Regarding durable products and their product quality, high-quality firms, low-quality firms and consumers form dynamic games of complete or incomplete information. First, the firms must decide whether to offer innovative products or services, and then set their price based on this decision. Second, customers read the price and innovation decisions of the firm and make their purchase decisions accordingly. The firm is the first to decide and act, so the games are dynamic.. 1.4.2 Real Option Theory This study applies an options-based model for valuing and verifying the service innovations introduced by game theory models. In fact, option pricing is more appropriate than traditional discounted cash flow (DCF) for evaluating innovative investments (Afuah, 1998). DCF uses a high discount rate to represent uncertainty in the marketplace, which is characterized by change and uncertainty. An investor will reduce his investment when facing risk, under a DCF assessment. In contrast, options-based valuation considers uncertainty as an opportunity to increase profit. As new information arrives and uncertainty decreases, investors and managers have the right, without associated symmetric obligations, to make profitable decisions. Most innovative activities are highly risky, and are undertaken only if the managers evaluate the innovative investment using options-based thinking (Faulkner, 1996). 5.
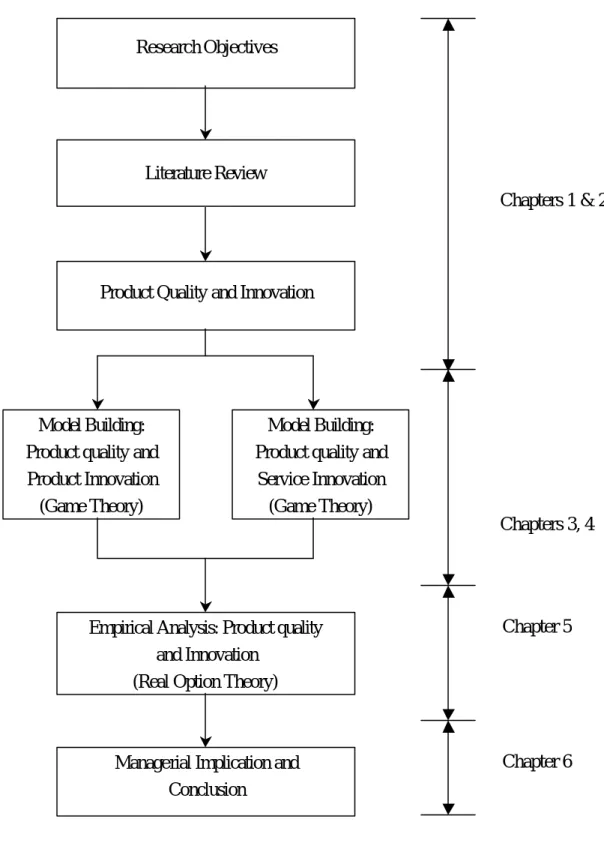
(15) 1.5 Outline of the Dissertation Figure 1.1 describes the outline of the dissertation. The contents of this dissertation are organized as follows. Chapter 2 reviews the relevant literature on product quality, product innovation and service innovation. Chapter 3 constructs a game theory model to explore the causal relationship between product quality and product innovation. Chapter 4 constructs a game theory model to explicate the quality’s impacts on service innovation for the automotive ind ustry. To test and verify the results introduced from Chapters 3 and 4, Chapter 5 applies real option theory to value and analyze the quality’s impacts on service innovation in the automotive industry. Chapter 6 finally derives some main conclusions and suggests the possible directions of future research.. 6.
(16) Research Objectives. Literature Review Chapters 1 & 2. Product Quality and Innovation. Model Building: Product quality and Product Innovation (Game Theory). Model Building: Product quality and Service Innovation (Game Theory) Chapters 3, 4. Empirical Analysis: Product quality and Innovation (Real Option Theory). Chapter 5. Managerial Implication and Conclusion. Chapter 6. Figure 1.1 The Flow of this Thesis. 7.
(17) CHAPTER 2 LITERATURE REVIEW. 2.1 Innovation The definition and classification of innovation vary among the various studies. Drucker (1985) asserted that innovation involves invention and commercialization. Tushman and Nadler (1986) considered that innovations include new products, services or production processes introduced by firms. From the perspective of management, they described innovation as the creation of value from knowledge or information. Recently from an organizational perspective, innovation has been defined as the adoption of an internally generated or purchased device, system, policy, program, process, product or service that is new to the adopting organization (Damanpour, 1991). Several scholars have since acknowledged that innovation as the origination of an innovative product or process (Swanson, 1994; Newell & Swan, 1995). This study adopts a broad definition of innova tion that covers individual, organizational and contextual factors that relate to product, process, service and administrative functions.. 2.2 Typology of innovation Previous studies have asserted that discriminating types of innovation is important in understanding firms’ adoptive behaviors and elucidating the determinants of innovation. Of various typologies of innovation, four have attracted the most interest; these are administrative and technical (Daft, 1978; Kimberly & Evanisko, 1981), product and process (Utterback & Abernathy, 1975; Damanour, 1991), radical and incremental (Dewar and Dutton, 1986), and product, process, marketing and administrative (Higgins, 1995). The distinction between administrative and technical typologies is important, because it relates to a general consideration of social structure 8.
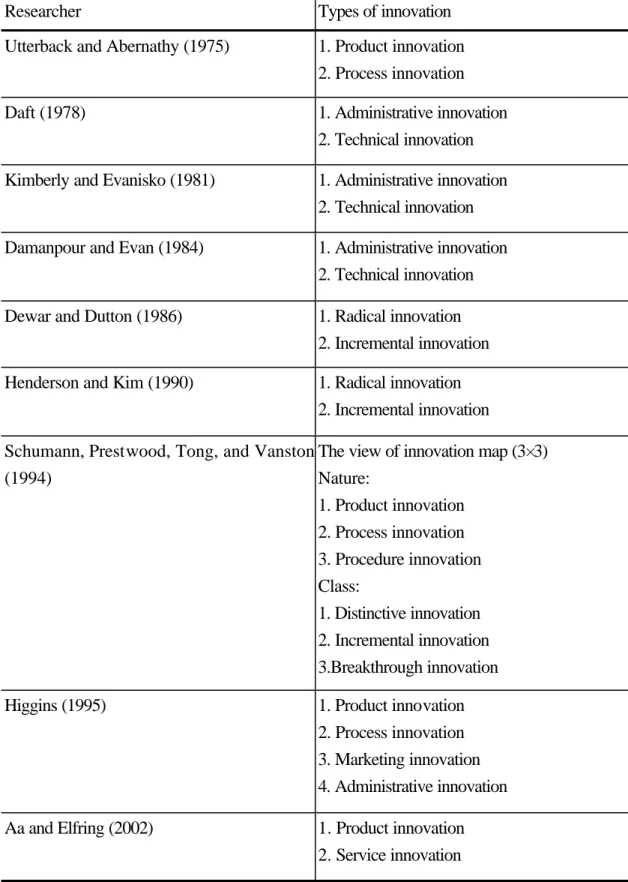
(18) and technology (Damanpour, 1991). Product innovations are new products or services introduced to a user or a market, and process innovations are new elements introduced to an organization (Damonour, 1991; Damanpour & Gopalakrishnan, 2001). Technical innovations involve products, services and process technology related to a firm’s activities, and administrative innovations involve organizational structure, system, policy and service (Kimberly & Evanisko, 1981). Radical innovations cause fundamental changes, while incremental innovations result only in small changes or improvements (Dewar & Dutton, 1986). Marketing innovations include price, promotion, place and product innovations (Higgins, 1995). Service innovations are not clearly defined or classified. They are considered to be product innovations (Damanpour, 1991), technical innovations (Kimberly & Evanisko, 1981), or a type of marketing innovation (Higgins, 1995). Although these typologies do not cause problems in the manufacturing or pure service sector, they can cause general misunderstandings. In industries that involve both manufacturing and service activities, such as the automotive industry, product innovations must be newly distinguished from service innovations. Product innovation and administrative innovation have been well-defined in previous studies, and only service innovation is addressed hereafter. The crucial types of innovation are shown in Table 2.1.. 9.
(19) Table 2.1 Crucial Types of Innovation Researcher. Types of innovation. Utterback and Abernathy (1975). 1. Product innovation 2. Process innovation. Daft (1978). 1. Administrative innovation 2. Technical innovation. Kimberly and Evanisko (1981). 1. Administrative innovation 2. Technical innovation. Damanpour and Evan (1984). 1. Administrative innovation 2. Technical innovation. Dewar and Dutton (1986). 1. Radical innovation 2. Incremental innovation. Henderson and Kim (1990). 1. Radical innovation 2. Incremental innovation. Schumann, Prestwood, Tong, and Vanston The view of innovation map (3×3) (1994) Nature: 1. Product innovation 2. Process innovation 3. Procedure innovation Class: 1. Distinctive innovation 2. Incremental innovation 3.Breakthrough innovation Higgins (1995). 1. Product innovation 2. Process innovation 3. Marketing innovation 4. Administrative innovation. Aa and Elfring (2002). 1. Product innovation 2. Service innovation. 10.
(20) 2.3 Service Innovation Service innovations seem to be difficult to understand using traditional innovation theories and typologies (Damanpour, 1991). Innovation theory has been based on technical innovation in manufacturing firms. However, the fuzzy nature of service output makes difficult the measurement of service innovation by traditional managerial and economic methods (Gallouj & Weinstein, 1997). The emphasis in the field of innovation has been on product or organizational innovations in production industries. Relatively little research has concentrated on service innovation. The recent literature on service innovation has three main dimensions - innovation processes or new product development processes in a service firm (Sundbo, 1997), the role of IT in services (Quinn & Paquette, 1990; Barras, 1990) and types of service innovations (Aa & Elfring, 2002). In this work, innovations are grouped into three types. Product innovations involve new products, processes, procedures and technologies introduced, as well as innovations in existing products. Administrative innovations involve newly introduced organizational structures, systems or policies. Besides administrative and product innovations, service innovations cover all marketing innovations before products are sold and all associated financial, maintenance, repairing, warranty and repossessing activities. Realizing innovation in services, Aa and Elfring (2002) redefined innovation broadly, encompassing ideas, practices, and objects that are new to a firm and environment, or to groups of potential competitors. They also addressed four forms of innovation in services, including multi- unit organization, new combinations of services, the-customer-as-co-producer, and technological innovations. Gallouj and Weinstein (1997), considering social relationships, proposed four specifics of services, including problems of product standardization, the manifestation of a product through its effects over time, the service relationship and the difficulty in distinguishing 11.
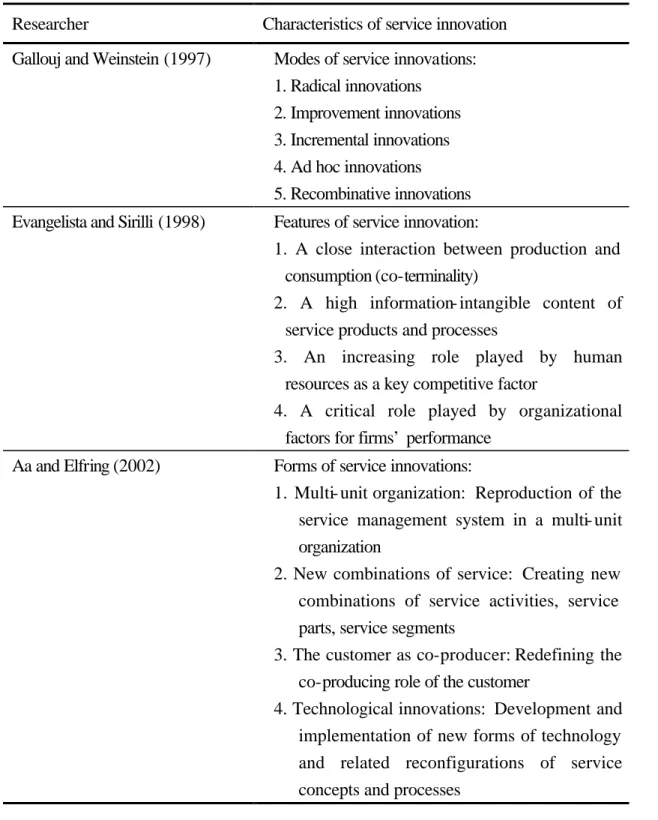
(21) products from processes in services. They also claimed five modes of service innovations - radical innovations, innovative improvements, incremental innovations, ad hoc innovations and recombinative innovations. A general consensus on service innovations is still absent, but Table 2.2 presents the characteristics of service innovation that have important implicatio ns.. Service innovation involves new. service development processes, the evaluation of innovative services, the role of information and communication technologies in providing services and sources of service innovation. The service sector is developing drastically, and studies of service innovation are becoming increasingly important.. 12.
(22) Table 2.2 Characteristics of Service Innovation Researcher. Characteristics of service innovation. Gallouj and Weinstein (1997). Modes of service innovations: 1. Radical innovations 2. Improvement innovations 3. Incremental innovations 4. Ad hoc innovations 5. Recombinative innovations. Evangelista and Sirilli (1998). Features of service innovation: 1. A close interaction between production and consumption (co-terminality) 2. A high information- intangible content of service products and processes 3. An increasing role played by human resources as a key competitive factor 4. A critical role played by organizational factors for firms’ performance. Aa and Elfring (2002). Forms of service innovations: 1. Multi- unit organization: Reproduction of the service management system in a multi- unit organization 2. New combinations of service: Creating new combinations of service activities, service parts, service segments 3. The customer as co-producer: Redefining the co-producing role of the customer 4. Technological innovations: Development and implementation of new forms of technology and related reconfigurations of service concepts and processes. 13.
(23) 2.4 Product Quality Quality is part of our life in the changing world. Traditionally, product quality is generally considered as being the ability of a firm to provide products that satisfy the customer and the market, and is often separated into eight dimensions, including performance, features, reliability, conformance, durability, serviceability, aesthetics, and perceived quality (Garvin, 1987). For simplicity and objectivity, however, the definition of product quality will adopt a simpler form when building game theory models. Following Milgram and Roberts (1986) and Shieh (1993), quality, denoted by q, is defined as the probability of a randomly selected consumer being satisfied with a product. Suppose q can only take two values, high (H) or low (L), with 1 > H > L > 0. High-quality firms (H-type firms) will produce high-quality products (H-type products), which will satisfy the customers with a probability of H. Additionally, the probability of H-type product performing poorly and not satisfying customers is 1 - H. Meanwhile, L-type products have a probability of L of performing well and satisfying customers, and a probability of 1 - L of performing poorly. The actual qualities of the products are uncertain, and will remain unknown until the product is purchased. All customers prefer H to L because H-type products have a higher probability of working well. On the other hand, some empirical researches introduce the general error (problems) in products sold and used by customers (Cole, 2002) to represent product quality in the manufacturing industries.. 2.5 Product Quality and Innovation Management Using economic models, Dubey and Wu (2002) and Fishman and Rob (2002) proved that production firms attempted costly and risky product innovation to improve the quality of their products. Based on responses from 244 manufacturing 14.
(24) firms, Koufteros, Vonderembse, and Doll (2002) also supported the claim that product innovation seems positively to affect quality. Additionally, Dubey and Wu (2002) showed that product innovation occurred only when the industry was of intermediate size and that only oligopolistic firms performed innovation to improve their products. Although some literature is available on oligopolistic firms’ product innovations (Damanpour & Gopalakrishnan, 2001; Koufteros, Vonderembse, & Doll, 2002), an unresolved question remains. In the marketplace, firms in all industries stress their innovativeness to increase the market demand. Among fierce competition, competitive companies continually introduce new products to increase consumers’ willing-to-buy. Lacking competition, monopolies also implement innovation to ensure diversification. Rather than causing a price war, oligopolistic firms innovate products to distinguish themselves from the others. Regardless of how the firms compete, innovation has become a core competency of all businesses. In the literature, competitor size does not significantly affect firms’ adoption and diffusion of innovation (Kimberly & Evanisko, 1981; Frambach, Barkema, Nooteboom, & Wedel, 1998). Product innovation does not necessarily improve product quality since the innovative products normally bear uncertainty in the initiation innovation stage (Damanpour, 1991; Damanpour & Gopalakrishnan, 2001; Aa & Elfring, 2002). To investigate the construction industry in Dutch, Bossink (2002) showed that management of quality may help the management of innovation, and similar results have also been reported in other industries (Keogh & Bower, 1997). However, these works offered no rigid model or empirical survey in supporting the argument that product quality will enhance product or service innovation.. 2.6 TQM and Innovation Management During the last two decades, numerous firms have used technological innovation 15.
(25) to enhance their competitiveness, their market-share, and their profit in the global market. Theoretically, total quality management (TQM) is important as a strategic part of technological innovation in the manufacturing sector. Hence, the relationship between a manufacturing firm’s TQM implementation and innovating behavior, after TQM tools have been developed and implemented in companies around the world, must be discussed. The promise of TQM is that the firms will produce their products more efficiently and accurately by reducing variance and increasing process control, by adopting process management activities including TQM (Benner & Tushman, 2002). Several empirical works have investigated relationships between TQM implementation and organizational performance in some industries (Ittner & Larcker, 1997; Sterman, Repenning, & Kofman, 1997), but research has reached seemingly contradictory conclusions on relationship between TQM and innovation. On the one hand, Cole (2002) and Bossink (2002) indicated that TQM tools promoted firm’s management of technological innovation. On the other hand, Sørensen and Stuard (2000) showed that process routines might reduce the fit between organizations and market demands in rapidly changing marketplaces. As manufacturing processes continuously improve, TQM is an important element of process management; associated techniques focus on increasing efficiency by coordinating all departments and employees in the company. The TQM philosophy, concentrated on organizational coordination, rationalization of procedures, and duplicating of routines, is a procedure-oriented activity for reducing the number of defective, over- variant products (Stevenson, 2002; Laosirihongthong, Paul, & Speece, 2003). With reference to the Dutch construction industry, Bossink (2002) demonstrated that quality management supported the management of innovation, and similar results have also been obtained in the oil industry (Keogh and Bower, 1997). 16.
(26) Unfortunately, these studies provided no empirical evidence in support of their claims. From a perspective of organizational evolution and learning, companies try to improve procedural routines and thus lose touch with market demands, as they overvalue short-term performance and the avoidance of risk. And, to take risks often reveals opportunities for innovation (Stuart & Podolny, 1996; Sørensen & Stuard, 2000). From the perspective of product innovation that stresses the offering of new products or services to customers, greater process control may result in fewer opportunities to develop innovative products. More generally, organizational adaptation related research has revealed different effects of exploitative and exploratory innovation. Exploitative innovation involves progress and refinement based on existing organizational knowledge, whereas exploratory innovation involves substantial changes that rely on a very little or no current organizational knowledge (March, 1991). Empirical evidence suggested that when organizational routines emphasize standardized and repeated production processes, companies tend to exploit existing knowledge, and consequently neglect exploratory innovation associated with high risk (Tushman & Nelson, 1990; Benner & Tushman, 2002; Benner & Tushman, 2003). Thus, from the perspective of process innovation that underlines the innovative activities associated with new or modified manufacturing process, TQM implementation may increase the adoption and diffusion of process innovation.. 2.7 Tools to Evaluate Innovation It’s not easy to develop measurements of product, service, and organizational innovation because the natures of innovation activities are fuzzy, multi-objective, and hard to be evaluated. Most representative tools to evaluate firm’s innovation activities, such as KEYS and IQI, were developed on the bases of survey and questionnaire 17.
(27) techniques. In order to understand the improving and impairing factors of organizational innovation, Amabile et al. (1996) developed the KEYS questionnaire to assess the climate of creativity. Containing 12,525 samples in 21 industries, KEYS divided dimensions of creativity into encouragement of organization, encouragement of supervisors, supports of working teams, sufficient resource, working autonomy, challenges of works, and the barriers of organization. Group and organizational characteris tics including team form, organizational culture, organizational strategy and corporate structure presented the crucial inputs of KEYS. Innovation quotient inventory (IQI, Hingins, 1995) were developed to measure organizational innovation in four important aspects containing product innovation, process innovation, marketing innovation, and administrative innovation. IQI characteristics of product innovation included organizational strategy, structure, system, style, employment, sharing values, and skills to facilitate product innovation. Only few studies in the past adopted economic or mathematic methods to evaluate innovation; thus, one of the objectives of this study is the attempt to use other research methods to analyze product and service innovations.. 2.8 Other Potential Determinants of Innovation During the last decade, numerous scholars have sought to identify influences on innovation capacity. These scholars have continuously scrutinized the determinants of innovation activities. Addressing three important sources of individual, organizational, and contextual determinants for inducing managerial innovations (Kimberly & Evanisko, 1981; Amabile et al., 1996), many variables have been singled out to test the causal relationship between variable and innovation.. 18.
(28) 2.8.1 Individual Influences on Innovation In researching the influences on the adoption of innovation, professionalism that reflects professional knowledge of administrators and other organizational members had been addressed as the individual determinant of innovation on various industries. Past research has found administrator education and employee training to be consistent influences on adoption behavior (Daft, 1978; Damanpour, 1991). Investigating the adoption behavior of organizational innovation in the electronics and software industries, Romijn and Albaladejo (2002) examined and found that internal sources of organizational innovation should contain manager professional background, and workforce skill. When using a corporate structure as the structural innovation in hospitals, Arndt and Bigelow (1995) emphasized the potential influences of professionalism.. Administrator. professionalism. or. education. represents. the. characteristics of individuals in positions of authority, and should explain innovation related decisions, whereas the on-the-job training of every employee may support the working skill when facing changing environment.. 2.8.2 Organizational Influences on Innovation The literature on organizational innovation distinguishes organiza tional age and size (Arndt & Bigelow, 1995). However, research on the influences of organizational age and size on innovation adoption has yielded conflicting conclusions. Some research has examined the positive relationship between organizational age and organizational innovation (Sørensen & Stuard, 2000; Rao & Drazin, 2002), but other research found that organizational age was negatively related to innovation (Kimberly & Evanisko, 1981). Innovation behavior may differ among industries. Researchers of organizational innovation also found it to have an inconsistent impact on organization size. Recognizing that organizational size was positively related to technological 19.
(29) innovation (Goes & Park, 1997), Li and Atuaheng-Gima (2001) found that size did not influence product innovation in Chinese firms.. 2.8.3 Environmental Influences on Innovation From the perspective of organizational adaptation, the importance of environment context for innovation has been recognized, but has rarely been examined empirically (Arndt & Bigelow, 1995; Romijn & Albaladejo, 2002). Competition is the first environmental variable indicating the number of major competitors in the global electronics market (Thomas et al., 1999). Competition is generally considered to increase technological and administrative innovation (Kimberly & Evanisko, 1981; Arndt & Bigelow, 2000). Another crucial environmental variable is financial distress, which indicates the ratio of firm debts to assets. The greater the debts of a firm, the more environmental pressure from external creditors may change the decision to adopt innovation activities to increase competitiveness (Zajac & Kraatz, 1993). More financially distressed organizations may be more sensitive in acknowledging the need for innovation (Bowman & Singh, 1993).. 20.
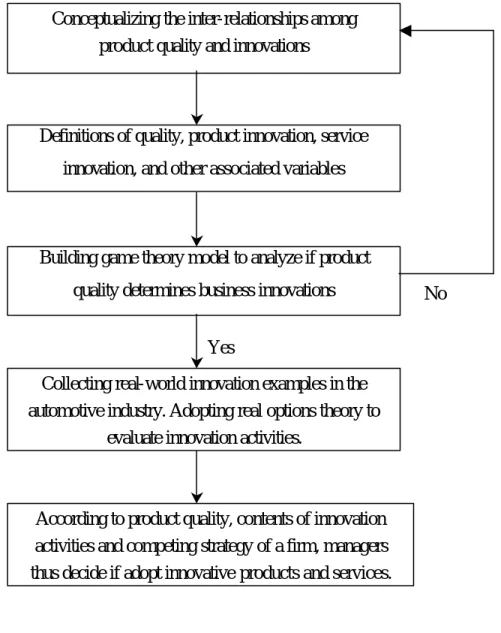
(30) CHAPTER 3 PRODUCT QUALITY AND PRODUCT INNOVATION: A GAME THEORY APPROACH. Chapters 3, 4 and 5 describe the central issues of this study—the analyses and evaluations of innovation activities in the automotive industry. Figure 3.1 presents processes of the quality-based innovation models in these chapters.. Conceptualizing the inter-relationships among product quality and innovations. Definitions of quality, product innovation, service innovation, and other associated variables. Building game theory model to analyze if product quality determines business innovations. No. Yes Collecting real-world innovation examples in the automotive industry. Adopting real options theory to evaluate innovation activities.. According to product quality, contents of innovation activities and competing strategy of a firm, managers thus decide if adopt innovative products and services.. Figure 3.1 Processes of Quality-based Innovation Models. 21.
(31) This chapter tries to explicate the causal relationship between product quality and product innovation. Game theory models indicate that the fixed cost of innovation, the barrier to a firm’s engaging in innovative activities, is overcome only if a firm produces high-quality products. The findings of this chapter indicate that product quality may determine product innovation. A better understanding of this issue will help to explain the strategic production decisions for innovative firms in the manufacturing industries.. 3.1 Basic Model Consider a one-period model involving one firm and a group of rational consumers; product quality is known by the firm, and is known or unknown to consumers. This work uses only a full information model, in which product quality is known to consumers. The firm that produces products of a fixed quality sets its price to maximize profit, given existing consumer demand and manufacturing cost. Simultaneously, rational consumers prefer high-quality products or lower product prices, to maximize their utility (see Bagwell, 1992). For simplicity, all variables used here are indexes over the interval [0, 1], and transformed linearly according to the real-world market situations. For example, price = 1 indicates the highest price setting for all firms; and price = 0 means zero setting (free) for the firm. Now let, P ≡ product price. 0 ≦ P ≦ 1. r ≡ monetary valuation. Following Bagwell and Riordan (1991), Al-Najjar (1995) and Shieh (1996), let r represent the monetary valuation made by a potential consumer to a working and satisfactory product. The consumer knows their monetary valuation r before deciding whether to make a purchase. An individual consumer will not buy if r < P, and will only 22.
(32) buy if r > P. Consider a consumer who pays P for the product; the utility of this consumer is r - P if the product works satisfactorily, and is -P if the product breaks or is unsatisfactory. 0 ≦ r ≦ 1. N ≡ product innovation, which can only take two values, 0 or 1. N = 1 means that the firm has developed an innovative product or has included some originative functions in the product; N = 0, in contrast, means that the firm has not undertake any innovation. q ≡ product quality, which is defined as the probability that a randomly selected consumer is satisfied with this product. q can only take two values, high (H) or low (L), with 0 ≦ L < H ≦ 1. High-quality firms (H-type firms) will produce high-quality products (H-type products), which will satisfy the customers with a probability of H. Additionally, the probability of an H-type product’s performing poorly and not satisfying a customer is 1 - H. Meanwhile, L-type products have a probability L of performing well and satisfying customers, and a probability of 1 - L of performing poorly. Each customer prefers H to L because H-type products are more likely to work well. 0 ≦ q ≦ 1. C q ≡ the cost per unit at a q-type firm. Assume C H > C L and 0 ≦ C L < C H ≦ 1. Ω≡ the posterior belief that q = H ; let the expected quality, or the probability of buying a working product be given by Q(Ω) ≡ ΩH + (1 - Ω)L. 0 ≦ Ω ≦ 1.. Milgrom and Roberts (1986) and Shieh (1993) suggested that a consumer with a monetary valuation of r will buy this product at price P if and only if his expected. 23.
(33) utility (EU) from buying this product is non-negative; that is,. EU(N = 0) = Ω〔H(r - P) + (1 - H)(-P)〕 + (1 - Ω)〔L( r- P) + (1 - L)(-P)〕 ≧ 0. Or, EU(N = 0) = rQ(Ω) - P ≧ 0. (3–1). (3–2). The marginal buyer is indifferent between buying or not: r * = P/ Q(Ω). Now, the demand function (note 0≦ D q ≦1), given N = 0, can be expressed as,. 1 − P / Q( Ω) if P ≤ Q( Ω) D q (N = 0) = 0 Otherwise . (3–3). Given demand, the profit (note 0≦ ð q ≦1)of the firm is,. ( P − C )[1 − P / Q(Ω )] q ð q (N = 0) = 0 . if. P ≤ Q( Ω) (3–4). Otherwise. Under full information, each consumer knows the quality of the products of all firms. Equations (3–3) and (3–4) can then be rewritten as,. 1 − P / q if D q (N = 0) = 0 . P≤q (3–5) Otherwise. 24.
(34) ( P − C )(1 − P / q ) q ð q (N = 0) = 0 . if. P≤q (3–6). Otherwise. Solving Eq. (3–6) using the first order condition (F.O.C.) yields the full information equilibrium price P *q (N = 0) = (q + C q )/2, the equilibrium quantity Q *q (N = 0) = 1 - P/q = (q - C q )/2q, the marginal buyer r *q (N = 0) = (q + C q )/2q, and the maximum ð *q (N = 0) = (q - C q ) 2 / 4 q.. Lemma 1. When a firm does not undertake any innovation, the equilibrium price of the non-innovative product is P *q (N = 0) = (q + C q )/2, the equilibrium quantity Q *q (N = 0) = (q - C q )/2q, and the maximum profit of the firm is ð *q (N = 0) = (q - C q ) 2 / 4 q. Meanwhile, the consumer’s expected utility EU(N = 0) = rq - P.. 3.2 Quality-based Innovation Model Firms dedicate themselves to innovation if consumers’ willingness-to-buy is increased by these innovative products. Consequently, the incentive to buy a new product is directly provided by increasing consumer utility or lifting product evaluation (see Fishman & Rob, 2002). Although innovation is advantageous to the innovating companies, innovating is risky and complex, involving major fixed investments and a high rate of failure (see Brentani, 1995). Therefore, let I≡ increase in monetary valuation, by a potential consumer of a working and satisfactorily innovated product. 0 ≦ I ≦ 1. F≡ fixed cost of innovation, including the risk of failure. 0 ≦ F ≦ 1.. 25.
(35) Adding the innovation variables and considering again a consumer who pays P for the innovative product yields a consumer utility of r - P + I if the product works satisfactorily, and-P if the product breaks or is unsatisfactory. Then, solving Eqs (3–1) – (3–6) reveals that the consumer’s expected utility, EU(N = 1), and the corresponding demand function, D q (N = 1) , changes to, EU(N = 1) = Ω〔H(r - P + I) + (1 - H)(-P)〕 + (1 - Ω)〔L( r- P + I) + (1 - L)(-P)〕 ≧ 0. (3–7). EU(N = 1) = rq - P + qI > EU (N = 0). (3–8). D q (N = 1) = 1 - P/q + I > D q (N = 0). (3–9). And the firm’s profit function is, ð q (N = 1) = (P - C q ) (1 - P/q + I) - F. (3–10). Solving Eq. (3–10) using its first order condition (F.O.C.) reveals the full information equilibrium price, the equilibrium quantity, and the firm’s maximum profit as in Lemma 2.. Lemma 2. Under full information, if each consumer knows the quality of the products of all firms, the equilibrium price of the innovative product is P *q (N = 1) = [q(1+I) + C q ]/2, the equilibrium quantity is Q *q (N = 1) = [q(1+I) - C q ]/2q, and the maximum profit of the firm is Max ð *q (N = 1) = [q(1+I) - C q ] 2 / 4 q - F. The consumer’s expected utility is EU(N = 1) = rq - P + qI 26.
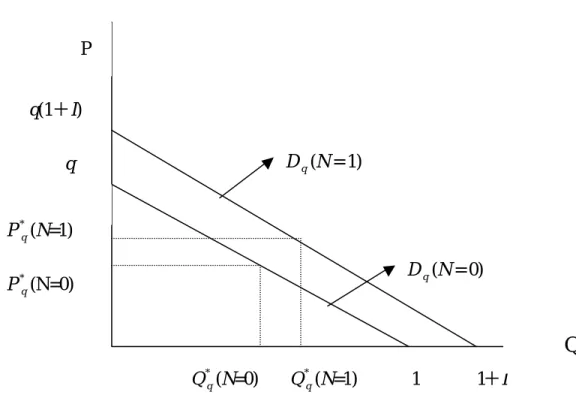
(36) Figure 3.2 compares some of the comparative results under the assumption of linear demand function. Clearly, for an innovative product, P *q (N = 1) = [q(1+I) + C q ]/2 > P *q (N = 0) = (q + C q )/2, Q *q (N = 1) = [q(1+I) - C q ]/2q > Q *q (N = 0) = (q - C q )/2q, and EU(N = 1) = rq - P + qI > EU(N = 0) = rq - P because I > 0. However, the profit of the innovative firm, ð *q (N = 1) = [q(1+I) - C q ] 2 / 4 q - F doe not necessarily exceed the non- innovative firm’s profit, ð *q (N = 0) = (q - C q ) 2 / 4 q. Thus, the preceding analytical results are summarized as follows.. P q(1+I) D q (N = 1). q. P *q (N=1) D q (N = 0). P *q (N=0). Q Q *q (N=0). Q *q (N=1). 1 1. 1+I. Figure 3.2 Market Demand Curves of Innovative and Non-innovative Firms. 27.
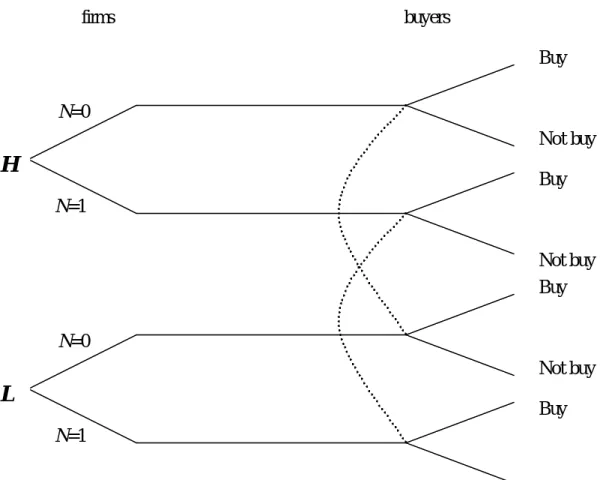
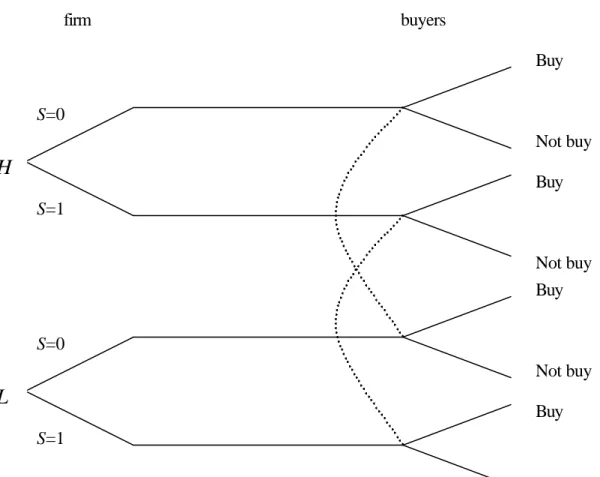
(37) Proposition 1. The innovative firm will increase the equilibrium price and the equilibrium quantity. Individual buyers prefer the innovative product, since the expected utility EU(N = 1) > EU(N = 0), if the firm sets a reasonable price. Moreover, the firm will increase its profit if it offers an innovative product when q = H; in contrast, the firm will decrease its profit if it offers an innovative product when q = L. Proof:See Appendix 1.. 3.3 Dynamic Games of the Quality-based Innovation Model Now, high-quality firms, low-quality firms and consumers form dynamic games of complete information. First, the firms must decide whether to offer innovative products, and they set their price accordingly. Second, customers read the price and innovation decisions of the firm and make their purchase decisions accordingly. The firm is the first to decide and act, so the games are dynamic. Figure 3.3 displays the extensive-form of the games, corresponding to the quality-based innovation model. Under full information, such that consumers know actual product quality, the interaction between a firm and an individual buyer is a dynamic game of complete information, as shown in Figures 3.4 and 3.5, given an actual product quality of H and L, respectively. Given q = H and N = 0 , the consumer utility, Hr - P > 0, is assumed and the consumer will buy the product if H approaches one. Moreover, given q = H and N = 1, consumer utility, Hr-P+HI > 0 since I > 0. Meanwhile, according to Proposition 1, the firm will increase its profits if it offers an innovative product when q = H. Therefore, for an H-type firm, the backwards- induced outcome [firm action, (consumer action given N = 1, consumer action given N = 0)] = [Innovate, (Buy, Buy)] is a subgame-perfect Nash equilibrium (SPNE). 28.
(38) firms. buyers Buy. N=0 Not buy. H. Buy N=1 Not buy Buy N=0 Not buy. L. Buy N=1 Not buy. Figure 3.3 Extensive-form Game Corresponding to the Quality-based Innovation Model. Given q = L and N = 0, consumer utility, Lr - P < 0 is assumed and the consumer does not buy the product since L is smaller than H and 1. Moreover, given q = L and N = 1, consumer utility, Lr - P +LI > 0 since I , the increase in monetary valuation, by a potential consumer, of a working and satisfactory innovative product, is sufficiently high. Furthermore, from Proposition 1, the firms’ profit will decrease if it offers an innovative product. Therefore, for an L-type firm, the backwards- induced outcome [firm action, (consumer action given N = 1, consumer action given N =. 0)] =. [Do not innovate, (Buy, Do not buy)] is the. subgame-perfect Nash equilibrium (SPNE).. 29.
(39) Proposition 2. When the innovative firm, the non-innovative firm and consumers form a dynamic game of complete information, the SPNE will be [firm’s action, (consumer action when the firm innovates, consumer action when the firm does not innovate)] = [Innovate, (Buy, Buy)] when the firm’s product quality is high; and [Do not Innovate, (Buy, Do not buy)] when the firm’s product quality is low.. 3.4 Findings and Discussion Figure 3.2 summarizes the main results concerning a firm’s innovation. The innovative firm has a higher equilibrium price and equilibrium quantity than the non- innovative firm. Individual buyers also prefer an innovative product, since the expected utility EU(N = 1) > EU(N = 0) if the firm sets a reasonable price. Moreover, as the barrier to the firm’s engaging in innovative activities, the fixed innovation cost will be overcome only if the firm produces high-quality products. Figures 3.4 and 3.5 show the strategic decisions of high-quality firms, low quality firms and rational consumers. Initially, only high-quality firms innovate to increase profit. Then, customers investigate the quality, price, and product innovativeness of the firms’ products as purchase information. Finally, only an innovative product of high quality can induce a consumer’s willing- to-buy because the failure of bad products causes the consumer to lose much money. Proposition 1 and Proposition 2 present these important results. Researchers are divided on the causal relationship between product quality and product innovation. The findings of this paper, however, imply that product quality may be a determinant of product innovation.. 30.
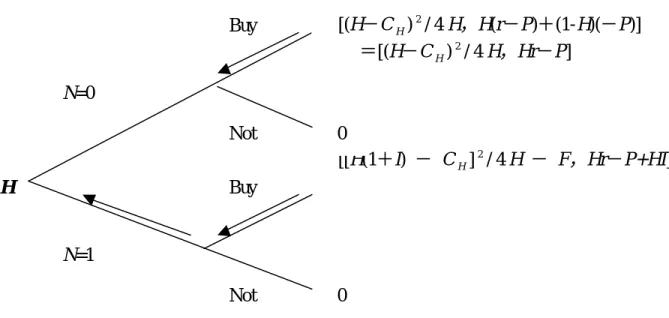
(40) (firm profit), (consumer expected utility) Buy. [(H-C H ) 2 / 4 H,H(r-P)+(1-H)(-P)] =[(H-C H ) 2 / 4 H,Hr-P]. Not. 0 [[H(1+I) - C H ] 2 / 4 H - F,Hr-P+HI]. N=0. H. Buy. N=1 Not. 0. Figure 3.4 Dynamic Game of Complete Information under q = H. Buy. [(L-C L ) 2 / 4 L,Lr-P]. Not. 0. N=0. L. Buy. [L(1+I) - C L ] 2 / 4 L - F,Lr-P+LI]. N=1 Not. 0. Figure 3.5 Dynamic Game of Complete Information under q = L. 31.
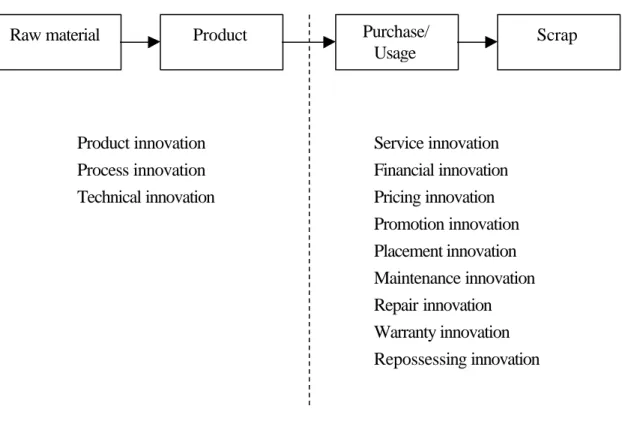
(41) CHAPTER 4 PRODUCT QUALITY AND SERVICE INNOVATION: A GAME THEORY APPROACH. The service sector is important in the economy of most advanced countries. Although service activities have been classified as business services, trade services, infrastructure services, personal services and public administration, distinguishing between products and services remains difficult. Several services, such as assembling and repairing, follow the selling of a product, yet restaurant service involves the production of many products. In fact, every purchase activity combines the consumption of products and services at different rates (Fitzsimmons & Fitzsimmons, 1994). Automotive industry represents an important example of the combination of products and services.. 4.1 Service Innovations in the Automotive Industry Most product markets are attracting increasing interest from firms that provide extended services to support their products. Unsurprisingly, most consumers prefer products that come with pre-sold and post-sold services, which generally promote their purchase motivation. Meanwhile, service innovations cover all financial and marketing innovations before products are sold, as well as all maintenance, repairing, warranty and repossessing activities after products are sold. By referring to the raw material, product, purchase and scrap stages of a product’s life cycle, depicted in Figure 4.1, customers can understand the differences between product and service innovations. Service innovation covers all innovative activities after the production of a product, before that product is discarded. Restated, service innovation involves a new service associated with increased willing-to-buy or consumer satisfaction before or after the product is sold. Service innovation in the automotive industry involves 32.
(42) financial innovation, pricing innovation, promotion innovation, placement innovation, maintenance innovation, repairing innovation, warranty innova tion and repossessing innovation, or the combination of at least two of these innovations. The points made so far apply in principle to most manufacturing and service industries. Half-priced warranties service, indeed, seems to be a representative service innovation widely provided by automotive firms and real estate companies in the recent years. Since service innovation remains difficult to be valued and modeled, it’s necessary to discuss. representative. cases. for. new. services.. Exhibiting. originality. and. innovativeness, half-priced warranties service also provides important clues for better understanding of service innovation.. Raw material. Purchase/ Usage. Product. Product innovation Process innovation Technical innovation. Scrap. Service innovation Financial innovation Pricing innovation Promotion innovation Placement innovation Maintenance innovation Repair innovation Warranty innovation Repossessing innovation. Figure 4.1 Product Stages and Corresponding Innovation Activities in the Automotive Industry. 33.
(43) 4.2 Half-priced Warranties Service Durable product markets show increasing interest from firms in providing extended warranties for new products. In the automobile industry, nearly all motor companies sell their new cars with new vehicle limited warranties. Not surprisingly most consumers prefer products with warranties because warranties generally boost their purchase motivation. Motor firms therefore provide long limited warranties to cater for consumer taste and establish confidence in their products. Furthermore, to ensure competitiveness many firms offer new vehicle limited warranties of up to 3 years or 36,000 miles. These warranties cover material or workmanship deficiencies in parts or components, and customers are not charged for warranty covered repairs made during the warranty period. Moreover, to ensure competitiveness, several firms are providing innovative services, such as longer vehicle limited warranties and half-price warranties. The former warranties cover material or workmanship deficiencies in parts or components for up to five years or 50,000 miles, and customers are not charged for covered repairs during the warranty period. With the half-price purchase warranties offered by Ford Taiwan and Honda Taiwan, each consumer is permitted initially to pay just half of the price of the new car, and then, after the products reaches half of its service life, the consumer can decide whether to keep the product and pay the balance of the purchase price, or simply return the used product to the firm without paying any mo re. The latter service is a broad combination of pricing innovation, warranty innovation, and old product repossessing innovation. Accompanying their product innovations, motor firms are providing innovative services to build their reputations and to increase profit (Utterback, 1994). Focusing on durable products, the rest of this chapter examines the informational role and optimality of half-price purchase warranties in a signaling model with unknown product quality and risk-neutral consumers. 34.
(44) 4.3 Basic Model Consider a one-period model involving one monopolist and a group of rational consumers, and where the marketed products have a short life and thus service life is not a consideration. These products are goods with a short life rather than durable goods. For products where service life is not a consideration, consumers can discriminate between good and bad products the moment they use them. In this basic model without warranties, product quality is known only by the firm, and is unknown to consumers before purchase. The firm sets its price according to quality, and then consumers read the price as a signal of product quality in making their purchase decisions. So, each firm producing fixed quality products will set its price to maximize profit given existing consumer demand and firm manufacturing cost. Simultaneously, rational consumers prefer high-quality products to maximize their utility. The model structure can be established based on the interaction between firms and consumers. For simplicity, the variables used here serve as indexes corresponding to interval [0, 1]. Product Quality. Following Milgram and Roberts (1986) and Shieh (1993), quality, denoted by q, is defined as the probability of a randomly selected consumer being satisfied with a product. Suppose q can only take two values, high (H) or low (L), with0 ≦ L < H ≦ 1. High-quality firms (H-type firms) will produce high-quality products (H-type products), which will satisfy the customers with a probability of H. Additionally, the probability of H-type product performing poorly and not satisfying customers is 1 - H. Meanwhile, L-type products have a probability of L of performing well and satisfying customers, and a probability of 1 - L of performing poorly. The actual qualities of the products are uncertain, and will remain unknown until the product is purcha sed. All customers prefer H to L because H-type products have a higher probability of working well. 0 ≦ q ≦ 1. 35.
(45) Price. Product price, P is an index variable on the interval [0, 1], or 0 ≦ P ≦ 1. That is, P= 1 represents the highest price set by the firm, and P= 0 represents the lowest price set by the firm. 0 ≦ P ≦ 1. Cost. Let C q denote the cost per unit at a q-type firm, which serves as an index variable corresponding to the interval [0, 1], or 0 ≦ C q ≦ 1. C q represents the degree to which a company produces low-cost products. Consumers. Following Bagwell and Riordan (1991), Al-Najjar (1995) and Shieh (1996), let r represent the monetary valuation made by a potential consumer of a working and satisfactory product. Assume that consumers have unit demand and that the consumer valuation of the product, r, serves as an index variable over the interval [0, 1], or, 0 ≦ r ≦ 1. That is, r= 1 represents the highest valuation made by consumers, and r= 0 represents the lowest valuation. A consumer knows his monetary valuation r, which follows a uniform distribution on [0, 1], before deciding whether or not to make a purchase. Hence, each consumer has a different r value. No warranty is offered and a consumer has no right to change his purchasing decision after purchase, so r is constant over the product’s service time once a consumer has bought the product. To realize their own valuation, an individual consumer will not buy if r < P, and will only buy if r > P. Consider a consumer who pays P for the product; the utility of this consumer is r - P if the product works satisfactorily, and is -P if the product breaks and is unsatisfactory. Notably, consumers who do not buy the product receive zero utility. Finally, assume the firm sets a reasonable price, that is, r > P; otherwise no consumers will be willing to buy the product owing to it being overpriced. 0 ≦ r ≦ 1. Demand. Let Ω denote the probability that q = H after the consumer has randomly purchased a product in the marketplace and has used it, and let Q(Ω) 36.
(46) denote the probability that a randomly selected consumer is satisfied with a product after he has used it. 0 ≦Ω≦ 1. Hence , Q(Ω) ≡ ΩH + (1 - Ω)L, and 0 ≦ Q(Ω) ≦ 1. A consumer with a monetary valuation of r will buy this product at price P if and only if his expected utility from buying this product is non-negative; that is,. EU = Ω〔H(r - P) + (1 - H)(-P)〕 + (1 - Ω)〔L( r- P) + (1 - L)(-P)〕 ≧ 0. Or, EU = rQ(Ω) - P ≧ 0. (4–1). (4–2). Let D(P;Ω) be the demand function with an argument P and a given Ω. D(P;Ω) serves as an index variable on the interval [0, 1], or 0 ≦ D(P;Ω) ≦ 1. That is, D(P; Ω)= 1 represents the highest quantity demanded, and D(P;Ω)= 0 represents the lowest quantity demanded. From Eq. (2), a consumer with a monetary valuation of r will buy this product if and only if rQ(Ω) - P ≧ 0. Hence r * = P/ Q(Ω) represents the minimum r for which the consumer is willing to purchase the product under an argument P and a given Ω. A larger r * corresponds to a smaller demanded quantity. Therefore , D(P;Ω ) = 1 - r * = 1 - P/ Q( Ω ). Notably, the quantity demanded is non-negative. Thus,. D(P;Ω) =Max{1- P/ Q(Ω), 0}. (4–3). Profit. Given demand, the profit of the firm is, ð q (P;Ω) = (P-C q )[1- P/ Q(Ω)]. (4–4). 37.
數據
+7
Outline
相關文件
Despite slowing down of oil prices in the international market in the second half year of 2008, the average list price of all type of fuels rose substantially over 2007, for which
We would like to point out that unlike the pure potential case considered in [RW19], here, in order to guarantee the bulk decay of ˜u, we also need the boundary decay of ∇u due to
substance) is matter that has distinct properties and a composition that does not vary from sample
Students are expected to explain the effects of change in demand and/or change in supply on equilibrium price and quantity, with the aid of diagram(s). Consumer and producer
Reading Task 6: Genre Structure and Language Features. • Now let’s look at how language features (e.g. sentence patterns) are connected to the structure
Promote project learning, mathematical modeling, and problem-based learning to strengthen the ability to integrate and apply knowledge and skills, and make. calculated
Wang, Solving pseudomonotone variational inequalities and pseudocon- vex optimization problems using the projection neural network, IEEE Transactions on Neural Networks 17
Then, it is easy to see that there are 9 problems for which the iterative numbers of the algorithm using ψ α,θ,p in the case of θ = 1 and p = 3 are less than the one of the
