556
Historical Decline in the Japanese Eel Anguilla japonica in Northern
Taiwan Inferred from Temporal Genetic Variations
Mei-Chen Tseng1, Wann-Nian Tzeng1and Sin-Che Lee2,*
1Department of Zoology, National Taiwan University, Taipei, Taiwan 10764, R.O.C. 2Institute of Zoology, Academia Sinica, Taipei, Taiwan 11529, R.O.C.
(Accepted June 27, 2003)
Mei-Chen Tseng, Wann-Nian Tzeng and Sin-Che Lee (2003) Historical decline in the Japanese eel Anguilla japonica in northern Taiwan inferred from temporal genetic variations. Zoological Studies 42(4): 556-563. The
existence of temporal genetic variations was tested for in 6 polymorphic microsatellite DNA loci of 89 Japanese eel Anguilla japonica collected from a single location in the Tanshui River Estuary, northern Taiwan during 1997-1999. The high Nei’s genetic identity coefficients (0.868-0.941) and exact test of temporal genetic structure revealed no significant differentiation (p > 0.05) among cohorts. Parameters of genetic diversity were examined including mean observed heterozygosity (Ho) (0.695-0.732) and change in the total number of alleles per year (na) (73-81). Significant deviations from Hardy-Weinberg equilibrium appeared in 5 of 6 loci, due to an insuffi-cient number of heterozygous individuals in all cohorts. Totals of 22 private and 14 solitary missing alleles were found in all 6 loci. The decrease in numbers of total alleles and private alleles and the increased number of solitary alleles in consecutive years suggested that genetic polymorphism was gradually decreasing. By Bayesian parameters assay, we found that the effective population size was declining. The demographic decline estimated to be 3500-8000 years ago, is significant due to large-scale events such as oceangeographic changes since the most recent glacial stage. http://www.sinica.edu.tw/zool/zoolstud/42.4/556.pdf
Key words: Japanese eel, Anguilla japonica, Microsatellite, Genetic diversity, Population decline.
T
he Japanese eel Anguilla japonica Temminck & Schlegel is a temperate freshwater eel, distributed in rivers of the northeastern Asian coun-tries of Taiwan, China, Japan, and Korea (Tesch 1977). As a catadromous fish, it experiences an interesting life history of spawning in the sea and growing up in rivers. Spawning grounds of this species are presumed to be in the western Mariana Islands, at a salinity front near 15°
N 140°
E, as evi-denced by the occurrence of newly hatched larvae (leptocephali) in the area (Tsukamato 1992). Leptocephalus larvae drift from their spawning grounds with the North Equatorial Current for 4-5 mo, being conveyed by the mechanism of Ekman transport (Kimura et al. 1994) and take a further 1 month to reach the coasts of Northeast Asia by the Kuroshio Current. The leptocephali metamor-phose into glass eels en route from the KuroshioCurrent to coastal waters (Cheng and Tzeng 1996). The translucent glass eels become pig-mented elvers during their upstream migration. Eels live in rivers for 5 to 8 yr until their gonads reach maturity in late autumn when they metamor-phose into silver eels and are ready to migrate downstream to the distant sea for spawning (Tzeng 1986, Tzeng et al. 2000). Silver eels have to migrate across the strong Kuroshio Current, and it takes them nearly 9 mo to reach their spawning grounds at a distance of 2000-3000 km (Tsuka-moto and Umezawa 1990).
The Japanese eel is an important fishery resource in many Asian countries. For cultivation, great numbers of elvers are caught in estuaries during the course of their upstream migration between Nov. and the following Mar. (Tzeng 1983 1985 1986) resulting in a serious problem of
over-556
*To whom correspondence and reprint requests should be addressed. Tel: 886-2-27899520. Fax: 886-2-27858059. E-mail: [email protected]
catching. In the rivers of Taiwan, Japanese eel populations have significantly decreased in the past decade (Tzeng et al. 1994, Tzeng 1996). Because of limited knowledge of the early life his-tory of natural populations, some researchers have attempted to establish a complete cultivation sys-tem to ensure a continuous supply of elvers. Although this has recently been successful, but it is still difficult to achieve mass production for com-mercial purposes. Understanding the population structure of Japanese eel is fundamental work for the effective management of this resource.
Otolith examinations and molecular markers can provide useful information when studying life cycles and population structures of this catadro-mous eel. Cheng and Tzeng (1996) determined the ages at metamorphosis and at the time of arrival at estuaries depending upon daily growth of otoliths of elvers which increases ages from south to north. The concept of a panmictic population in Japanese eel derived from mtDNA sequences in the D-loop region (Sang et al. 1994, Ishikawa et al. 2001) is contradictory to that derived by microsatellite markers (Tseng et al. 2001b). The significant genetic diversity of microsatellites among localities is similar to that in the European eel, Anguilla anguilla, for which the population genetic structure does not support the panmictic population hypothesis (Wirth and Bernatchez 2001). Both studies (Tseng et al. 2001b, Wirth and Bernatchez 2001) show clear spatial differences in the genetic structure of eels.
A further study of temporal genetic variation that examines the annual stability of the population structure is important in fishery management. Despite their great significance, studies of tempo-ral genetic diversity have often been neglected. Herein, we attempted to examine the temporal genetic stability of juvenile Japanese eels in a par-ticular estuary we sampled, using statistical analy-ses to observe whether genetic variations occurred among cohorts in 3 successive yr (1997-1999). Finally, the test of population demographics and the effective population size are further discussed.
MATERIALS AND METHODS Sampling
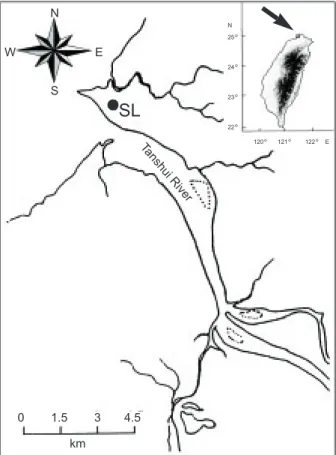
In total, 89 Anguilla japonica elvers were col-lected alive from the Tanshui River Estuary at Sha-lung (121
°
25'E, 25°
10'N) in the winters of north-ern Taiwan in 1997 to 1999 (Fig. 1). Elvers wereimmediately preserved in 95% ethanol until DNA extraction.
Genotyping
Genomic DNA was isolated and purified from muscle tissue. DNA was obtained using a stan-dard proteinase K extraction procedure as described in Kocher et al. (1989). Quantification of genetic variation was performed using 6 polymor-phic microsatellite loci including 4 (GT)n (AJMS-1, AJMS-3, AJMS-5, and AJMS-6) and 2 (GA)n (AJMS-2 and AJMS-10) loci. These microsatellite sequences registered with EMBL have the acces-sion numbers AJ297599-AJ297603 and AJ297605 (Tseng et al. 2001a).
Microsatellites were amplified via the poly-merase chain reaction (PCR) and then elec-trophoresed. Forward primers were labeled with γ-32P-ATP (Amersham, UK) and then PCR was
performed in a volume of 5 µl including 0.15 ng genomic DNA, 1.25 pmol reverse primer, 0.125 pmol labeled forward primer, 1.125 pmol unlabeled forward primer, 5 mM dNTP, 0.05-0.1 mM MgCl2,
Fig. 1. Sampling locality for Anguilla japonica, Tanshui River
Estuary at Shalung (SL) in northern Taiwan.
SL
Ta ns hu i R iver km 0 1.5 3 4.5 120°121° 122°E N 25° 24° 23° 22° N S W E0.5 µl 1% Tween 20, 10X buffer and 0.2 U Taq polymerase (Takara, Japan). Amplification was performed in a PC-960G microplate thermal cycler (Corbett Research, Australian) programed with the following schedule: initial denaturing at 95
°
C for 4 min; 38 cycles of 30 s at successive thermal regimes of 94°
C, 56-58°
C, and 72°
C. Five micro-liters of loading dye (10 mM NaOH, 95% for-mamide, 0.05% bromophenol blue, and 0.05% xylene cyanol) was added to products of each PCR, which were then denatured at 90°
C for 5 min. Eight microliters of product was then subject-ed to gel electrophoresis on an 8% denaturing polyacrylamide sequencing gel and visualized by exposing the dried gel to x-ray film overnight at room temperature. The sizes of alleles were determined by alignment with a co-migrating M13mp18 sequencing ladder (Amersham).Data analysis
All computations were performed using the POPGENE (Yang and Yeh 1993), Arlequin vers. 2.000 (Schneider et al. 2000) and Bayesian (Beaumont 1999) program packages. Allele num-ber (na), allele frequencies, effective numnum-ber of alleles (ne), and observed (Ho) and expected (He) heterozygosities were calculated independently for each locus. Multilocus estimates for each of the 3 cohorts were calculated as well. Linkage disequi-librium among all pairs of loci in overall samples was tested using Burrows, composite measure and χ2value (Ohta 1982). To detect whether there
was a significant departure from Hardy-Weinberg equilibrium (HWE), a modified version of the Markov-Chain random walk algorithm (Guo and Thompson 1992) was adopted. Tests for allelic frequency differences between cohorts were con-ducted using Fisher,s exact test (Raymond and Rousset 1995, Goudet et al. 1996). Analysis of population genetic identity (I) was carried out using Nei,s (1978) unbiased measures and cohort pair-wise FST and RST were based on the distance method (Weir and Cockerham 1984, Tamura and Nei 1993, Raymond and Rousset 1995). Bayesian demographic parameters of a sample were esti-mated using Markov chain Monte Carlo (MCMC) simulations based on microsatellite data (Beaumont 1999). The main demographic para-meters were quantified: (i) θ, which is defined as 2
N0Mu, where N0is the current effective number of
chromosomes and Mu was calculated based on a mutation rate of 5 x 10⁻⁴ per generation (Angers
and Bernatchez 1998 ); (ii) tf, equals to ta/N0 ,
where ta denotes the number of generations that have elapsed since the decline or expansion began; and (iii) r, equals N0/N1, where N1 is the number of chromosome at same previous point at time tf . These analyses supplied all exponential results which were performed using multilocus data in the present report.
RESULTS
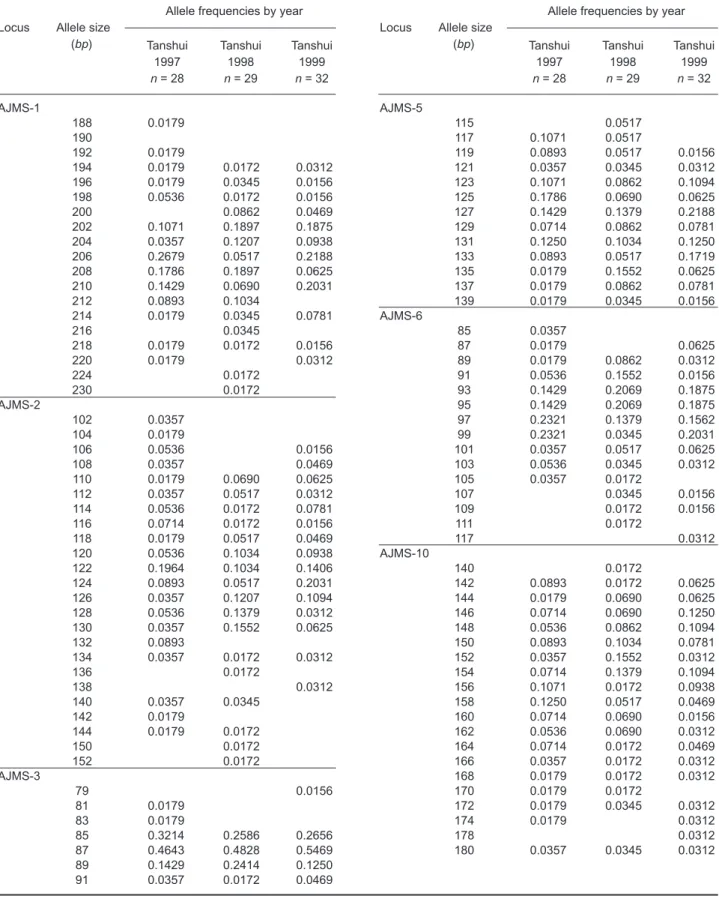
In total, 108 alleles were scored from 6 microsatellite loci including 19 at AJMS-1, 24 at 2, 7 at 3, 13 at 5, 15 at AJMS-6 and 20 at AJMS-10. Temporal variation in allelic frequencies over the 3 yr (1997-1999) were observed at all loci analyzed (Table 1). Although totals of 22 private and 14 solitary missing alleles were found in all 6 loci, most of them were com-monly shared by all 3 cohorts. High polymorphism resulted from the absence of identical genotypes among all temporal cohorts. Pairwise compar-isons of allele diversity among cohorts revealed a decrease in the number of total alleles and mean number of effective alleles per locus in recent years. Consequently, the number of private alleles was found to have decreased with increasing num-bers of solitary missing alleles indicated in the past 3 successive years.
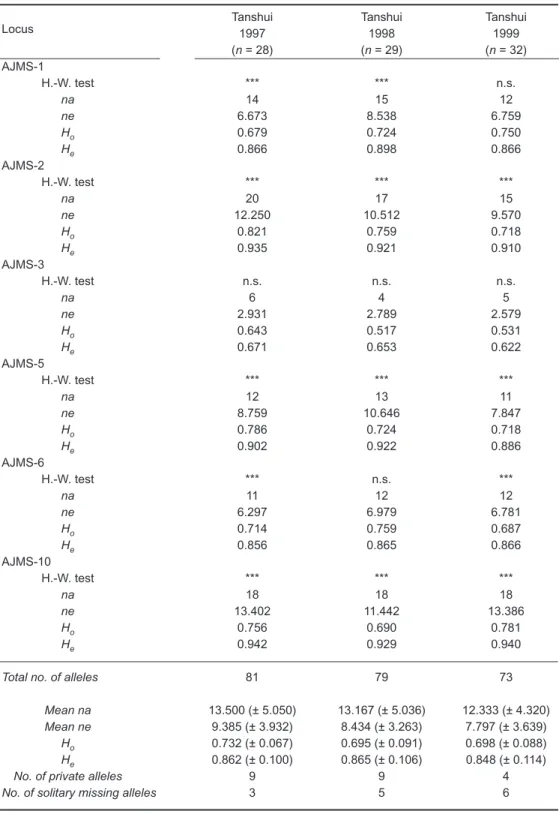
Observed heterozygosities (Ho) ranged from 51.7%-64.3% at locus AJMS-3 to 71.8%-82.1% at locus AJMS-2 (Table 2). Expected heterozygosi-ties (He) ranged from 62.2%-67.1% at locus AJMS-3 to 92.9%-94.2% at locus AJMS-10. Within the 18 probability tests, a significant departure from Hardy-Weinberg equilibrium was occurred at loci AJMS-2, AJMS-5, and AJMS-10 in the 3 cohorts, due to an insufficiency of heterozygous individuals sampled. Few or no significant deviations were observed at the loci 1, 3, and AJMS-6. As a result, we were able to reject the null hypothesis of random mating in samples of Japanese eel. Both observed and expected mean heterozygosities showed slight temporal fluctuation during 1997 and 1999, with Horanging from 0.695 (± 0.091) to 0.732 (± 0.067), and Hefrom 0.848 (± 0.114) to 0.865 (± 0.106).
Burrows, composite measure for linkage dis-equilibrium (LD) among the 6 loci for all samples revealed slight disequilibrium for the entire data set. The total variance of allelic disequilibrium at interlocus was estimated to be DIT2= 0.0125.
The loci AJMS-2 and AJMS-10 had higher effective numbers of alleles (ne) (13.04 and 14.93,
Table 1. Allelic sizes and frequencies on locus basis observed from elvers sampled from the Tanshui Estuary during 1997-1999 AJMS-1 188 0.0179 190 192 0.0179 194 0.0179 0.0172 0.0312 196 0.0179 0.0345 0.0156 198 0.0536 0.0172 0.0156 200 0.0862 0.0469 202 0.1071 0.1897 0.1875 204 0.0357 0.1207 0.0938 206 0.2679 0.0517 0.2188 208 0.1786 0.1897 0.0625 210 0.1429 0.0690 0.2031 212 0.0893 0.1034 214 0.0179 0.0345 0.0781 216 0.0345 218 0.0179 0.0172 0.0156 220 0.0179 0.0312 224 0.0172 230 0.0172 AJMS-2 102 0.0357 104 0.0179 106 0.0536 0.0156 108 0.0357 0.0469 110 0.0179 0.0690 0.0625 112 0.0357 0.0517 0.0312 114 0.0536 0.0172 0.0781 116 0.0714 0.0172 0.0156 118 0.0179 0.0517 0.0469 120 0.0536 0.1034 0.0938 122 0.1964 0.1034 0.1406 124 0.0893 0.0517 0.2031 126 0.0357 0.1207 0.1094 128 0.0536 0.1379 0.0312 130 0.0357 0.1552 0.0625 132 0.0893 134 0.0357 0.0172 0.0312 136 0.0172 138 0.0312 140 0.0357 0.0345 142 0.0179 144 0.0179 0.0172 150 0.0172 152 0.0172 AJMS-3 79 0.0156 81 0.0179 83 0.0179 85 0.3214 0.2586 0.2656 87 0.4643 0.4828 0.5469 89 0.1429 0.2414 0.1250 91 0.0357 0.0172 0.0469
Allele frequencies by year Locus Allele size
(bp) Tanshui Tanshui Tanshui
1997 1998 1999 n = 28 n = 29 n = 32 AJMS-5 115 0.0517 117 0.1071 0.0517 119 0.0893 0.0517 0.0156 121 0.0357 0.0345 0.0312 123 0.1071 0.0862 0.1094 125 0.1786 0.0690 0.0625 127 0.1429 0.1379 0.2188 129 0.0714 0.0862 0.0781 131 0.1250 0.1034 0.1250 133 0.0893 0.0517 0.1719 135 0.0179 0.1552 0.0625 137 0.0179 0.0862 0.0781 139 0.0179 0.0345 0.0156 AJMS-6 85 0.0357 87 0.0179 0.0625 89 0.0179 0.0862 0.0312 91 0.0536 0.1552 0.0156 93 0.1429 0.2069 0.1875 95 0.1429 0.2069 0.1875 97 0.2321 0.1379 0.1562 99 0.2321 0.0345 0.2031 101 0.0357 0.0517 0.0625 103 0.0536 0.0345 0.0312 105 0.0357 0.0172 107 0.0345 0.0156 109 0.0172 0.0156 111 0.0172 117 0.0312 AJMS-10 140 0.0172 142 0.0893 0.0172 0.0625 144 0.0179 0.0690 0.0625 146 0.0714 0.0690 0.1250 148 0.0536 0.0862 0.1094 150 0.0893 0.1034 0.0781 152 0.0357 0.1552 0.0312 154 0.0714 0.1379 0.1094 156 0.1071 0.0172 0.0938 158 0.1250 0.0517 0.0469 160 0.0714 0.0690 0.0156 162 0.0536 0.0690 0.0312 164 0.0714 0.0172 0.0469 166 0.0357 0.0172 0.0312 168 0.0179 0.0172 0.0312 170 0.0179 0.0172 172 0.0179 0.0345 0.0312 174 0.0179 0.0312 178 0.0312 180 0.0357 0.0345 0.0312
Allele frequencies by year Locus Allele size
(bp) Tanshui Tanshui Tanshui
1997 1998 1999
Table 2. Levels of genetic variation observed at 6 microsatellite loci within 3
Japanese eel samples: sample size (n); effective number of alleles (ne) and observed number of alleles (na) at each locus, observed (Ho) and expected (He) heterozygosities within samples, number of private alleles in each sample, and number of solitary missing alleles in each sample
Tanshui Tanshui Tanshui
1997 1998 1999 Locus (n = 28) (n = 29) (n = 32) AJMS-1 H.-W. test *** *** n.s. na 14 15 12 ne 6.673 8.538 6.759 Ho 0.679 0.724 0.750 He 0.866 0.898 0.866 AJMS-2 H.-W. test *** *** *** na 20 17 15 ne 12.250 10.512 9.570 Ho 0.821 0.759 0.718 He 0.935 0.921 0.910 AJMS-3 H.-W. test n.s. n.s. n.s. na 6 4 5 ne 2.931 2.789 2.579 Ho 0.643 0.517 0.531 He 0.671 0.653 0.622 AJMS-5 H.-W. test *** *** *** na 12 13 11 ne 8.759 10.646 7.847 Ho 0.786 0.724 0.718 He 0.902 0.922 0.886 AJMS-6 H.-W. test *** n.s. *** na 11 12 12 ne 6.297 6.979 6.781 Ho 0.714 0.759 0.687 He 0.856 0.865 0.866 AJMS-10 H.-W. test *** *** *** na 18 18 18 ne 13.402 11.442 13.386 Ho 0.756 0.690 0.781 He 0.942 0.929 0.940
Total no. of alleles 81 79 73
Mean na 13.500 (± 5.050) 13.167 (± 5.036) 12.333 (± 4.320)
Mean ne 9.385 (± 3.932) 8.434 (± 3.263) 7.797 (± 3.639)
Ho 0.732 (± 0.067) 0.695 (± 0.091) 0.698 (± 0.088)
He 0.862 (± 0.100) 0.865 (± 0.106) 0.848 (± 0.114)
No. of private alleles 9 9 4
No. of solitary missing alleles 3 5 6
H.-W.: Hardy-Weinberg.
respectively) and the greatest total number of alle-les (24 and 20, respectively) compared to other loci. They were the main critical loci that influenced the temporal genetic diversity of the Japanese eel. Exact tests of global genetic differentiation among samples were examined using 10 000 steps in a Markov chain. However, it showed no any signifi-cant temporal genetic differentiation (p > 0.05). The stability of the genetic composition among these samples was reflected in low FST and RST estimates and high genetic identity. Values of pop-ulation genetic identity (I), pairwise FST and RST were I = 0.868, FST = 0.002, and RST = 0.011 between 1997 and 1998; I = 0.941, FST = 0.013, and RST= 0.017 between 1997 and 1999; and I = 0.893, FST= 0.013, and RST= 0.022 between 1998 and 1999.
In order to detect population declines and expansions, we followed the procedure of Beaumont (1999). The estimated Bayesian para-meters are scaled in terms of current population size and main demographic parameters. The numbers of mutations per locus ranged from 134.64 (AJMS-3) to 939.14 (AJMS-2) with an aver-age of 671.60. The current effective population size (N0), which ranged 4127-6057 individuals, was estimated according to the log (θ) values (range, 0.615-0.782; mean, 0.704). The obtained log (r) value of -2.05 was an exponential transfor-mation of N0/N1, which indicates a declining popu-lation. The r value is a measure of change in the population size, i.e., r < 1 for a declining popula-tion, r = 1 for a stable populapopula-tion, and r > 1 for an expanding population. These results clearly indi-cate a significant decrease in the effective popula-tion size (r < 1). Judging from the log (tf) value (-0.775) and sexual maturity at an age of 5-8 yr (Tzeng 1986), the onset of demographic decline was estimated to have begun 693-1018 genera-tions (ta) ago, which corresponds roughly to 3500-8000 calendar years.
DISCUSSION
Although there were high genetic identity and negligible genetic differentiation detected among samples (exact test, p > 0.05) collected during 1997 to 1999, there were some private alleles and fewer solitary missing alleles which existed in these 3 cohorts. The private alleles may be deduced from new genealogical mutations, slipped strand mispairing during DNA duplication, or cross-over during DNA recombination (Goldstein and
Schlötterer 1999). Solitary missing alleles occur-ring within different cohorts is a result of genotype change, loss or sampling error. All cohorts con-taining deficiencies of observed heterozygosity (Ho) may be caused by inbreeding, the Wahlund effect, and null alleles.
Although the observed heterozygosity (Ho) almost did not change, the number of total alleles did decrease or otherwise the number of solitary missing alleles increased during 1997 to 1999, suggesting a steady decrease in genetic diversity. Aside from the influence of climate change on oceanic currents, other factors possibly responsi-ble for the fluctuation in genetic diversity may in-clude over-fishing of elvers and destruction of adult eel habitat. These may result in a decreasing effective population size and drop in eel catches.
A wider range of spatial genetic variability than temporal genetic variability when expressed in observed heterozygosity (Ho) (0.565-0.728 v.s. 0.695-0.732), and the estimation in the present study are similar to those for Nei,s genetic dis-tance (0.126-0.175 v.s. 0.060-0.142)(Tseng et al. 2001b). Significant genetic differentiation is indi-cated among geographic populations (FST= 0.031,
p < 0.01); however, there was no temporal genetic
subdivision among the 3 cohorts. The population structure of Japanese eel elvers appearing in northern Taiwan remained temporally constant dur-ing 1997 to 1999.
Temporal stability in the same geographic region between progenies and ancestors is due to their inherited migration behavior. Silver eels from different localities mate when attaining maturity in their spawning grounds at different times (Chan et al. 1997). Once the hatched leptocephali drift toward the continental shelf, they then metamor-phose into glass eels with further growth as elvers while entering estuaries. The high genetic identity and stable temporal genetic structure of the Japanese eel may be explained by member-vagrant migration model (Iles and Sinclair 1982, Fortier and Gangé 1990), i.e., most progeny tend to reside in a similar locality as did their ancestors.
Major decisions concerning the management of Japanese eel populations require information on such parameters as effective population size and temporal demographic changes which are still largely unknown. Following the procedure of Bayesian (Beaumont 1999) to quantify genetic data and to detect declines or expansions in Japanese eel populations, the effective population size (No= 4127-6057) observed for the Japanese eel is close to that of the European eel (No=
4410-5388), but lower than that of American eel (No = 9236) (Wirth and Bernatchez 2003). The low value of the Bayesian parameter, r, observed in the Japanese eel clearly indicates a significant decline in its effective population size. Similar results were found in both the European and the American eels (Wirth and Bernatchez 2003). Such dramatic declines might be caused by large-scale events such as oceanographic changes. Assum-ing 5-8 yr for 1 generation time over 850 genera-tions (ta), the onset of population decline in the Japanese eel largely coincides with the early to middle Holocene (6 to 9 ka) during a time when the climate was warming (Thompson et al. 1997). Changes in oceanic circulation via climatic change may have affected the reproductive success ocur-ring in the far sea spawning grounds (Tzeng 1996, Wirth and Bernatchez 2003). This emphasizes that the demographic of the Japanese eel have been adversely affected since the last glacial stage.
However, it is appropriate to draw the conclu-sion from this study, that temporal genetic diversity in a single population of A. japonica is less signifi-cant than that among geographically discrete sam-ples (Tseng et al. 2001b). These results confirm that the temporal genetic identity is an indication of population stability for the Japanese eel observed during 1997 to 1999. The gradually decreasing in allelic diversity appears to be correlated to over-fishing of elvers, to destruction of adult eels habi-tats, and partially to long-term climatic fluctuations since the last glaciation (Tzeng 1996, Wang et al. 2001, Hauser et al. 2002). For conservation mea-sures of eel resources, it is very important to cen-sus populations in consecutive years to ensure a high quality of environmental conditions favorable for the life of eels.
Acknowledgments: We are grateful to Ms. H. Y.
Teng, Dr. C. W. Chang and Dr. Y. T. Wang for col-lecting specimens from the Tanshui River in north-ern Taiwan. We are indebted to Dr. C. A. Chen for reading the manuscript and 2 anonymous review-ers for valuable advice.
REFERENCES
Angers B, L Bernatchez. 1998. Combined used of SMM and non-SMM methods to infer fine structure and evolutionary history of closely related brook charr (Salvelinus fontinalis, Salmonidae) populations from microsatellites. Mol. Biol. Evol. 15: 143-159.
Beaumont MA. 1999. Detecting population expansion and
decline using microsatellites. Genetics 153: 2013-2029. Chan IKK, DKO Chan, SC Lee, K Tsukamoto. 1997. Genetic
variability of the Japanese eel Anguilla japonica (Temminck & Schlegel) related to latitude. Ecol. Freshw. Fish 6: 45-49.
Cheng PW, WN Tzeng. 1996. Timing of metamorphosis and estuarine arrival across the dispersal range of the Japanese eel Anguilla japonica. Mar. Ecol. Prog. Ser.
131: 87-96.
Fortier L, JA Gagné. 1990. Larval herring (Clupea harengus) dispersion, growth, and survival in the St. Lawrence Estuary: match/mismatch or membership/vagrant. Can. J. Fish. Aquat. Sci. 47: 1898-1912.
Goldstein DB, C Schlötterer. 1999. Mechanistic basis for microsatellite instability. In Microsatellites: evolution and applications. Oxford, UK: Oxford University Press, pp. 34-48.
Goudet J, M Raymond, T De Meeus, F Rousset. 1996. Testing differentiation in diploid populations. Genetics 144: 1933-1940.
Guo SW, EA Thompson. 1992. Performing the exact test of Hardy-Weinberg proportions for multiple alleles. Biomet-rics 48: 361-362.
Hauser L, GJ Adcock, PJ Smith, JHB Ramirez, GR Carvalho. 2002. Loss of microsatellite diversity and low effective population size in an overexploited population of New Zealand snapper (Pagrus auratus). Proc. Natl. Acad. Sci. USA 99: 11742-11747.
Iles TD, M Sinclair. 1982. Atlantic herring: stock discreteness and abundance. Science 215: 627-633.
Ishikawa S, J Aoyama, K Tsukamoto, M Nishida. 2001. Population structure of the Japanese eel Anguilla japonica as examined by mitochondrial DNA sequencing. Fisheries Sci. 67: 246-253.
Kimura S, K Tsukamoto, T Sugimoto. 1994. A model for the larval migration of the Japanese eel: roles of the trade winds and salinity front. Mar. Biol. 119: 185-190.
Kocher TD, WK Thomas, A Meyer, SV Edwards, S Pabo, FX Villablabca, AC Wilson. 1989. Dynamics of mitochondrial DNA evolution in animals: amplification and sequencing with conserved primers. Proc. Natl. Acad. Sci. USA 86: 6196-6200.
Nei M. 1978. Estimation of average heterozygosity and genetic distance from a small number of individuals. Genetics 89: 583-590.
Ohta T. 1982. Linkage disequilibrium due to random drift in infi-nite subdivided populations. Proc. Natl. Acad. Sci. USA
79: 1940-1944.
Raymond M, F Rousset. 1995. An exact test for population dif-ferentiation. Evolution 49: 1280-1283.
Sang TK, HY Chang, CT Chen, CF Hui. 1994. Population structure of the Japanese eel Anguilla japonica. Mol. Biol. Evol. 11: 250-260.
Schneider S, D Roessli, L Excoffier. 2000. Arlequin: a software for population genetics data analysis. Vers 2.000. Geneva, Switzerland: Genetics and Biometry Lab, Department of Anthropology, Univ. of Geneva.
Tamura K, M Nei. 1993. Estimation of the number of nucleotide substitutions in the control region of mitochondrial DNA in humans and chimpanzees. Mol. Biol. Evol. 10: 512-526. Tesch FW. 1977. The eel: biology and management of
Anguillid eels. London: Chapman and Hall.
Thompson LG, T Yao, ME Davis, KA Henderson, E Mosley-Thompson, PN Lin, J Beer, HA Synal, J Cole-Dai, JF Bolzan. 1997. Tropical climate instability: the last glacial
cycle from a Qinghai-Tibetan ice core. Science 276: 1821-1825.
Tseng MC, CA Chen, HW Kao, WN Tzeng, SC Lee. 2001a. Polymorphisms of GA/GT microsatellite loci from Anguilla
japonica. Mar. Biotechnol. 3: 275-280.
Tseng MC, SC Lee, WN Tzeng. 2001b. Genetic variation of the Japanese eel Anguilla japonica based on microsatellite DNA. J. Taiwan Fish. Res. 9: 137- 147.
Tsukamoto K. 1992. Discovery of the spawning area for Japanese eel. Nature 356: 789-791.
Tsukamoto K, A Umezawa. 1990. Early life history and oceanic migration of the eel Anguilla japonica. La Mer 28: 188-198.
Tzeng WN. 1983. Seasonal and long-term changes of the catch of anguillid elvers in Taiwan. J. Fish. Soc. Taiwan
10: 1-7.
Tzeng WN. 1985. Immigration timing and activity rhythms of the eel, Anguilla japonica, elvers in the estuary of northern Taiwan with emphasis on environmental influences. Bull. Jpn. Soc. Fish. Oceanogr. 47: 11-28.
Tzeng WN. 1986. Resources and ecology of the Japanese eel
Anguilla japonica elvers in the coastal waters of Taiwan.
China Fish. Month. 404: 19-24. (in Chinese)
Tzeng WN. 1994. Temperature effects on the incorporation of strontium in otoliths of Japanese eel, Anguilla japonica Temminck and Schlegel. J. Fish Biol. 45: 1055-1066. Tzeng WN. 1996. Short- and long-term fluctuations in catches
of elvers of the Japanese eel, Anguilla japonica, in Taiwan. In Proceedings of 2nd World Fisheries Congress, 28 July to 2 Aug. 1996, Brisbane, Australia, pp. 85-89. Tzeng WN, HR Lin, CH Wang, SN Xu. 2000. Differences in
size and growth rates of male and female migrating Japanese eels in the Pearl River, China. J. Fish Biol. 57: 1245-1253.
Wang J, YQ Su, CG Quan, SX Ding, W Zhang. 2001. The genetic diversity of the wild and reared Pseudosciaena
crocea. Chin. J. Oceanol. Limnol. 19: 152-156.
Weir BS, CC Cockerham 1984. Estimating F-statistics for the analysis of population structure. Evolution 38: 1358-1370.
Wirth T, L Bernatchez. 2001. Genetic evidence against pan-mixia in the European eel. Nature 409: 1037-1040. Wirth T, L Bernatchez. 2003. Decline of North Atlantic eels: a
fatal synergy. Proc. Roy. Soc. Lond. B. (in press) Yang RC, FC Yeh. 1993. Multilocus structure in Pinus contoria