Strut-and-Tie Design Methodology for Three-Dimensional
Reinforced Concrete Structures
Liang-Jenq Leu
1; Chang-Wei Huang
2; Chuin-Shan Chen, M.ASCE
3; and Ying-Po Liao
4Abstract: A tie design methodology is presented for three-dimensional reinforced concrete structures. The unknown strut-and-tie model is realized through the machinery of a refined evolutionary structural optimization method. Stiffness of struts and strut-and-ties is computed from an evolved topology of a finite element model to solve statically indeterminate strut-and-tie problems. In addition, compressive strength for struts and nodal zones is evaluated using Ottosen’s four-parameter strength criterion. Numerical examples are studied to demonstrate that the proposed design methodology is suitable for developing and analyzing three-dimensional strut-and-tie models for reinforced concrete structures.
DOI: 10.1061/共ASCE兲0733-9445共2006兲132:6共929兲
CE Database subject headings: Concrete, reinforced; Design; Finite elements; Optimization; Three-dimensional analysis; Struts; Trusses; Ties.
Introduction
In designing reinforced concrete structures, it is common practice to classify portions of structures as either B or D regions. Most design practices for B regions are well developed. On the other hand, design for D regions, such as deep beams, corbels, joints, and pile caps, is mostly based on heuristic methods and past ex-perience共Hsu 1993; MacGregor 1997兲.
One approach to replace ad hoc D-region design practices is the strut-and-tie method共Schlaich et al. 1987兲. In this method, the complex flow of internal forces in D regions is transformed to a truss-like structure carrying the imposed loading to adjacent B regions or to its supports. A strut-and-tie model consists of struts, ties, and nodes. Struts are compression members which represent resultants of parallel or fan-shaped compressive stress fields. Ties are tension members which mostly represent reinforcing steels, but can occasionally represent prestressing tendons or tensile stress fields. Nodes are the locations where the axes of the struts, ties, and concentrated forces intersect. Nodal zones are thus sub-ject to a multidirectional stress state. The strut-and-tie method offers numerous advantages 共ASCE-ACI 1998兲 and has been adopted in design code provisions recently共FIP 1996; ACI 2002兲.
Although the strut-and-tie method is conceptually simple, its realization for complex D regions is not straightforward. The major complexity involves how to transform a continuous de-scription of a structural region to a discrete strut-and-tie model 共Liang et al. 2002兲. Additional complexities include how to ac-count for stiffness of struts and ties and how to evaluate concrete effective strength共Yun 2000; Tjhin and Kuchma 2002兲. For the strut-and-tie method to be reliably adopted in design practice, it is imperative to manage these complexities in a unified and consis-tent manner.
The advances in the field of structural topology optimization open up new ways of resolving the implementation complexities of the strut-and-tie method共Liang et al. 2000, Liang et al. 2002; Ali and White 2001; Biondini et al. 2001兲. However, these studies are mainly focused on two-dimensional structures. Thus, the main objective of this study is to develop a strut-and-tie design meth-odology for three-dimensional reinforced concrete structures. In the following, the deficiencies of the conventional strut-and-tie design methodology are addressed, in particular for tackling three-dimensional problems. A design methodology aimed to re-solve these deficiencies is then delineated. In the proposed meth-odology, an appropriate strut-and-tie model is generated from structural topology optimization. Member forces of a statically indeterminate strut-and-tie model are calculated based on the evolved topology. The bearing capacity of strut-and-tie models is predicted by a concrete failure criterion. Finally, two numerical examples are studied to demonstrate the applicability of this pro-posed design methodology.
Challenges of Conventional Strut-and-Tie Design Methodology
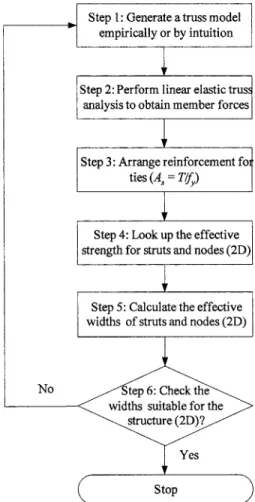
The standard procedure of the conventional strut-and-tie design methodology can be found in design code provisions共ACI 2002兲; a conceptual flowchart is depicted in Fig. 1 for later comparison in this study. Generally speaking, this procedure is a trial-and-error iterative design process based mainly on designers’ intuition and experience.
1
Professor, Dept. of Civil Engineering, National Taiwan Univ., Taipei 10617, Taiwan共corresponding author兲. E-mail: [email protected]
2
Assistant Professor, Dept. of Industrial Engineering and Management, St. John’s Univ., Taipei 25135, Taiwan. E-mail: cwhuang@ mail.sju.edu.tw
3
Associate Professor, Dept. of Civil Engineering, National Taiwan Univ., Taipei 10617, Taiwan. E-mail: [email protected]
4
Research Associate, Dept. of Civil Engineering, National Taiwan Univ., Taipei 10617, Taiwan. E-mail: [email protected]
Note. Associate Editor: Elisa D. Sotelino. Discussion open until November 1, 2006. Separate discussions must be submitted for individual papers. To extend the closing date by one month, a written request must be filed with the ASCE Managing Editor. The manuscript for this paper was submitted for review and possible publication on September 5, 2003; approved on June 3, 2005. This paper is part of the Journal of Structural Engineering, Vol. 132, No. 6, June 1, 2006. ©ASCE, ISSN 0733-9445/ 2006/6-929–938/$25.00.
The conventional design methodology faces at least three major challenges in design practices. The first challenge is that it is not easy to generate an appropriate strut-and-tie model for a structure, especially a three-dimensional one. In the literature, most strut-and-tie models are developed by utilizing stress trajec-tories from finite element analysis共Schlaich et al. l987; Schlaich and Schäfer 1991兲. Directions of struts and ties are taken in ac-cordance with those directions of principal compressive and ten-sile stresses, respectively. This strategy, however, suffers from two drawbacks. First, for a region with complex stress distribu-tion, it is not a simple task to generate a corresponding strut-and-tie model by inspection. Second, for a three-dimensional region, it is very difficult for designers to visualize the stress trajectories in the interior. Recently, structural topology optimization methods have been employed to generate strut-and-tie models automati-cally for two-dimensional reinforced concrete structures. For ex-ample, Ali and White 共2001兲 and Biondini 共2001兲 used a linear programming method to find an optimum strut-and-tie model. A concrete structure was replaced by a ground structure consisting of many truss members. However, the discrete ground discretiza-tion may not be adequate to model the continuous structure. Con-sequently, the resulting strut-and-tie model may not faithfully represent the structure共Liang et al. 2000兲.
The second challenge faced by the conventional design meth-odology is the issue concerned with stiffness determination of each member in a statically indeterminate strut-and-tie model. One way to handle the statically indeterminate case is to employ the so-called plastic truss method. However, care must be taken because of strain compatibility requirements and limited ductility
in concrete 共Tjhin and Kuchma 2002兲. Schlaich and Schäfer 共1991兲 suggested that a statically indeterminate strut-and-tie model could be decomposed into several statically determinate ones. Each statically determinate truss model was then respon-sible for sustaining an equal portion of external loading. How-ever, it is not clear whether or not a statically indeterminate truss model can always be decomposed. In addition, the assumption that each statically determinate truss model takes the same exter-nal loading may not be reasonable 共Ali 1997兲. Recently, Yun 共2000兲 proposed an iterative approach to determine the relative stiffness of statically indeterminate strut-and-tie members. How-ever, its convergence property may not be assured.
The third challenge faced by the conventional design method-ology is related to the issue of indirectly evaluating concrete bear-ing capacity. The effective compressive strengths of the struts and nodes are first obtained by looking up codes and guidelines 共e.g., Schlaich et al. 1987; FIP 1996; MacGregor 1997; ACI 2002兲. The effective width of the strut is then computed from dividing the member force by the effective strength. The shapes and dimensions of the nodes are determined after the widths of incoming struts are resolved. Finally, the truss model with finite widths is evaluated to determine its suitability for the structure. If the widths of struts are not suitable, the selected strut-and-tie model has to be modified. For two dimensions, values for effec-tive compressive strengths of struts and nodal zones are specified in codes and guidelines. However, for three-dimensional strut-and-tie models, no proven guidelines are yet available.
Proposed Strut-and-Tie Design Methodology
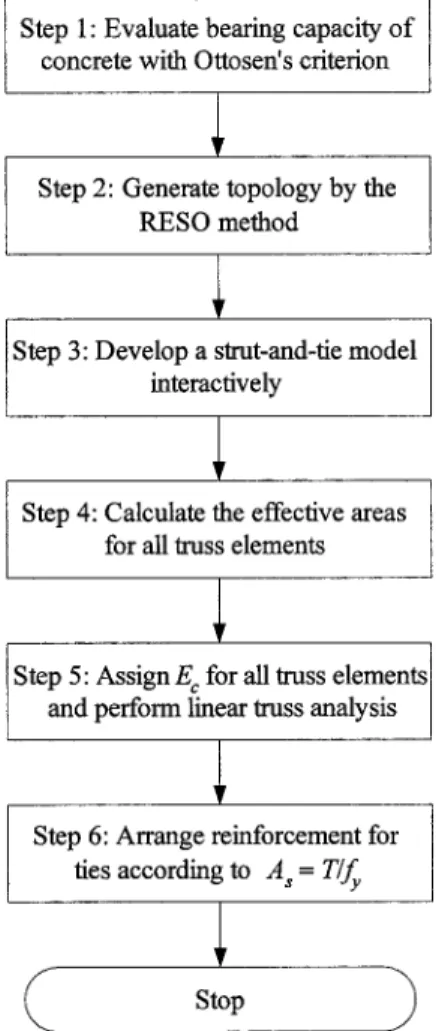
In this study, a strut-and-tie design methodology is proposed to overcome the above-mentioned difficulties. The development is centered upon the concept of transforming the design to a topol-ogy optimization problem of a continuum structure共Liang et al. 2002兲. In addition, the proposed methodology utilizes information passing from a continuum to determine effective stiffness and strength properties needed in a strut-and-tie model. Doing so thus allows us to reduce the ambiguous features encountered by the conventional method.
Refined Evolutionary Structural Optimization Method To generate a three-dimensional strut-and-tie model for a struc-ture, the concept of topology optimization is employed herein. Several methods have been proposed in the literature to solve the topology optimization problem. Among them, the evolutionary structural optimization 共ESO兲 method 共Xie and Steven 1993兲 is one of the most popular methods. The ESO method is widely reported and currently received intensive attention. One reason is that the method is conceptually simple but the obtained results are quite accurate compared with other methods. The other reason is that it is easy to implement the ESO method in conjunction with the finite element method.
Despite its popularity, the ESO method proposed by Xie and Steven suffered some weaknesses 共Zhao et al. 1998兲. In this paper, the ESO is improved to find the optimal topology for a three-dimensional continuum, from which the strut-and-tie model can be derived. To distinguish the original ESO method from the refined ESO method, the latter is denoted as the refined ESO 共RESO兲 method in this study. A brief introduction to the RESO method is presented herein; details can be found in Huang共2003兲. Fig. 1. Flowchart of conventional strut-and-tie design methodology
The RESO method starts from a design domain constructed by a finite element model with given loading and support conditions. Through gradually removing ineffective materials, one can obtain new topologies of the structure that are more effective than the initial one. The material efficiency is determined from the strain energy density of each element. Elements are deleted when their strain energy densities are less than a rejection ratio 共RR兲 times the average strain energy density of the structure共wave兲. The
con-dition can be expressed as
if wi⬍ RR ⫻ wave then the ith element is deleted 共1兲
where wi= strain energy density of the ith element defined as
wi=
1 2Vi
兵ui其T关ki兴兵ui其 共2兲
in which兵ui其=displacement vector; 关ki兴=element stiffness matrix;
and Vi=volume of the ith element, respectively.
The finite element analysis and element elimination cycle are repeated using the same RR until a steady state is reached; this state represents null element deletion according to Eq. 共1兲. At this state, an evolution rate 共ER兲 is introduced and added to 共RR兲
RR = RR + ER 共3兲
in which ER is used as an increment of RR so that the elimination criterion of elements is increased to the next level. It is worth noting that the evolutionary process works properly only when the number of elements removed at each evolution is small 共Hin-ton and Sienz 1995兲. If a large number of elements are removed in a typical design evolution, it may result in missing the opti-mum topology in the evolutionary process. To avoid this problem, a maximum percentage of elements that can be removed in each design evolution are prescribed. In this study, 1% of the elements in the initial design domain are allowed to be removed in each evolution. If the number of removed elements in each evolution exceeds this maximum number, the current RR will be reduced until the number of removed elements is smaller than the maxi-mum threshold.
The evolutionary process continues until a defined stop crite-rion is reached. There are several ways to define the stop critecrite-rion in the literature共Xie and Steven 1993兲. In this study, the perfor-mance index共PI兲 proposed by Liang and Steven 共2002兲 and Liang et al.共2002兲 is adopted to monitor whether the optimal topology is reached. The index provides a measure of efficiency for differ-ent design evolutions. A higher value of PI means a more efficidiffer-ent topology for the structure.
The performance index, in terms of the total strain energies and volumes at the initial and ith design evolutions, can be defined as
PI =W
0V0
WiVi 共4兲
where the superscripts 0 and i represent the initial and ith design evolutions, respectively. In addition, W and V denote the total strain energy and volume of the structure, respectively. The per-formance index increases from unity to a maximum value when the inefficient elements are removed gradually. However, further element removal from the “optimal” topology structure that has the highest value of the index will lead to decrease of the stiffness of the structure. It then results in decreasing values of the performance index.
Sometimes, it is found that elements with restraints may be removed without losing structural stability during the evolution-ary process. However, removal of restraints leads to change of design boundary conditions in the strut-and-tie design method. Therefore, once any element with restraints is removed in a typi-cal design evolution, the evolutionary process is also stopped.
The proposed RESO procedures can be summarized as follows.
1. Assign initial values: RR= 1%; ER= 1%;
2. Discretize the design domain with a finite element mesh; 3. Perform linear elastic analysis for given loads and boundary
conditions;
4. Calculate strain energy density values of all elements and performance index of the structure;
5. Smooth element strain energy density values to avoid the checkerboard pattern共Li et al. 2001兲 and calculate the aver-age strain energy density;
6. Remove inefficient elements with lower strain energy density values according to Eq.共1兲 with the constraint that the num-ber of removed elements in each evolution shall be less than 1% of the number of elements of the initial structure. Other-wise, a smaller value for RR shall be used; and
7. Repeat steps 3–6 until a stop criterion is reached. Table 1. Values for Ottosen’s Four-Parameter Concrete Failure Criterion
ft/ fc⬘ a b k1 k2
0.08 1.8076 4.0962 14.4863 0.9914
0.10 1.2759 3.1962 11.7365 0.9801
0.12 0.9218 2.5969 9.9110 0.9647
Fig. 2. Illustration of region 共enclosed by dashed lines兲 for
two-dimensional truss element with cutoff distance r Fig. 3. Illustration of second deviatoric stress invariant of applied
In summary, the main differences between the RESO and ESO methods are the removing algorithm in each evolutionary itera-tion, the smooth process to prevent checkerboard patterns, and the stop criterion by the performance index. Three remarks regarding the practical implementation of the RESO method are listed in order. First, removed elements are ignored in assembling the glo-bal stiffness matrix in the RESO method. This technique has the advantage in solving the equilibrium equations of finite element analysis because the number of degrees of freedom becomes less and less during the evolutionary process. Second, the removal
of elements may result in the case where one or more remained elements do not have sufficient connectivities with other ele-ments. For instance, if a quadrilateral element is connected to the other elements by only one node, the structural stiffness ma-trix will become singular. In this case, this element shall be re-moved in order to have a nonsingular stiffness matrix. Finally, two stop criteria are adopted in the RESO method. The evolution-ary process is stopped when the performance index has reached its maximum or elements with restraint are removed during the process.
Statically Indeterminate Strut-And-Tie Model Analysis To compute relative stiffness of truss members, a simple stiffness finding algorithm is developed. It is necessary because after an appropriate strut-and-tie model is selected, member forces of the model need to be determined. For statically determinate strut-and-tie models, member forces can be obtained from equilibrium equations. However, for statically indeterminate strut-and-tie models, equilibrium equations and relative stiffness of members are needed to compute member forces. The truss-like evolution-ary topology offers a good estimate for the relative stiffness of truss members. Each truss member within its reach should com-prise some number of remaining finite elements. These finite el-ements are naturally potential candidates to contribute stiffness for the truss member.
Our stiffness finding algorithm can thus be established as fol-lows. First, a cutoff distance r is chosen to allocate those finite elements within the reach of a truss member. Fig. 2 illustrates the region generated by the cutoff distance in two dimensions. In Table 2. Member Forces in Anchorage Block Design Example from FIB Model Members Length 共cm兲 Member force 共kN兲 Members Length 共cm兲 Member force 共kN兲 T1 40.0 580.7 C1 78.5 −1 , 139.1 T2 67.5 3,171.2 C2 98.8 −2 , 665.1 T3 60.0 1,618 C3 90.3 −3 , 761.2 T4 67.5 2,800 C4 72.1 −1 , 047.0 T5 40.0 1,660 C5 78.5 −3 , 256.1 T6 67.5 2,800 — — — T7 40.0 1,660 — — —
Fig. 4. Flowchart of proposed strut-and-tie design methodology
three dimensions, this cutoff distance yields a region with a cyl-inder around the longitudinal axis and two hemispheres around two nodes of this truss member. Second, remaining finite ele-ments from the evolved topology located within this region are identified. The effective area for the truss member is then ob-tained from dividing the summing volume by the length of the truss member. The proposed procedure can be summarized as follows:
1. For the ith truss member connecting with the jth and
kth solid elements, calculate the length Li for the truss member
Li=
冑
共xj− xk兲2+共yj− yk兲2+共zj− zk兲2 共5兲2. For the qth remaining element with the central point 共xq, yq, zq兲, calculate the projected point 共xp, yp, zp兲 on the
longitudinal axis of the truss
冦
xp= xj+共xk− xj兲t yp= yj+共yk− yj兲t zp= zj+共zk− zj兲t 共6a兲 t =共xq− xj兲共xk− xj兲 + 共yq− yj兲共yk− yj兲 + 共zq− zj兲共zk− zj兲 共Li兲2 共6b兲 3. Calculate the distance dpq of all remaining elements to thelongitudinal axis of the ith truss. The volume of the ith truss member Viis then the sum of the volumes of the solid
ele-ments within the cutoff distance r
dpq=
冑
共xq− xp兲2+共yq− yp兲2+共zq− zp兲2 共7a兲 if dpq⬍ r:Vi= Vi+ Velemq 共7b兲in which Velemq =volume of the qth finite element.
4. Finally, the effective area of the ith truss member, Ai, can be obtained by dividing the volume with the member length Li
Ai=
Vi
Li
共8兲 We note that the evaluation of effective areas of truss members depends naturally on the choice of cutoff distances. However,
thanks to the truss-like arrangement of the remaining finite ele-ments, it is generally not very difficult to identify a suitable range of cutoff distances for a given problem. In this range, member forces of truss members are relatively insensitive to the choice of cutoff distances.
After the effective areas of truss members are determined, the elastic modulus of concrete共Ec兲 is assigned to each truss member.
Member forces for the statically indeterminate strut-and-tie model are obtained from the analysis. Given the force, the cross-sectional area for the tension member is then calculated by
As=
T fy
共9兲 where As= required area for a tension tie. The T and fyrepresent
the tensile force and yield stress of the reinforcement. Care must be taken as the real distribution of bars may need to be considered when treating the nodes and checking for adequate anchorage. Finally, consideration of secondary reinforcements may be needed to control cracking.
Evaluation of Concrete Compressive Strength
To evaluate the effective compressive strength of the struts and nodes, an analytical three-dimensional failure criterion for con-Fig. 6. Optimal topology of anchorage block:共a兲 evolutionary structural topology; 共b兲 connecting truss elements
crete is utilized. The strength of concrete under multiaxial stresses is a function of the stress state and can only be properly deter-mined by considering the interaction of various stress compo-nents. The failure evaluation is only carried out for the initial continuum structure, not during the evolutionary process. This is because the evolutionary process is used to help engineers estab-lish the corresponding strut-and-tie model. In real world, no ele-ments are removed from the considered structure.
For two-dimensional cases, Yun共2000兲 employed the biaxial stress failure envelope proposed by Kupfer and Gerstle 共1973兲 to evaluate the compressive strength of nodal zones from finite element analyses. In this study, Ottosen’s four-parameter strength criterion for concrete 共Ottosen 1977兲 is adopted. Ottosen’s strength criterion is in good agreement with the experimental re-sults over a wide range of stress states共Chen 1982兲. The four-parameter failure function can be described as
f共I1,J2,cos 3兲 = a J2 共fc⬘兲 2+共cos 3兲
冑
J2 fc⬘ + b I1 fc⬘− 1 共10兲 cos 3 =3冑
3 2 J3 J23/2 共11兲where a and b=material parameters; I1=first invariant of the stress
tensor and J2and J3=second and third invariants of the deviatoric stress tensor; fc⬘=uniaxial compressive strength of concrete; and
= function of cos 3 and can be determined from the following = k1cos
冋
1 3cos
−1共k
2cos 3兲
册
for cos 3 艌 0 共12a兲 = k1cos
冋
3 − 1 3cos −1共− k2cos 3兲
册
for cos 3 艋 0共12b兲 where k1and k2=material parameters. The values of a, b, k1, and
k2 depend on the ratio of the uniaxial tensile strength ft to the
uniaxial compressive strength fc⬘ 共Table 1兲. For a given stress state, if the value of the failure function, f共I1, J2, cos 3兲, is
greater than zero, it means that concrete will fail under this state. We note that only those elements under the compressive stress state need to be checked by Ottosen’s four-parameter strength criterion. A stress state that satisfies
I1艋 0 共13兲
is considered compressive. The tensile elements 共I1⬎0兲,
antici-pated to fail in the cracking type, represent tension members of a strut-and-tie model. Reinforcing steel and prestressing tendons will be arranged for these tension members.
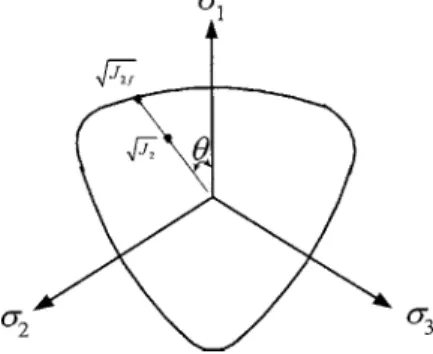
In addition to evaluating the compressive strength of concrete, the strength criterion can be used to determine load-carrying capacity of the structure. To this end, a stress ratio is defined as 共Fig. 3兲
 =
冑
J2冑
J2f共14兲 where J2denotes the second deviatoric stress invariant of a stress
state due to a given load. The J2f denotes the failure deviatoric
stress invariant by solving the quadratic equation defined by let-ting Eq.共10兲 be zero. For all the compressive elements satisfying Eq.共13兲 in an initial continuum, we can calculate the stress ratio  according to Eq. 共14兲 and consequently find the maximum valuemax. The load carrying capacity can then be determined by
dividing the given load bymax. It is worth noting that the
above-obtained load-carrying capacity is in general rather conservative because it assumes that the first occurrence of the limit state of an element represents the limit state of a whole structure.
Flowchart for Proposed Design Methodology
Putting it all together, a flowchart for the proposed design meth-odology is shown in Fig. 4. We first model the structure with solid finite elements and evaluate the stress ratio for each compres-sive element. An optimal topology is then generated using the RESO method. Through the optimal topology, a truss model is Table 3. Member Forces in Anchorage Block Design Example by RESO Method Members Length 共cm兲 Member force 共kN兲 Members Length 共cm兲 Member force 共kN兲 TA1 40.0 580.7 CA1 78.5 −1 , 139.1 TA2 67.5 3,171.2 CA2 98.8 −2 , 665.1 TA3 60.0 1,618 CA3 90.3 −3 , 761.2 TA4 78.5 3,267.8 CA4 72.1 −1 , 047.0 — — — CA5 40.0 −5.9 — — — CA6 67.5 −9.52
Fig. 8. Effective area versus cutoff distance r for truss member CA3
共unit: cm兲
Fig. 9. Strut-and-tie model of anchorage block resulting from RESO
developed interactively. The effective areas of the truss members can be computed by the proposed stiffness finding method. Con-sequently, the member forces of the truss model can be obtained. Finally from the forces of the tension members, the required re-inforcements can then be determined. Unlike the conventional methodology illustrated in Fig. 1, most tasks in the proposed methodology are performed automatically or semiautomatically.
Numerical Examples
The feasibility of the proposed strut-and-tie design methodology for three-dimensional reinforced structures is demonstrated below. In these examples, the eight-node brick element is used for the finite element analysis共Cook et al. 2002兲. These examples are conducted using an in-house object-oriented program, developed to maximize flexibility and maintainability for future extension. Additionally, interactive computer graphics are utilized to aid modeling processes in three dimensions. Detailed features of the program can be found in Huang共2003兲.
Anchorage Block
An anchorage block is considered in this example. The block is supported by two rollers and one hinge at the corners of the lower surface. The configuration and external loads of the anchorage block are shown in Fig. 5共a兲. The corresponding strut-and-tie model suggested by FIB 共2002兲 is shown in Fig. 5共b兲. In the figure, the solid and dashed lines represent tension ties and com-pressive struts, respectively. The member forces of the FIB model are listed in Table 2.
The design domain is discretized with 2,250 equal-sized finite elements. Each side of the element is equal to 4.5 cm. The elastic modulus Ec and Poisson’s ratio of concrete are assumed to be
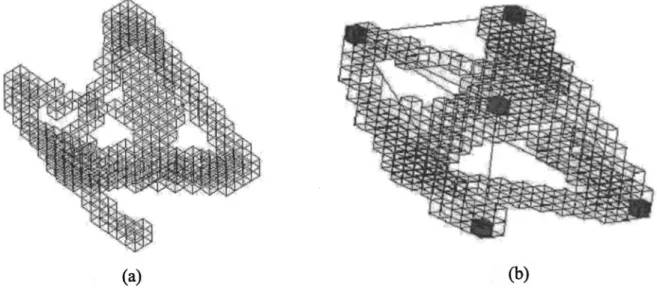
26, 000 MPa and 0.2, respectively. Fig. 6共a兲 shows the optimal topology developed by the RESO method with the highest value of the performance index. Fig. 6共b兲 shows the truss model derived from the evolved topology. The performance index history is shown in Fig. 7; it takes 1,556 evolution steps to reach the opti-mal topology.
From the truss model in the evolved topology 关Fig. 6共b兲兴, designers can select an appropriate cutoff distance r to calculate the effective areas and consequently member forces of the truss. Fig. 8 shows the relationship between cutoff distances r and com-puted areas for the member CA3in Fig. 9. From Fig. 8, we can
observe a tendency that in a specific range of cutoff distances, the increasing rate of effective areas is reduced. In this range, the computed member forces are relatively insensitive to the choice of cutoff distances. The member forces computed in this example are listed in Table 3.
The strut-and-tie model suggested by the RESO method is shown in Fig. 9. From Figs. 5共b兲 and 9, one can observe that the strut-and-tie model developed by the RESO method is similar to that of FIB 共2002兲. The main difference occurs in the transmis-sion of the upward load PZ8. In Fig. 5共b兲 共FIB 2002兲, the load PZ8
is carried through the tension member T7. In the RESO method
or Fig. 9, however, the load PZ8 is carried by both the tension
member TA4and the compressive member CA
5, which makes the tension member T6of Fig. 5共b兲 become compressive member CA6
of Fig. 9.
There are two possible reasons to explain the difference be-tween the two. First, the model suggested by the RESO method depends mainly on the material efficiency in carrying external loading. In general, the summing product of the tie length and the tensile force can be used as a simple criterion for optimizing a strut-and-tie model 共Schlaich et al. 1987兲. In this example, the proposed model has a smaller value than that of the FIB design example; it is thus believed to be an optimum one. Second, the model suggested in the FIB design examples may need to take the construction process into account. Thus the FIB model leads to the reinforcement arrangements being parallel to the edges of the structure in order to simplify construction process.
Table 4. Summary of Reinforcements in Pile Cap Design Example Members Steel reinforcement Area of steel 共mm2兲 7-No. 10aat 45 mm 700共layer 1兲 T1 7-No. 10 at 45 mm 700共layer 2兲 7-No. 10 at 45 mm 700共layer 3兲 3-No. 10 at 45 mm 300共layer 1兲 T2 5-No. 10 at 45 mm 500共layer 2兲 3-No. 10 at 45 mm 300共layer 3兲 4-No. 10 at 70 mm 400共layer 1兲 T3 4-No. 10 at 70 mm 400共layer 2兲 4-No. 10 at 70 mm 400共layer 3兲 a
No. 10 is a 11.3 mm diam bar with a cross-sectional area of 100 mm2 Fig. 10. Pile cap design example共unit: cm兲: 共a兲 top view; 共b兲 side view
Pile Cap
The example is one of the six pile caps conducted experimentally by Adebar et al. 共1990兲 to examine the suitability of three-dimensional strut-and-tie models for the pile cap design. Details of the test specimen are given in Fig. 10 and Table 4. The pile cap is supported on six piles and designed using a strut-and-tie model for an applied load of 3 , 000 kN acting on the column. The elastic modulus Ecand Poisson’s ratio for concrete are assumed to be
26, 000 MPa and 0.2, respectively. The concrete cylinder uniaxial compressive and tensile strength are 27.1 and 3.7 MPa, respec-tively. Consequently, the ratio of concrete tensile strength to com-pressive strength is roughly taken as 0.12 in the four-parameter failure criterion. In addition, the yield stress and nominal area for Number 10 steel are 479 MPa and 100 mm2, respectively.
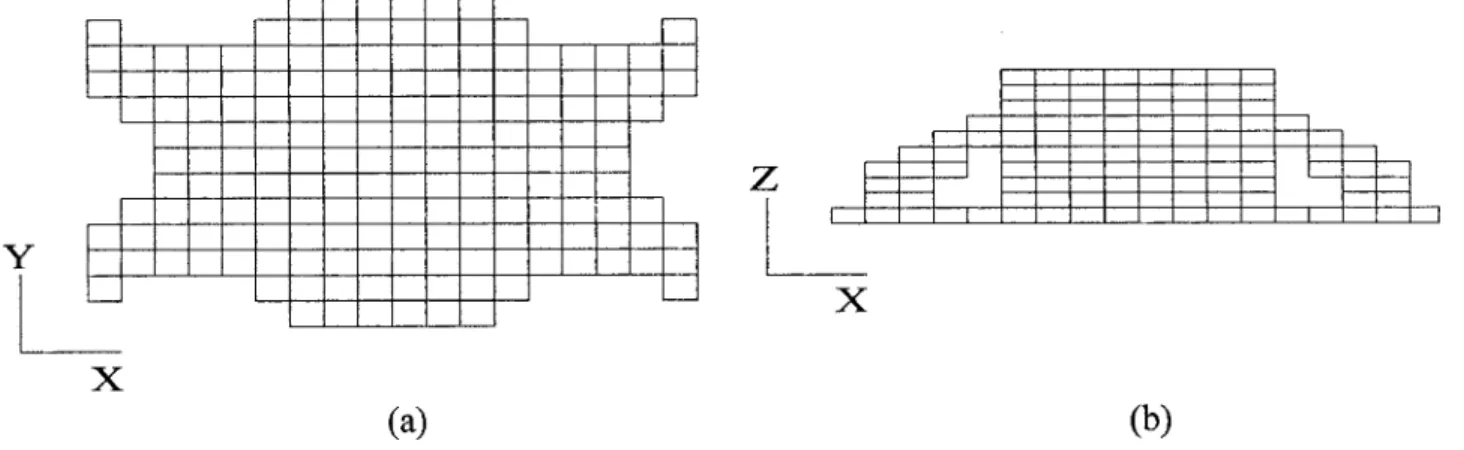
The design domain from Fig. 10 is discretized with 4,420 equal-sized finite elements. The length, width, and height for an element are 10, 10, and 6 cm, respectively. The final evolutionary topology is reached when the elements in conjunction with the four outer piles are ready to be removed. The resulting topology is shown in Fig. 11. One can observe that the two legs connected to the middle piles comprise more elements than the other piles. This load-carrying mechanism agrees well with the experimental observations in which these two piles resist the majority of loads 共Adebar et al. 1990兲.
From the final topology, designers can develop a strut-and-tie model as shown in Fig. 12, where the solid and dashed lines represent tension ties and compression struts, respectively. This model is the same as that of Adebar et al. 共1990兲 which was obtained from the designers’ experiences. For this example, a
cut-off distance of 40 cm is employed. The calculated effective areas and member forces are listed in Table 5. As one would expect, the C2members in the middle have larger cross-sectional areas than
the other members. The required reinforcement areas of the strut-and-tie model are shown in Table 6.
It is worth noting that designers have to take specifications about temperature reinforcements共ACI 2002兲 into consideration. The minimum ratio for temperature reinforcements to the gross concrete area is 0.0018. Consequently, the final reinforcement arrangements for the strut-and-tie model are listed in Table 6. One can observe that the longitudinal reinforcements 共T1兲 and
the outer transverse reinforcements 共T2兲 are increased to satisfy
the specification.
It is interesting to compare the reinforcement requirements computed from the optimal topology with those obtained empiri-cally in Adebar et al.共1990兲. From Table 6, one can observe that the derived strut-and-tie model by the RESO method uses a total of 2 , 800 mm2reinforcements 共or 3,600 mm2 with the
tempera-ture specification taken into account兲. On the other hand, the empirical arrangement in Adebar et al.共1990兲 from Table 4 uses a total of 4 , 400 mm2 reinforcements. This is expected because
the optimal topology from the RESO method should produce a more efficient load-carrying mechanism.
Finally, the ultimate load of the pile cap from the experimental measurement is 2 , 892 kN共Adebar et al.兲. The external load used in the finite element model is 2 , 980 kN, and the maximum stress ratiomaxis 1.053. In other words, the ultimate load for concrete
failure predicted by this study is 2 , 830 kN. The predicted ulti-mate load is less than the experimental result by only 2.1%. Conclusions
In this paper, a design methodology for developing a three-dimensional strut-and-tie model is presented. A strut-and-tie Table 5. Areas and Member Forces in Pile Cap Design Example from RESO Method
Members
Cross section area 共cm2兲 Member force 共kN兲 T1 1,618 166.54 T2 442.5 83.27 T3 4,200 1,183.46 C1 2,423 −207.92 C2 4,634 −1 , 769.09
Fig. 11. Pile cap design example by RESO method:共a兲 topology from RESO 共top view兲; 共b兲 topology from RESO 共side view兲
Fig. 12. Strut-and-tie model suggested by RESO method for pile cap
model for the considered reinforced concrete structure is estab-lished based on the RESO method. For a statically indeterminate case, a simple stiffness finding algorithm is developed to estimate the relative stiffness of the truss members from the evolved to-pology. The concrete compressive strength evaluation is per-formed by Ottosen’s four-parameter strength criterion.
Two design examples demonstrate the suitability of the pro-posed methodology. In the anchorage block example, the derived strut-and-tie model by the RESO method agrees with those from design experience. A small difference between the two can mainly contribute to the issue concerning with construction in practice. In the pile cap example, we observe that the load-carrying mecha-nism from the evolved topology agree well with the experimental measurements. The load-carrying capacity of the structure is also well predicted by Ottosen’s failure criterion.
Finally, we must emphasize that the proposed method is mainly based on linear elastic analysis. The effects of concrete crack are indirectly taken into account while evaluating concrete compressive strength. However, the effects of the tension stiffen-ing, the arrangement of steel reinforcements and the degree of disruption of the nodal zone due to the incompatibility of tensile strains in the ties are not considered. Furthermore, the effects of nonlinear load-deformation responses and softening of concrete are not taken into account. These limitations and uncertainties need to be addressed in the future.
Notation
The following symbols are used in this paper:
Ai ⫽ relative area of ith truss member in strut-and-tie
models;
As ⫽ cross-sectional area of reinforcement;
dpq ⫽ distance of pth remaining element to projected
point on ith truss member; ER ⫽ evolution rate;
fc⬘ ⫽ uniaxial compressive strength of concrete; fy ⫽ yield stress of reinforcement;
I1 ⫽ first invariant of stress tensor;
J2 ⫽ second invariant of deviatoric stress tensor;
J3 ⫽ third invariant of deviatoric stress tensor;
关ki兴 ⫽ element stiffness matrix corresponding to ith
elements;
Li ⫽ length of ith truss element;
PI ⫽ performance index; RR ⫽ rejection ratio;
T ⫽ tension force in strut-and-tie models;
兵ui其 ⫽ displacement vector corresponding to ith element;
V ⫽ volume of structure;
Vi ⫽ volume of ith truss element;
W ⫽ strain energy of structure;
wi ⫽ strain energy density of ith element; wave ⫽ average strain energy density of structure;
共x,y,z兲 ⫽ coordinates; and
 ⫽ stress ratio of compression elements.
Acknowledgment
This research was supported by the National Science Council of the Republic of China through Grant No. NSC 91-2211-E-002-078.
References
Adebar, P., Kuchma, D., and Collins, M. P.共1990兲. “Strut-and-tie models for the design of pile caps: An experimental study.” ACI Struct. J.,
87共1兲, 81–92.
Ali, M. A.共1997兲. “Automatic generation of truss models for the optimal design of reinforced concrete structures.” Ph.D. thesis, Cornell Univ., Ithaca, N.Y.
Ali, M. A., and White, R. N. 共2001兲. “Automatic generation of truss model for optimal design of reinforced concrete structures.” ACI
Struct. J., 98共4兲, 431–442.
American Concrete Institute 共ACI兲 Committee 318. 共2002兲. “Building code requirements for structural concrete.” ACI 318-02, Farmington Hills, Mich.
American Society for Civil Engineers – American Concrete Institute 共ASCE-ACI兲 Committee 445. 共1998兲. “Recent approaches to shear design of structural concrete.” J. Struct. Eng., 124共12兲, 1375–1417. Biondini, F., Bontempi, F., and Malerba, P. G. 共2001兲. “Stress path
adapting strut-and-tie models in cracked and uncracked R.C. elements.” Struct. Eng. Mech., 12共6兲, 685–698.
Chen, W. F.共1982兲. Plasticity in reinforced concrete, McGraw–Hill Inc., Singapore.
Cook, R. D., Malkus, D. S., Plesha, M. E., and Witt, R. J. 共2002兲.
Concepts and applications of finite element analysis, 4th Ed., Wiley,
New York.
Fédération Internationle de la Précontrainte 共FIP兲. 共1996兲.
Recommendation—Practical design of structural concrete, London.
Fédération Internationale Du Béton 共FIB兲. 共2002兲. “Design examples for the 1996 FIP recommendations—Practical design of structural concrete.” Technical Rep., International Federation for Structural Concrete共fib兲, London.
Hinton, E., and Sienz, J. 共1995兲. “Fully stressed topological design of structures using an evolutionary procedure.” Eng. Comput., 12共2兲, 229–244.
Hsu, T. T. C.共1993兲. Unified theory of reinforced concrete, CRC Press, Boca Raton, Fla.
Table 6. Summary of Reinforcements in Pile Cap Design Example from RESO Method
From strut-and-tie model Temperature steel included
Members Reinforcement Area 共mm2兲 Reinforcement Area 共mm2兲 5-No. 10 at 45 mm 500共layer 1兲
T1 3-No.10 at 70 mm 300 5-No. 10 at 45 mm 500共layer 2兲
T2 2-No.10 at 45 mm 200 3-No. 10 at 45 mm 300
7-No.10 at 45 mm 700共layer 1兲 7-No. 10 at 45 mm 700共layer 1兲
T3 9-No.10 at 45 mm 900共layer 2兲 9-No. 10 at 45 mm 900共layer 2兲
Huang, C. W.共2003兲. “Theory and software development of strut-and-tie models by using topology optimization techniques.” Ph.D. thesis, National Taiwan Univ., Taipei, Taiwan共in Chinese兲.
Kupfer, H., and Gerstle, K. H.共1973兲. “Behavior of concrete under biax-ial stresses.” J. Eng. Mech. Div., Am. Soc. Civ. Eng., 99共4兲, 853–866. Li, Q., Steven, G. P., and Xie, Y. M. 共2001兲. “A simple checkerboard suppression algorithm for evolutionary structural optimization.”
Struct. Multidiscip. Optim., 22共3兲, 230–239.
Liang, Q. Q., and Steven, G. P.共2002兲. “A performance-based optimiza-tion method for topology design of continuum structures with mean compliance constraints.” Comput. Methods Appl. Mech. Eng.,
191共13–14兲, 1471–1489.
Liang, Q. Q., Uy, B., and Steven, G. P.共2002兲. “Performance-based op-timization for strut-tie modeling of structural concrete.” J. Struct.
Eng., 128共6兲, 815–823.
Liang, Q. Q., Xie, Y. M., and Steven, G. P.共2000兲. “Topology optimiza-tion of strut-and-tie models in reinforced concrete structures using an evolutionary procedure.” ACI Struct. J., 97共2兲, 322–330.
MacGregor, J. G.共1997兲. Reinforced concrete mechanics and design, 3rd Ed., Prentice-Hall, Upper Saddle River, N.J.
Ottosen, N. S.共1977兲. “A failure criterion for concrete.” J. Eng. Mech.
Div., Am. Soc. Civ. Eng., 103共4兲, 527–535.
Schlaich, J., and Schäfer, K.共1991兲. “Design and detailing of structural concrete using strut-and-tie models.” Struct. Eng., 69共6兲, 113–125. Schlaich, J., Schäfer, K., and Jennewein, M.共1987兲. “Toward a consistent
design of structural concrete.” PCI J., 32共3兲, 75–150.
Tjhin, T. N., and Kuchma, D. A.共2002兲. “Computer-based tools for de-sign by strut-and-tie method: Advances and challenges.” ACI Struct.
J., 99共5兲, 586–594.
Xie, Y. M., and Steven, G. P.共1993兲. “A simple evolutionary procedure for structural optimization.” Comput. Struct., 49共5兲, 885–896. Yun, Y. M. 共2000兲. “Computer graphics for nonlinear strut-tie model
approach.” J. Comput. Civ. Eng., 14共2兲, 127–133.
Zhao, C., Hornby, P., Steven, G. P., and Xie, Y. M.共1998兲. “A generalized evolutionary method for numerical topology optimization of structures under static loading conditions.” Struct. Optim., 15共3/4兲, 251–260.