地球副磁暴現象之物理(III)
36
0
0
全文
(2) 中. 華. 民. 國 99 年 11 月 02 日.
(3) 行政院國家科學委員會補助專題研究計畫. ■ 成 果 報 告 □期中進度報告. 計劃名稱:地球副磁暴現象之物理(3/3) 計畫類別:■個別型計畫 □整合型計畫 計畫編號:NSC 98-2628-M-006-001- 執行期間:98 年 8 月 1 日至 99 年 7 月 31. 日. 執行機構及系所:國立成功大學太空天文與電漿科學研究所 計畫主持人:陳秋榮 共同主持人: 計畫參與人員:周晁光、張滋芳. 成果報告類型(依經費核定清單規定繳交):□精簡報告. ■完整報告. 本計畫除繳交成果報告外,另須繳交以下出國心得報告: □赴國外出差或研習心得報告 □赴大陸地區出差或研習心得報告 □出席國際學術會議心得報告 □國際合作研究計畫國外研究報告. 處理方式:除列管計畫及下列情形者外,得立即公開查詢 □涉及專利或其他智慧財產權,□一年□二年後可公開查詢 中. 華. 民. 國. 99. 年. 10. 月. 29. 日.
(4) 目錄. 目錄. I. 「地球副磁暴現象之物理」成果報告中文摘要. II. Abstract I. Introduction II. Observations of Substorm Events III. Dispersionless Energetic Particle Injection During Substorms IV. The axisymmetric equilibrium model of planetary magnetosphere V. Summary and Discussion. III 1 2 10 14 17. I.
(5) 「地球副磁暴現象之物理」成果報告中文摘要 關鍵字:副磁暴、高能粒子傳輸、極光弧、磁層 副磁暴期間地球磁層與電離層典型的發展過程,是自成長期到副磁暴發生,接著擴張期, 直到恢復到先前的副磁暴狀態。在副磁暴不同的階段,磁層與電離層明顯展現三維的整體與局 部特性。本專題研究計畫在副磁暴現象的研究成果,分成三個領域說明如下: (1) 以THEMIS地面全幅影像儀、福衛2號之高空向上大氣閃電儀(ISUAL)、以及地面磁力計 觀測副磁暴成長末期,然後副磁暴發生,直到擴張期的副磁暴爆發。 (2) 建構由地球同步軌道衛星觀測副磁暴發生期間之高能粒子非分散射入的模型,特別的 是我們在計算粒子動力學時導入了相對論效應。 (3) 建構了軸對稱磁層平衡態的模型並首先應用於土星,得出了離子密度,環電流,磁場, β等物理參數在軸對稱磁層的分布情形。. II.
(6) Abstract Keywords: substorm, energetic particle injection, auroral arcs, magnetosphere The Earth’s magnetosphere and ionosphere during substorms evolve typically from the growth phase to substorm onset to the expansion phase and then recover to pre-substorm states. During different phases of substorms the magnetosphere and ionosphere exhibit distinct 3D global and local features. Here, we report our progress in the study of substorm phenomena on the following three areas: (1) Observations of substorm events from the late growth phase to substorm onset and to the expansion phase by using THEMIS ground-based All-Sky Imagers, the Imager for Sprites and Upper Atmospheric Lightning (ISUAL) aboard the FORMOSAT-2 satellite, and ground-based magnetometers. (2) Modelling of energetic particle dispersionless injection observed by geosynchronous satellites during substorms. In particular, we include relativistic effect in computing the particle dynamics. (3) We propose an axisymmetric equilibrium model which is first applied to Saturn’s magnetosphere and the solutions such as the distribution of heavy ion density, ring current and plasma beta can be constructed numerically by the iterative scheme.. III.
(7) I. Introduction One major challenge in space physics is to understand the physics of substorm that relates magnetospheric dynamics to solar activity and ionospheric coupling. Substorms are the most critical energy storage and release process in the magnetosphere-ionosphere, which can violently rearrange the topology of the magnetic field and plasma distributions in the magnetosphere, and dump large amount of energy into the ionosphere producing auroral activity, which serves as a visible projection of magnetospheric dynamics in ionosphere. Substorms usually evolve from the growth phase to onset to the expansion phase and then to the recovery phase. This report addresses (1) the observations of substorm events by FORMOSAT-2/ISUAL, ground-based magnetometers, and THEMIS All Sky Imagers, and (2) Dispersionless energetic particle injection. The key features of ionosphere during the growth phase and substorm onset are that (1) the proton and electron aurora region shrinks in width and moves equatorward in the growth phase; (2) “breakup” arc (with azimuthal mode number of ~ 200-300) appears in proton precipitation region (poleward side of proton aurora) a few minutes prior to onset; (3) “breakup” arc intensifies and brightenting occurs at a local spot initially at onset. The corresponding features in the magnetosphere are that (1) the magnetic field in the near-Earth plasma sheet thins and becomes tail-like as pressure and cross-tail current increase in the growth phase; (2) ULF instability in Pi 2 frequency range (period ~ 60-100s) is initiated in a radially localized region prior to onset; (3) ULF instability grows to large amplitude (ΔB/B ~ 0.5) at most unstable location in the near-Earth plasma sheet region (at X ~ -9 Re) at substorm onset. Moreover, another key feature of substorms in the magnetosphere is the observation of the enhancement of energetic electron and proton fluxes by several orders of magnitude simultaneously for energy range from 100 keV - 1 MeV by geosynchronous satellites. This phenomenon is called the dispersionless energetic particle enjection. Any successfully substorm theory/model must be able to explain these observation features. In order to further understand the substorm phenomena we have performed the following studies: (1) Modeling of the 3-D magnetospheric structure and formation of strong cross-tail current in the near-Earth plasma sheet during substorm growth phase by quasi-static equilibrium solutions obtained from the force-balance equation for given equatorial pressure distributions; (2) Observations of substorm breakup arcs from the late growth phase to substorm onset and to the expansion phase by using ground-based magnetometers, THEMIS satellites and ground-based All Sky Imagers, and the Imager for Sprites and Upper Atmospheric Lightning (ISUAL) aboard the FORMOSAT-2 satellite, which provides 1 sec exposure in narrow band-width of optical images with high cadence (one image every 1.4 sec); (3) Modeling of the ULF (in the Pi 2 frequency range) instability responsible for the breakup auroral arcs by the Kinetic Ballooning Instability (KBI), which is destabilized by plasma pressure gradient and magnetic field curvature in the high beta magnetic well region in the near-Earth plasma sheet; and (4) Modeling of the dispersionless energetic particle injection which is mainly related to the magnetic field dipolarization in the current 1.
(8) disruption region. We have found that our 3D model of growth phase magnetospheric structure is consistent with satellite observations. The observed optical images by ISUAL show fine structure of breakup arcs with separation distance between successive bright spots of about 100 km, which is equivalent to azimuthal mode number of ~200. The initial breakup arcs can be explained by the KBI. The KBI has a real frequency associated with the ion magnetic drift frequency, which is in the Pi2 frequency range, and the most unstable KBI has an azimuthal mode number on the order of 200-300. The azimuthal structure of KBI produces alternately directed field-aligned electric field and the upward electric field accelerates electrons into the ionosphere to produce bright spots in the discrete arcs. The theoretical KBI features are consistent with observational features both in the aurora breakup arcs by ISUAL and in the near-Earth plasma sheet by AMPTE/CCE. The modeling of dispersionless energetic particle injection by including relativistic effect have produced a better understanding of the physical mechanism of energetic particle acceleration and transport. Below we describe our progress in the areas of substorm event observations and modeling results of dispersionless energetic particle injection.. II. Observations of Substorm Events Substorm onset mechanism that is responsible for releasing energy stored in the magnetosphere to ionosphere is still controversial in the magnetospheric substorm studies. Current disruption in the inner magnetosphere and magnetic reconnection at the near-Earth neutral line (NENL) are two models commonly used to describe substorm onset and numerous observations from ground and space are proceeding to bring closure to the questions. Near-Earth neutral line (NENL) model assert that magnetic reconnection causes the substorm outside 20 Re [e.g., Baker et al., JGR, 101, 12975 (1996)]. Near-Earth onset medel asserts that some instability causes a substorm inside 10 Re [e.g., Cheng and Lui, GRL, 25, 4091 (1998)]. It is predicted that the ballooning instability in the near-Earth tail is a possible trigger of the substorm expansion phase [e.g., Cheng and Zaharia, GRL, 31, L06809, doi:10.1029/2003GL018823 (2004)]. Evolution of substorm onset arcs has been extensively observed by ground-based optical instruments and global auroral imagers on satellites. However, the limited temporal and spatial resolutions afforded by instruments have not been sufficient to explore what the features of breakup arcs indicate in terms of the substorm onset mechanism. We study observational data of substorms from THEMIS satellites and ground all-sky-camera. We also use ISUAL CCD camera to take auroral images at wavelengths of 557.7nm and 630.0nm with a time resolution of 1.4 second. Two objectives in this report are shown as follows. First, we highlight the new capabilities that ISUAL observations bring to substorm studies. Second, we explore the azimuthal structure and evolution of the auroral breakup arcs on a time scale of tens of 2.
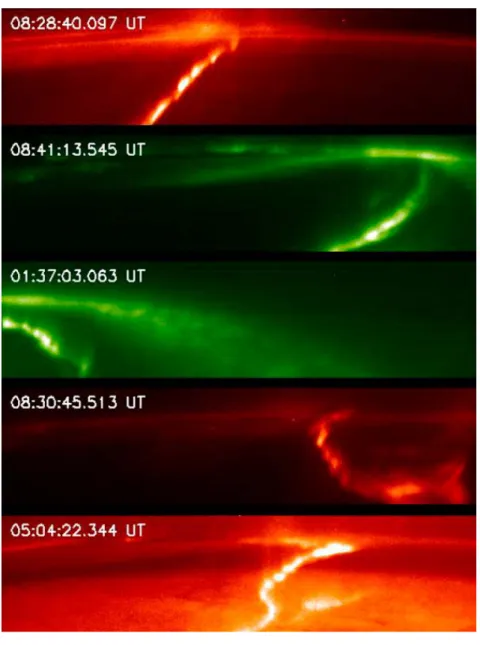
(9) seconds and discuss the substorm onset mechanisms by combing these observational data.. ISUAL observations ISUAL pointing eastward, with 20°×5° field-of-view and a spatial resolution ~2 km/pixel of the intensified ISUAL CCD Imager, observes aurora activities by limb scan. A pixel of the ISUAL Imager is read by integrating the optical emissions from all points along the line of sight. Counts are translated into intensity based on the lab calibration before launch [Mende et al., JGR, 110, A11312, 10.1029/2005JA011064 (2005)]. From the geometry of the observations, the geomagnetic coordinates of auroral features are deduced from the imager frame with the assumption that the events are at certain heights [Chen et al., Eos Trans. AGU, Fall meet. Suppl., Abstract AE31B-0164 (2004)]. We successfully observe breakup arc structures and the clear bright-dark fine structure of breakup arcs in the initial brightening phase. Figure 1 shows the bright-dark fine structure of breakup arcs prior to expansive phase onset observed by high resolution ISUAL CCD Imager for several substorm events. The evolution of breakup arc structures is essential for it can be used to test theories of substorm onset. The time dependence of the breakup arc is shown in the Figure 2. The brightest intensity increase exponentially. Since the breakup arc is caused by instability, the brightest intensity increases exponentially. The initial breakup arcs can be explained by the Kinetic Ballooning Instabilities (KBI). The KBI has a real frequency associated with the ion magnetic drift frequency, which is in the Pi2 frequency range, and the most unstable KBI has an azimuthal mode number on the order of 200-300. The azimuthal structure of KBI produces alternately directed field-aligned electric field and the upward electric field accelerates electrons into the ionosphere to produce bright spots in the discrete arcs. We are preparing papers to describe these auroral substorm events observations. Together with the ISUAL observations, we also include the auroral observations by THEMIS ground-based All-Sky Imagers and compare the results of these two different observation methods.. 3.
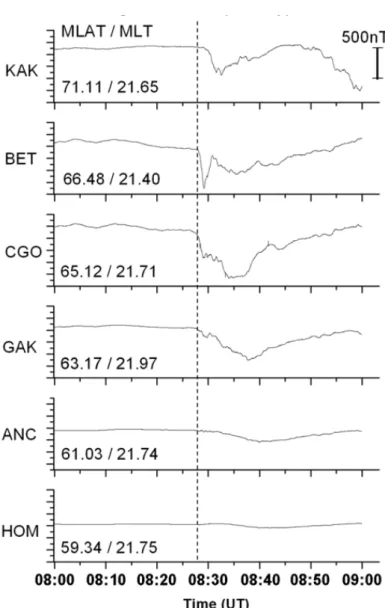
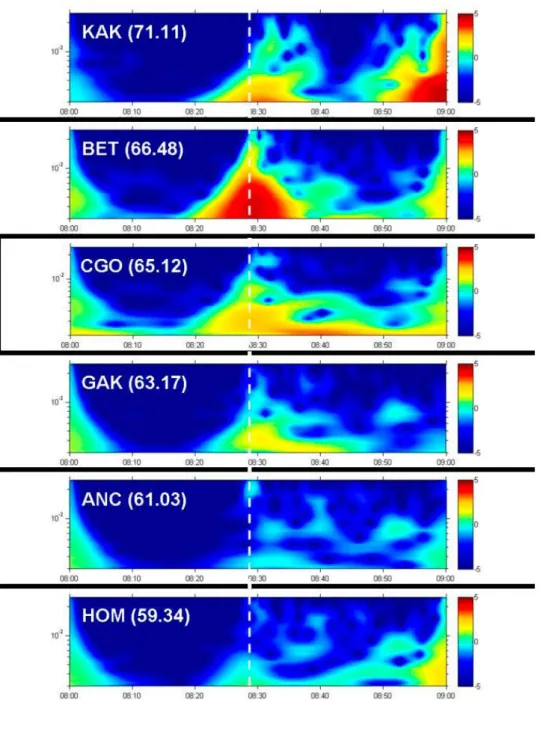
(10) Ground-based THEMIS All-Sky-Imager observations The auroral substorm is also observed by THEMIS ground-based observatory (GBO) network of all-sky-imagers (ASIs) [Mende et al., (2008)]. We show one of the events (on December 21, 2006) which is observed by part of the THEMIS GBO network of ASIs, Kiana (KIAN, GLAT and GLON: 66.97°N and 199.56°E), Gakona (GAKO, GLAT and GLON: 62.41°N and 214.84°E), and White Horse (WHIT, GLAT and GLON: 61.01°N and 224.78°E), respectively. ASI auroral images during this period of interest are shown in Fig. 3(a) and 3(b). The aurorl activation can be identified from west to east over the Alaska-Canada border region. The substorm initiation arc appears in the western part of the KIAN ASI field-of-view (FOV) at ~08:27:00, which then breaks up at ~08:27:48. The northern-side breakup arc then extends eastward into the GAKO ASI FOV and breaks up again at ~08:28:36 UT in the eastern part of the KIAN ASI FOV. After the second arc breakup, the newly breakup arc further intensifies and extends to the WHIT ASI FOV and eventually breaks up again at ~08:29:27, after which the aurora develops fully into the expansion phase. In addition, Inuvik (INUV, GLAT and GLON: 68.41°N and 226.23°E) is also fit to observe this auroral substorm because of its location. However, the sky was cloudy at the moment that the image data from INUV is insufficient for us to describe the auroral activation. Figure 4 shows H-component variations at Kaktovik (KAK), Bettles (BET), College International Geophysical Observatory (CGO), Gakona (GAK), Anchorage (ANC), Homer (HOM). The magnetometer data show negative enhancements starting from ~08:28 UT. Especially, the negative H-bay of ~800nT is observed at CGO (College, 65.2゜MLAT, 21:25 MLT), the nearest magnetometer site which mainly covers the breakup arc projection region. The auroral substorm was unfolding just at the beginning of the negative H-bay. Figure 5 shows the Pi2 pulsations from the high latitude magnetometer sites. Pi2 pulsations are impulsive and damped oscillations of geomagnetic fields in a period of 40 to 150 seconds (2-25 mHz). The Pi 2 wave packets associated with the auroral substorm event are identified a few minute prior to auroral substorm onset.. THEMIS satellite observations Pi2 pulsations generally occur successively prior to substorm onsets. we use HHT application to analyze the FGM data from THEMIS P5. Figure 6 show the HHT result of the X component of the perturbed field for the JAN 29, 2008 substorm event. The low frequency signals are prior to high frequency signals. It indicates that ULF instability in Pi 2 frequency range is initiated in a radially localized region prior to substorm onset.. 4.
(11) Figure 1 ISUAL observed breakup arcs which have bright spots with approximate equal-spaced separation in the azimuthal direction, which allows estimate of azimuthal mode number. We present images of the bright-dark structures emerging on the arcs prior to expansive phase onset.. 5.
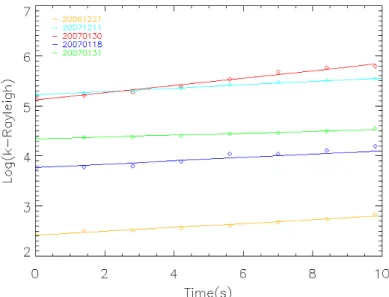
(12) Figure 2 Time dependence of most bright point for the breakup arc. The brightest intensity increase exponentially. Date. Filter (nm). Mode. Kp Values. Number. Growth rate. 2006.12.21. 630.0. 230. 4-. 0.0383(1/s). 2007.12.11. 557.7. 230. 3-. 0.0337(1/s). 2007.01.30. 557.7. 234. 4-. 0.0735(1/s). 2007.01.18. 630.0. 286. 3+. 0.0334(1/s). 2007.01.31. 630.0. 288. 3. 0.0182(1/s). Table 1 The details, including mode number and growth rate, of auroral substorms are shown in the table.. 6.
(13) Figure 3(a) ASI auroral images from KIAN, GAKO, and WHIT.. 7.
(14) Figure 3(b) ASI auroral images from KIAN, GAKO, and WHIT.. 8.
(15) Figure 4 H-component variations at Kaktovik (KAK), Bettles (BET), College International Geophysical Observatory (CGO), Gakona (GAK), Anchorage (ANC), Homer (HOM).. 9.
(16) Figure 5 Wavelet transform using the Gaussian Morlet mother wavelet. It shows Pi2 pulsations at Kaktovik (KAK), Bettles (BET), College International Geophysical Observatory (CGO), Gakona (GAK), Anchorage (ANC), Homer (HOM).. 10.
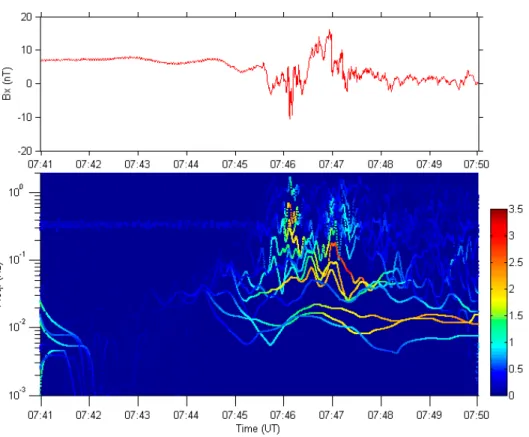
(17) Figure 6 (a) The X component of the magnetic field from the THEMIS A (P5) fro the Jan. 29, 2008 substorm event. (b) The HHT analysis of the X component of the perturbed field.. III. Dispersionless Energetic Particle Injection During Substorms One of the key features of substorms in the magnetosphere is the observation of the enhancement of energetic electron and proton fluxes by several orders of magnitude simultaneously for energy range from 50 keV - 1 MeV by geosynchronous satellites. This phenomenon is called the dispersionless energetic particle enjection. The key physical mechanism of the particle energization is the betatron acceleration. The mechanism involves the creation an enhanced dawn-to-dusk electric field packet in the substorm initiation region around 8-10 Re which moves toward the earth and sweeps particles to the geosynchronous orbit. As the particles are swept by the electric field package from the low magnetic field region via ExB drift to the geosynchronous orbit where magnetic field is stronger, particles gain energy because the conservation of magnetic moment. The dawn-to-dusk electric field packet is associated with the magnetic field depolarization in the cross-tail current disruption region and has been observed by satellites. The previous models of dispersionless energetic particle injection is based onnon-relatrivistic formulation of particle dynamics [e.g., Zaharia, Cheng, and Johnson, JGR, 105, 18741 (2000)]. 11.
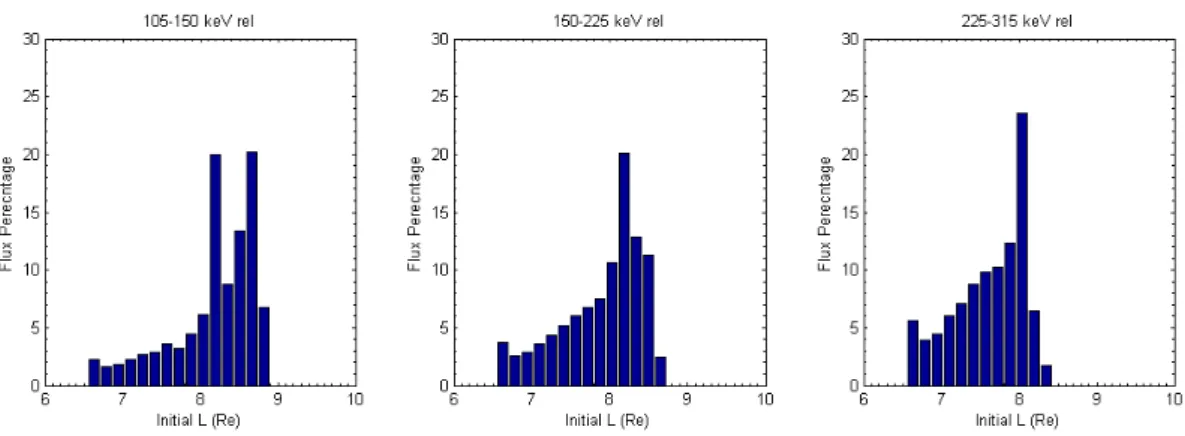
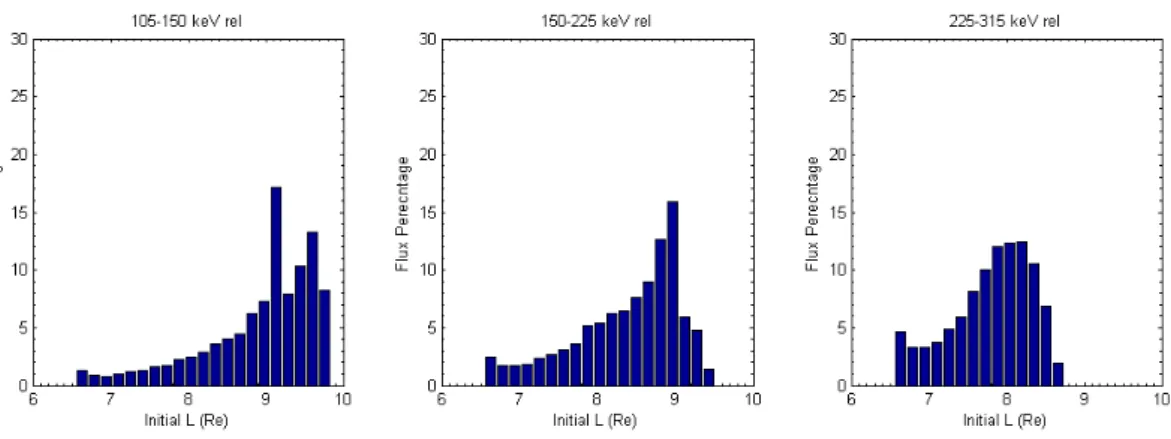
(18) However, for electrons with energy larger than 100 keV, relativistic effect becomes important. In the past year we have devoted much effort in understanding the relativistic effect on particle injection. In the modeling calculations we employ the same electric field pulse model as that given by Zaharia et al. (2000), but vary the width of the pulse to give the best fit with observations. Figure 7 shows the comparison of results among our relativistic model and non-relativistic model [Zaharia, Cheng, and Johnson, JGR, 105, 18741 (2000)] for the same pulse width parameter Δ1 = 11000 km and electric amplitude parameter E0 = 3.65 mV * 9 Re, and electron flux observation by 3 LANL geosynchronous satellites for 3 different energy bands, 105-150 keV, 150-225 keV, and 225-315 keV. It is clear that the model calculations reproduce the key features of dispersionless energetic particle injection observed the 3 LANL geosynchronous satellites, such as the peak enhanced electron fluxes. However, the peak electron flux for the relativistic model is about a factor of 2 less than that from the non-relativistic model results of Zaharia et al. with a reduction in electron flux of 49.74% for the 105-150 keV band, 56% for the 150-225 keV band, and 61.12% for the 225-315 keV band. This is mainly due to the relativistic effect which reduces the particle magnetic drift velocity and increases the adiabatic invariant: particle magnetic moment. To understand the reasons for the difference in results between non-relativistic and relativistic models, we show the radial distribution of percentage of particles that are swept to the geosynchronous orbit computed based on the non-relativistic model (Zaharia, Cheng, and Johnson, JGR, 105, 18741 (2000)) in Figure 8 and the relativistic model in Figure 9. From Figs. 8 and 9 we see that the more percentage of particles that are swept to the geosynchronous orbit come from location farther away in the relativistic case. This is because the particle magnetic drift velocity is smaller so that they can stay in the pulse longer. Moreover, particles that come from the same radial location with the same initial kinetic energy gain less kinetic energy after they arrive at the geosynchronous orbit due to relativistic effect modification of the magnetic moment. Moreover, the difference in the particle radial distribution due to relativistic effect is more evident for the higher energy band. To obtain a better modeling result using the relativistic model we adjust the pulse width with the pulse width parameter increased to Δ1 = 15000 km. The middle column figures in Figure 10 show that the relativistic modelling results are in better agreement than the non-relativistic case with the electron flux observations by 3 LANL geosynchronous satellites for 3 different energy bands, 105-150 keV, 150-225 keV, and 225-315 keV. Note that the results are even in better agreement than the non-relativistic case. In Figure 11 we show the corresponding radial distribution of percentage of particles that are swept to the geosynchronous orbit computed. By comparing with the non-relativistic case shown in Figure 8 we see that the particles are swept from further away radial location in the relativistic case. Moreover, the furthest particles can be swept to the geosynchronous orbit is about 9.8 Re which is further away from the non-relativistic case of about 8.8 Re. The more accurate relativistic model gives better agreement with observations over all, and the calculations show that substorm could be initiated in a little farther away distance, but it is still within the general conclusion that substorms are initiated in the 8-12 Re near-Earth current sheet region. 12.
(19) Zaharia model. Relativistic model. LANL satellite Observations. Figure 7 Comparison of results among our relativistic model and non-relativistic model [Zaharia et al., 2000] for the same pulse width parameter Δ1 = 11000 km and electric amplitude parameter E0 = 3.65 mV * 9 Re, and electron flux observation by 3 LANL geosynchronous satellites for 3 different energy bands, 105-150 keV, 150-225 keV, and 225-315 keV.. Figure 8 The radial distribution of fraction of particles that are swept by the pulse to the geosynchronous orbit computed based on the non-relativistic model (Zaharia, et al 2000) with the pulse width parameter Δ1 = 11000 km and electric amplitude parameter E0 = 3.65 mV * 9 Re.. 13.
(20) Figure 9 The radial distribution of fraction of particles that are swept by the pulse to the geosynchronous orbit computed based on the relativistic model with the pulse width parameter Δ1 = 11000 km and electric amplitude parameter E0 = 3.65 mV * 9 Re which is the same as in Fig. 8.. Zaharia model. Relativistic model. LANL satellite Observations. Figure 10 Comparison of results among our relativistic model with the pulse width parameter Δ1 = 15000 km and the electric amplitude parameter E0 = 3.65 mV * 9 Re, and non-relativistic model [Zaharia et al., 2000] with the pulse parameters Δ1 = 11000 km, E0 = 3.65 mV * 9 Re, and electron flux observations by 3 LANL geosynchronous satellites for 3 different energy bands, 105-150 keV, 150-225 keV, and 225-315 keV. 14.
(21) Figure 11 The radial distribution of fraction of particles that are swept by the pulse to the geosynchronous orbit computed based on the relativistic model with the pulse width parameter Δ1 = 15000 km and electric amplitude parameter E0 = 3.65 mV * 9 Re.. IV. The axisymmetric equilibrium model of planetary magnetosphere We perform the modeling of 2D axisymmetric equilibrium configurations of the Saturn’s magnetosphere by solving the Grad-Shafranov type equation by adopting the previously developed magnetospheric equilibrium code [Cheng, 1992] with the plasma density and temperature profiles in the equatorial plane as input. The Grad-Shfranov type equation takes into account the force balance in both parallel and perpendicular directions with respect to the magnetic field lines. The 2D equilibrium solutions of plasma density, temperature, magnetic field, current density and plasma beta are solved numerically and are shown in the meridian plane. By choosing proper input plasma and rotation profiles in the equatorial plane we obtain global solutions of magnetic field and plasma density and temperature of heavy ions that fit very well with the observed data along the orbits of Voyager 1 encounter with the Saturn’s magnetosphere on days 317 and 318 in 1980 and Voyager 2 encounter on days 237 and 238 in 1981, respectively. The equilibrium code provide a powerful tool to calculate the global structure of planet’s magnetosphere and the results of it’s application to Saturn has been published in Journal of Geophysical Research. ( Chou, M., and C. Z. Cheng (2010), Modeling of Saturn's magnetosphere during Voyager 1 and Voyager 2 encounters, J. Geophys. Res., doi:10.1029/2009JA015124 ). 15.
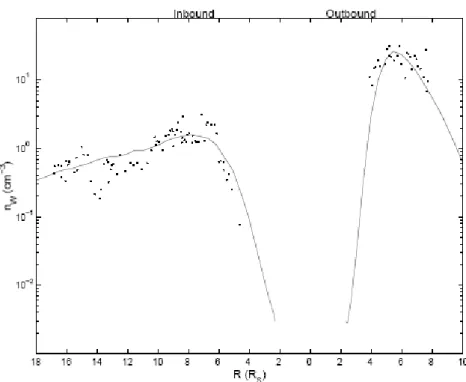
(22) Figure 12 The observed heavy ion density (dotted points) and the model equilibrium solution (solid line) along the Voyager 1 orbit during days 317 and 318 in 1980. The left (right) curve rep- resents the inbound (outbound) orbit. The heavy ion density data is not all available throughout the Voyager 1 encounter, and the model solution agrees reasonably well with the observation data.. Figure 13 The density contours of heavy ions nW (solid lines) in the meridian plane obtained from the equilibrium solution for modeling the Voyager 1 flyby observations of the Saturn’s magnetosphere. The dash-dotted lines show the 16.
(23) computed magnetic field lines and the spacecraft trajectory is plotted as thick solid line. The heavy ion density is fitted along the trajectory and the half thickness of plasma disk is about 1RS inside R = 5RS and is about 1.5 − 2RS in the radial distance beyond 6 RS.. Figure 14 The contours of the azimutal current density J in the meridian plane for modeling the Voyager 1 flyby observations of the Saturn’s magnetosphere. The contours (solid lines) show a thin torus of ring current with half thickness ~ 1.5RS. The dash-dotted lines show the computed magnetic field lines.. 17.
(24) Figure 15 The solid line contours show the distribution of the computed heavy ion beta β in the meridian plane for modeling the Voyager 1 flyby observations of the Saturn’s magnetosphere. The dash-dotted lines show the computed magnetic field lines. The high beta region (β~ 0.6) is confined in |Z| . 1RS between 9 and 18 RS radial distance. The maximum β value of about 1.3 is located at ~ 13 RS. Note that β value decreases rapidly away from this region, which indicates significant latitudinal variation of β. V. Summary and Discussion In summary, we believe we have achieved significant progress in the substorm observations and associated energetic particle injection observed by geosynchronous satellites. Previously we have developed a theory/model that can successfully explain the key observation features in both the ionosphere and the near-Earth plasma sheet region. In the work performed in 2008-2009 fiscal year we further enhanced our substorm research with more detailed observations and modeling. In the future we will continue to perform substorm observations, study energetic particle injection caused by substorms, study the substorm growth phase and onset by investigating more realistic 3D magnetospheric structure in the late growth phase and perform KBI stability calculations with more realistic magnetospheric equilibria. Further theoretical progress to understand the nonlinear consequence of kinetic ballooning instability in the substorm expansion phase will rely 18.
(25) more on realistic simulation including both kinetic physics and global magnetic field and plasma distributions. Thus, we will also consider develop realistic 3D kinetic-fluid simulation code to perform simulations. Finally, of the utmost important is the multi-point and high time-resolution observation of auroal arcs in the ionosphere in 3D, and plasma and magnetic fields in the magnetosphere; they can only be provided by coordinated campaigns involving multi-satellite missions and ground-based observations. Thus, we shall actively pursue international collaborations to obtain more data from either satellite missions or ground-based observations.. 19.
(26) 國立成功大學 國科會計畫出國案報告書. 報告名稱:2009 AGU Fall Meeting 出國期間:2009/12/13-2009/12/21 經費來源: (1)邁向頂尖大學計劃經費(D98-1400)補助機票款及註冊 費。 (2)國科會計劃 NSC 98-2628-M-006-001 補助生活費。 單位:電漿與太空科學中心 職稱:博士生 姓名:張滋芳 聯絡電話:63824 轉 290. 中華民國. 98 年. 12 月. 24. 日.
(27) I. Abstract This is the third time I’ve been to the meeting. In the 2009 AGU Fall meeting, I attended sessions in my areas of interests and communicating with many researchers working in the field of geophysical sciences during the period of time, in San Francisco. Because the meeting covers almost all research topics in Earth and space, I can get exposed to a wide range of intererting region of research. I gave out my poster on the forth day. I described the present study of my research about magnetospheric substorm. Many researchers gave me the importance information about my research and the suggestions about the future work. I will describe the scientific information obtained in the meeting in this report and summarize the suggestions from other researchers during this meeting. II Purpose of Trip The purpose of the trip is to attend the 2009 AGU Fall Meeting III Trip Itinerary 12/13/2008:Depart from Tainan and arrive in San Francisco 12/20/2008:Depart from San Francisco 12/21/2008:Arrive in Taiwan IV. Trip Details.
(28) Through the 10 hours flight, I arrived in San Francisco on Dec. 13, 2009. On Dec. 14, 2009, I arrived in Moscone Center for my registration in the morning. The poster sessions are held in a huge hall which accommodating more than a thousand of posters at the same time in both Moscone North. I gave out my poster in the section of SPA: Magnetospheric Physics on the 4th day. I also go to University of California, Berkeley to attend a THEMIS satellite meeting held at Space Science Lab. in the morning on Dec. 19. I departed from San Francisco on Dec. 20 and arrived in Taiwan in the morning on Dec. 21 in the morning. I chose a few interesting topicss to summarize as follows: Coordinated observations of electron density enhancements in the polar magnetosphere and ion upflows in the polar ionosphere during geomagnetic storms In order to investigate the relationship between the enhancement of electron density in the polar magnetosphere and polar ionosphere, they use the data of electron density form Akebono satellite and.
(29) observations of ion flows in the ionosphere obtained by DMSP-F8 and F9 satellites to perform case study during geomagnetic storm. They found that when electron density enhancements are observed by Akebono satellite in anti-sunward convection regions, ion upflows with large fluxes and intense soft electron precipitations are observed by the DMSP-F9 satellite in and near the latitudinal narrow cusp. Electron densities are highest from the main phase to the early recovery phases in the polar ionosphere. The high electron density sustains for several hours during geomagnetic storm. The regions of enhanced electron density are not localized. It is wide-spread in both noon-midnight and dawn-dusk directions. Because the increases of electron density not only in the polar cusp but also in the auroral zone, the enhancements of electron density can impact on auroral phenomena. On account of above analysis, the results in the study are consistent with the idea that the high-density plasma originates from the cusp ionosphere and drifts into the polar cap due to strong convection during storm time. Hemispheric Asymmetries in substorm recovery time scales This study is to focus on phenomen of substorms near solitice and equinox. They identify substorms when IMAGE FUV and Polar UVI are viewing opposite hemisphere. Pervious works show that the activity of aurora is different in darkness and sunlight. This study show what’s the difference of aurora activity between in darkness and sunlight. Previous study is based on the statistical results. This study investigates individual substorms. For individual substorms, they find recovery time scales are longer in darkness. This is consistent with previous statistical results of asymmetric substorm energy input. It implies ionospheric conductivity plays an.
(30) important role in substorm dynamics. They treat each hemisphere as a separate circuit, each circuit has each resistance, to explore the substom intensifications. Anomalous Enhancement of. Occurrence of the preliminary. impulse of geomagnetic sudden commencement at low latitude in the South Atlantic Anomaly region Sudden commencement on the ground consists of two pulse structures: (1) positive and negative variations in the morning and afternoon sectors of middle and high latitudes. (2) negative and positive variations due to dawn-todusk polar electric field . In this study, they try to propose a possible mechanism of the enhancement of the low-latitude PPI and PRI occurrence in the SAA region, base on modeling. They found that the occurrence distribution of the low-latitude PPI/PRI signatures show that a evident enchacement of the occurrence rate located near the center of the SAA region.The maximum occurrence rate of the PRI reached 80% around noon. The occurrence feature in the SAA region is almost the same as that in the equatorial region. The appearance of the PRI signature in the daytime sector is with high occurrence rate of 40% around noon. This is quite different from publish of previous study. They consider the significant enhancement of the PRI occurrence in the low latitude as an improvement of the magneotmetor accuracy. Comparing the ratios of the PRI amplitude and conductivity deduced from the IRI-2007, MSIS-2000 and IGRF-10 medels, the sudden enhancement of the PRI magnetic signature is caused by a.
(31) significant increase of the ionospheric conductivities on the ambient magnetic field intensity in SAA region. V. Suggestion I’ m glad that I can attend the 2009AGU Fall Meeting. In the report I propose in this meeting, I heard several researcher said that it’s a pity that FORMOSAT-s satellite has only one scientific payload. If it is equipped with particle sensor onboard, the satellite can play an important role in the exploring of ionosphere science. Therefor, I suggest that Taiwan should emphasize the scientific payload when developing a satellite..
(32) 無衍生研發成果推廣資料.
(33) 98 年度專題研究計畫研究成果彙整表 計畫主持人:陳秋榮 計畫編號:98-2628-M-006-001計畫名稱:地球副磁暴現象之物理(3/3) 量化 備註(質 化 說 明:如 數 個 計 畫 本計畫實 實際已達成 預期總達成 際貢獻百 單位 共 同 成 果、成 果 成果項目 列為該期刊之 數(被接受 數(含實際已 分比 達成數) 封 面 故 事 ... 或已發表) 等) 期刊論文 0 0 100% 篇 研究報告/技術報告 0 0 100% 論文著作 研討會論文 3 3 100% 專書 0 0 100% 申請中件數 0 0 100% 專利 件 已獲得件數 0 0 100% 國內 件數 0 0 100% 件 技術移轉 權利金 0 0 100% 千元 碩士生 參與計畫人力 博士生 (本國籍) 博士後研究員 專任助理. 2 1 1 1. 2 1 1 1. 100% 100% 100% 100%. 1 研究報告/技術報告 0 研討會論文 3 專書 0 申請中件數 0 已獲得件數 0. 1 0 3 0 0 0. 100% 100% 100% 100% 100% 100%. 件數. 0. 0. 100%. 件. 權利金. 0. 0. 100%. 千元. 0 0 0 0. 0 0 0 0. 100% 100% 100% 100%. 人次. 期刊論文. 論文著作. 專利 國外 技術移轉. 碩士生 參與計畫人力 博士生 (外國籍) 博士後研究員 專任助理. 人次. 篇 章/本 件.
(34) 1、6 月 27 至 6 月 30 日,主辦國際學術會議「2010 International Space Plasma 其他成果 Symposium (ISPS)」 ,參加人數 70 餘人,外籍學者 40 餘人。 (無法以量化表達之成 2、9 月 8-10 日舉辦國際學術會議「2010 Taiwan-Japan Space Instrument 果如辦理學術活動、獲 Workshop (TJSIW)」 ,共有超過 50 位來自加拿大、日本、韓國及國內太空儀器 得獎項、重要國際合 研究領域的學者師生參與並發表論文。 作、研究成果國際影響 力及其他協助產業技 術發展之具體效益事 項等,請以文字敘述填 列。) 成果項目 科 教 處 計 畫 加 填 項 目. 測驗工具(含質性與量性) 課程/模組 電腦及網路系統或工具 教材 舉辦之活動/競賽 研討會/工作坊 電子報、網站 計畫成果推廣之參與(閱聽)人數. 量化. 0 0 0 0 0 0 0 0. 名稱或內容性質簡述.
(35)
(36) 國科會補助專題研究計畫成果報告自評表 請就研究內容與原計畫相符程度、達成預期目標情況、研究成果之學術或應用價 值(簡要敘述成果所代表之意義、價值、影響或進一步發展之可能性) 、是否適 合在學術期刊發表或申請專利、主要發現或其他有關價值等,作一綜合評估。 1. 請就研究內容與原計畫相符程度、達成預期目標情況作一綜合評估 ■達成目標 □未達成目標(請說明,以 100 字為限) □實驗失敗 □因故實驗中斷 □其他原因 說明: 2. 研究成果在學術期刊發表或申請專利等情形: 論文:■已發表 □未發表之文稿 □撰寫中 □無 專利:□已獲得 □申請中 ■無 技轉:□已技轉 □洽談中 ■無 其他:(以 100 字為限) 3. 請依學術成就、技術創新、社會影響等方面,評估研究成果之學術或應用價 值(簡要敘述成果所代表之意義、價值、影響或進一步發展之可能性)(以 500 字為限) Our reserach helps to understand the physics of substorm that relates magnetospheric dynamics to solar activity and ionospheric coupling. Substorms are the. most. critical. energy. storage. and. release. process. in. the. magnetosphere-ionosphere. This report addresses (1) the observations of substorm events by FORMOSAT-2/ISUAL, ground-based magnetometers, and THEMIS All Sky Imagers, and (2) Dispersionless energetic particle injection..
(37)
數據
+7
![Figure 7 Comparison of results among our relativistic model and non-relativistic model [Zaharia et al., 2000] for the same pulse width parameter Δ 1 = 11000 km and electric amplitude parameter E 0 = 3.65 mV * 9 Re, and electron flux observation by 3 L](https://thumb-ap.123doks.com/thumbv2/9libinfo/9325068.536268/19.892.94.755.183.541/comparison-relativistic-relativistic-zaharia-parameter-amplitude-parameter-observation.webp)

相關文件
The major qualitative benefits identified include: (1) increase of the firms intellectual assets—during the process of organizational knowledge creation, all participants
This research is to integrate PID type fuzzy controller with the Dynamic Sliding Mode Control (DSMC) to make the system more robust to the dead-band as well as the hysteresis
This paper integrates the mechatronics such as: a balance with stylus probe, force actuator, LVT, LVDT, load cell, personal computer, as well as XYZ-stages into a contact-
This project integrates class storage, order batching and routing to do the best planning, and try to compare the performance of routing policy of the Particle Swarm
由於本計畫之主要目的在於依據 ITeS 傳遞模式建構 IPTV 之服務品質評估量表,並藉由決
As for current situation and characteristics of coastal area in Hisn-Chu City, the coefficients of every objective function are derived, and the objective functions of
Subsequently, the relationship study about quality management culture, quality consciousness, service behavior and two type performances (subjective performance and relative
Ogus, A.,2001, Regulatory Institutions and Structure, working paper No.4, Centre on Regulation and Competition, Institute for Development Policy and Management, University
