國立臺灣大學生命科學院生化科技學系 碩士論文
Department of Biochemical Science and Technology College of Life Science
National Taiwan University Master Thesis
從菸草毛狀根之型態與轉錄體探討根毛農桿菌 rol 基因之功能
Functional exploration of Agrobacterium rhizogenes rol genes by morphological and transcriptomic
analyses of tobacco hairy roots
林筱涵 Hsiao-Han Lin
指導教授:李昆達 博士 Advisor: Kung-Ta Lee, Ph.D.
中華民國 101 年 7 月
July 2012
口試委員會審定書
謝誌
四年的時間,一轉眼就過了。感謝 李昆達老師,願意給當年仍升大三的我一
個機會,進入發酵實驗室學習。從一開始連滅菌指示膠帶都不認識的我,經過眾 多學長姊的教導與鼓勵,有了今天的研究成果。謝謝老師!我由衷感激您。
感謝 劉啟德老師的耐心聆聽、及細心的指導,讓我無論是在試驗設計、實驗
過程、或結果分析都能想的更加透徹、仔細。在論文撰寫的過程中,也得到您許 多寶貴的意見。謝謝您。
除了上述兩位恩師,在本篇撰寫的過程中,還得到許多人的幫助,分述如下。
首先,要感謝 劉力瑜老師慷慨地提供生物統計、 R 程式、以及試驗設計的相關 諮詢,讓相關數據的生物意義得以彰顯。感謝生科院 TechComm 提供豐富的軟、
硬體資源,讓實驗進行順利不少。在論文撰寫初期,要感謝臺大寫作中心 陳巧玲 的指導,讓我對於論文寫作有完整的了解與寶貴的學習經驗。還要感謝 鄭秋萍老 師、 常怡雍老師、以及 楊健志老師對本篇論文提供的意見與指教,讓本篇論文 更加完備。感謝各位老師的教導,筱涵由衷感激。
在研究的過程中,我要特別感謝不辭勞苦分擔菸草種植、毛狀根繼代、以及
算根長的大中;以及無論是在試驗設計、文獻探討、結果分析及討論都讓我獲益 良多的的榮顥。除了上述兩位,我也要感謝發酵實驗室的大家:派派、小宏、阿 蘇、松輝、以則、獻仁、大仔、舒晴、鏡介、子耕、小畢、念杰、威霆…。離開 後,我必然想念那些與各位一起度過的美好日子。我想念那些吃飯兼散步的悠閒 時光,那些在植物室待到天荒地老都繼代不完的無奈時光,那些要討論實驗卻不 知不覺聊起天來的莫名時光,那些在上臺報告前三天的焦慮時光,那些在抽 RNA 時大家都退避三舍的驚恐時光,那些直到半夜學生卻不准我們下班的苦命應微助 教時光…。因為有你們,在發酵實驗室的日子顯得如此多采多姿。謝謝你們!
最後,要感謝我的家人們。感謝你們從小到大的呵護、栽培、教導、與陪伴。
因為有你們,才有今日的我。
筱涵謹誌於
國立臺灣大學生化科技學系暨研究所 中華民國一零一年七月
摘要
毛狀根 (hairy root) 是根毛農桿菌 (Agrobacterium rhizogenes) 感染植物後誘 發生成的癌化組織,此組織被視為是最有潛力的植物次級代謝物生產工廠。文獻 指出根毛農桿菌 Ri 質體上的 rol 基因群 (rolA 、 rolB 、 rolC 以及 rolD) 會
影響毛狀根的生成。然而,尚未有文獻報導 rol 基因群如何影響毛狀根形態,以
及這些基因影響的植物生理機能。因此,本研究利用根毛農桿菌野生型及 rol 基
因缺陷株感染菸草,分析所生成的毛狀根在形態以及轉錄體學之差別。形態調查
結果顯示, rolB / rolC 根毛農桿菌缺陷株在毛狀根誘導率及外表型上與野生型有
顯著差異,而 rolA / rolD 的影響不大。轉錄體分析 rolB / rolC 缺陷毛狀根與野生
型毛狀根的結果顯示: RolB 蛋白質可能對於菸草毛狀根的脂質運送、細胞胺基
酸相關生合成路徑、創傷反應、以及乙烯刺激反應具有正向調控功能; RolC 蛋
白質則對於創傷反應、化學刺激反應、醣類代謝、以及脂質運送具有正向調控功
能。上述結果揭示了 rolB / rolC 如何影響毛狀根形態,以及它們在毛狀根組織中
所參與的生理機能。
關鍵字:毛狀根、 rol 基因群、根毛農桿菌、菸草、轉錄體分析
Abstract
Hairy root is the tumorized tissue induced when Agrobacterium rhizogenes infects plants, and is considered as the most powerful plant secondary metabolites-producing system. The formation of hairy root have been known to related to four root inducing (rol) genes rolA, rolB, rolC, and rolD that lie in the transferred DNA (T-DNA) of A.
rhizogenes root inducing (Ri) plasmid. However, no studies showed how these rol genes affect hairy root architecture. Also, there is no comprehensive –omics information of how plant cell is manipulated by the rol genes. Therefore, this study tried to answer these questions by morphological and transcriptomic analysis of tobacco hairy root induced by wild type and rol deletion mutant of A. rhizogenes. Morphological analysis revealed that lacking rolB and rolC cause impaired hairy root syndrome, while lacking rolA and rolD had little or no effects. Transcriptomic comparison of rolB / rolC deleted hairy roots compared with that of wild type indicate that RolB may positively regulate lipid transport, cellular amino acid derivative biosynthesis process, response to wounding, and response to ethylene stimulus. Meanwhile, the biological processes that may be positively regulated by RolC are response to wounding, response to chemical stimulus, carbohydrate metabolic process, and lipid transport. The results revealed how rolB and rolC affect hairy root morphology and what are the corresponding biological processes they manipulated.
Keywords: hairy root, rol genes, A. rhizogenes, N. tabacum, transcriptomic analysis
Abbreviations
MS medium Murashige and Skoog medium½ MS+Ce Half strength MS medium supplied with 300 ppm cefotaxime W38 N. tabacum L. cv. Wisconsin 38
WTA4 Wild type A. rhizogenes strain A4 ΔrolA rolA deleted A. rhizogenes strain A4 ΔrolB rolB deleted A. rhizogenes strain A4 ΔrolC rolC deleted A. rhizogenes strain A4 ΔrolD rolD deleted A. rhizogenes strain A4
HR WT Hairy root induced by wild type A. rhizogenes strain A4 HR ΔrolA Hairy root induced by rolA deleted A. rhizogenes strain A4 HR ΔrolB Hairy root induced by rolB deleted A. rhizogenes strain A4 HR ΔrolC Hairy root induced by rolC deleted A. rhizogenes strain A4 HR ΔrolD Hairy root induced by rolD deleted A. rhizogenes strain A4
DPI Days post infection
DREPI Days of the first root emergence post infection RL ratio The primary hairy root number per leaf disc
MRL Main root length
BRN Branch root number
TBRL Total branch root length
BRD Branch root density (cm-1)
GO Gene ontology
qRT-PCR Quantitative real time-polymerase chain reaction
Contents
口試委員會審定書 ... i
謝誌 ... ii
摘要 ... iii
Abstract ... iv
Chapter 1. Introduction ... 5
1.1
Aim of research ... 5
1.2
General backgrounds of hairy root ... 5
1.3
RolA ... 8
1.4
RolB ... 10
1.5
RolC ... 12
1.6
RolD ... 14
1.7
Research strategies ... 15
Chapter 2. Materials and Methods ... 17
2.1
Plant materials and growth conditions ... 17
2.2
Bacteria and growth conditions ... 17
2.3
Genotype confirmation for A. rhizogenes strain A4 derivatives ... 18
2.4
Hairy root induction ... 18
2.5
Hairy root initiation test ... 19
2.6
Hairy root genotype confirmation ... 20
2.7
Analysis of hairy root architectures ... 20
2.8
Statistical analysis ... 21
2.9
RNA extraction ... 22
2.10
Microarray labeling, scanning, and data extracting ... 23
2.11
Gene ontology of microarray data ... 23
2.12
qRT-PCR ... 24
Chapter 3. Results ... 26
3.1
Genotype confirmation of rol gene-deficient A. rhizogenes strain A4 ... 26
3.2
Tobacco infection by A. rhizogenes strain A4 and its derivatives ... 26
3.3
Confirmation of hairy root genotype ... 27
3.4
Hairy root initiation test ... 28
3.5
Measurements of hairy root architecture ... 29
3.6
Microarray Data Analysis ... 32
3.7
Gene ontology of HR D rolB down-regulated genes ... 33
3.8
Gene Ontology of HR D rolC down-regulated genes ... 33
3.9
qRT-PCR Analysis of the Gene Ontology-extracted genes ... 34
Chapter 4. Discussions ... 36
4.1
rolB and rolC play crucial roles in hairy root initiation ... 364.2
rolB and rolC affect hairy root architecture more drastically ... 364.3
Difficult maintenance of the HR D rolB and HR D rolC clones ... 37
4.4
Comparison between the microarray and qRT-PCR analyses ... 38
4.5
Biological processes manipulated in the absence of rolB ... 38
4.6
Biological processes manipulated in the absence of rolC ... 40
4.7
Deduced biological functions of rolB ... 41
4.8
Deduced biological functions of rolC ... 42
Chapter 5. Conclusion ... 44
Tables ... 45
Figures ... 63
References ... 84
Appendix ... 91
List of Figures
Figure 1-1. Hairy root……….63
Figure 1-2. A. rhizogenes under microscope………..64
Figure 1-3. Molecular mechanisms of how A. rhizogenes infects plant cell………..…65
Figure 1-4. The TL-DNA region of A. rhizogenes strain A4……….66
Figure 2-1. Target region of the pK18HRrol check primers……….….67
Figure 2-2. Measuring hairy root architecture………....68
Figure 2-3. Explanation of Gene Ontology diagram………..69
Figure 3-1. Genotype confirmation of A. rhizogenes strain A4 and its derivatives.…..70
Figure 3-2. Growth curve of wild type and the rol gene-deficient A. rhizogenes strain A4……….…….…..…..71
Figure 3-3. Confirmation of hairy root genotype….……….….….…72
Figure 3-4. Phenotypes of A. rhizogenes A4 and its derivatives-infected tobacco leaf discs at 21 dpi……….……….……..…73
Figure 3-5. Days to the first root emergence post induction (DREPI)………..…..……74
Figure 3-6. Primary root number per leaf disc (RL ratio) at 21 dpi…………..….….…75
Figure 3-7. Selected hairy root appearances after 18 days post sub-culturing…………76
Figure 3-8. Main root length of A. rhizogenes A4 and its rol gene-deficient derivatives……….77
Figure 3-9. Branch root number of A. rhizogenes A4 and its rol gene-deficient derivatives……….78
Figure 3-10. Total branch root length of A. rhizogenes A4 and its rol gene-deficient derivatives……….79
Figure 3-11. Branch root density of A. rhizogenes A4 and its rol gene-deficient derivatives……….80
Figure 3-12. The constitutive expressed gene under 2-fold cut off………81
Figure 3-13. Gene ontology of HR ΔrolB down-regulated genes………..82
Figure 3-14. Gene ontology of HR ΔrolC down-regulated genes…..………83
List of Tables
Table 2-1. Primers used for genotype confirmation. ... 45
Table 2-2. Primers used for qRT-PCR test ... 46
Table 3-1. Numbers of differentially expressed genes analyzed by microarray. ... 49
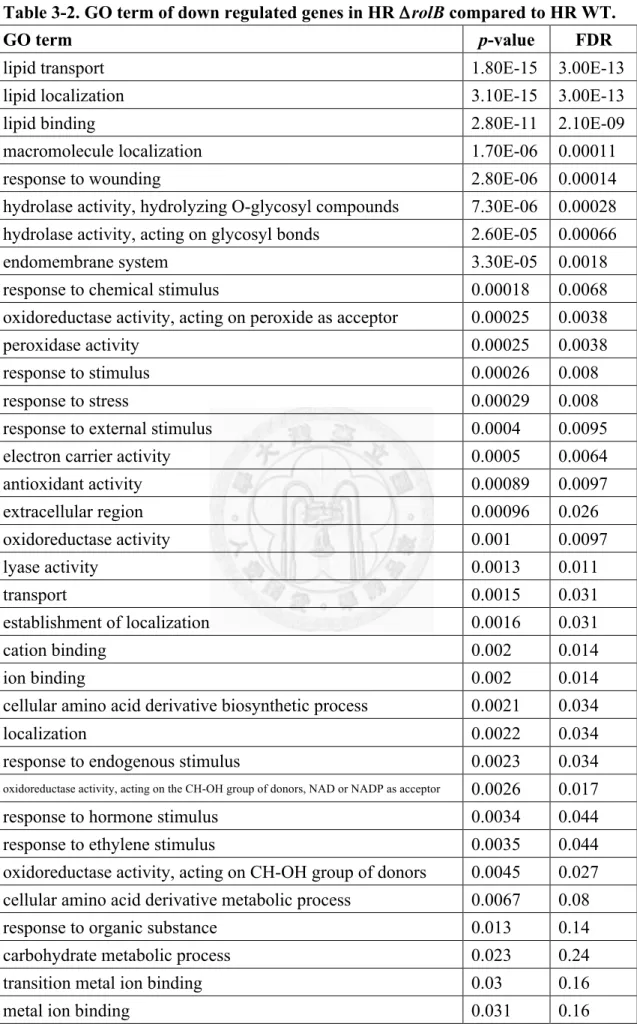
Table 3-2. GO term of down regulated genes in HR ΔrolB compared to HR WT. ... 50
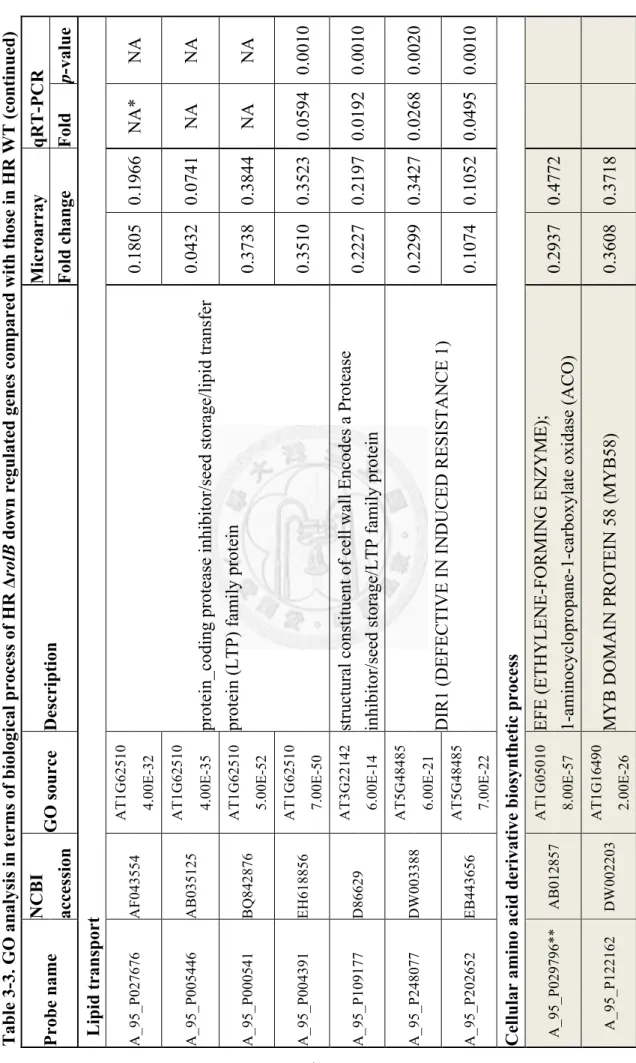
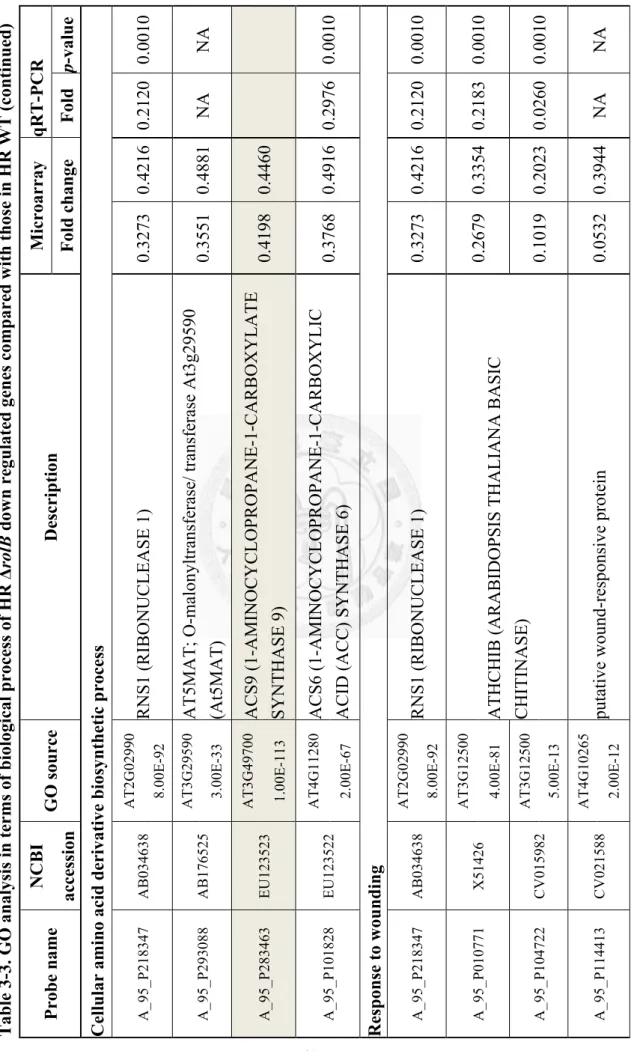
Table 3-3. GO analysis in terms of biological process of HR ΔrolB down regulated genes compared with those in HR WT. ... 51
Table 3-4. GO results of HR D rolC down regulated genes compared to HR WT. ... 56
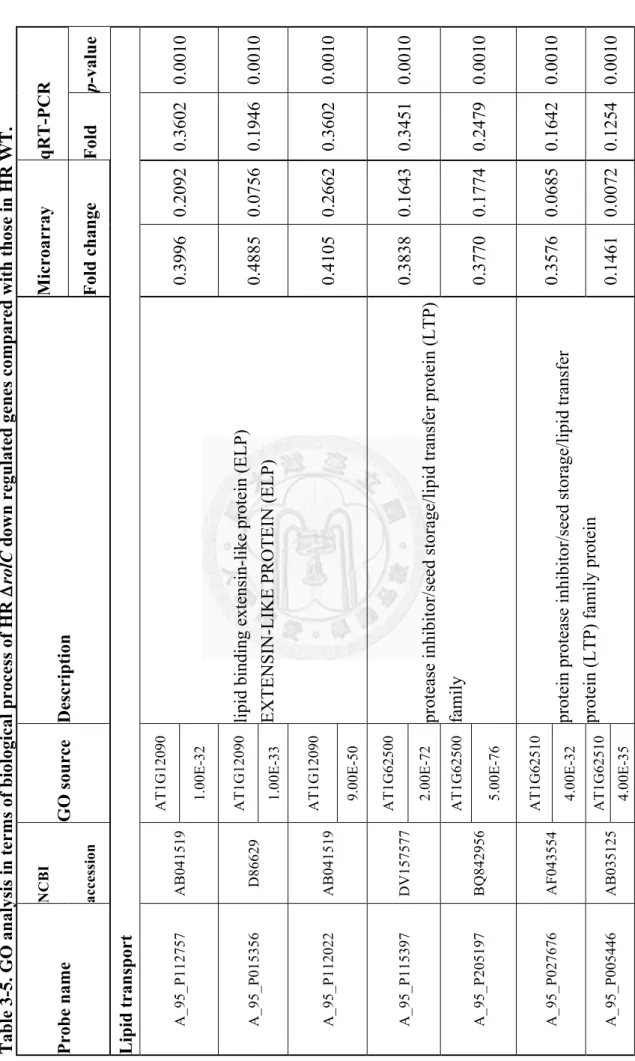
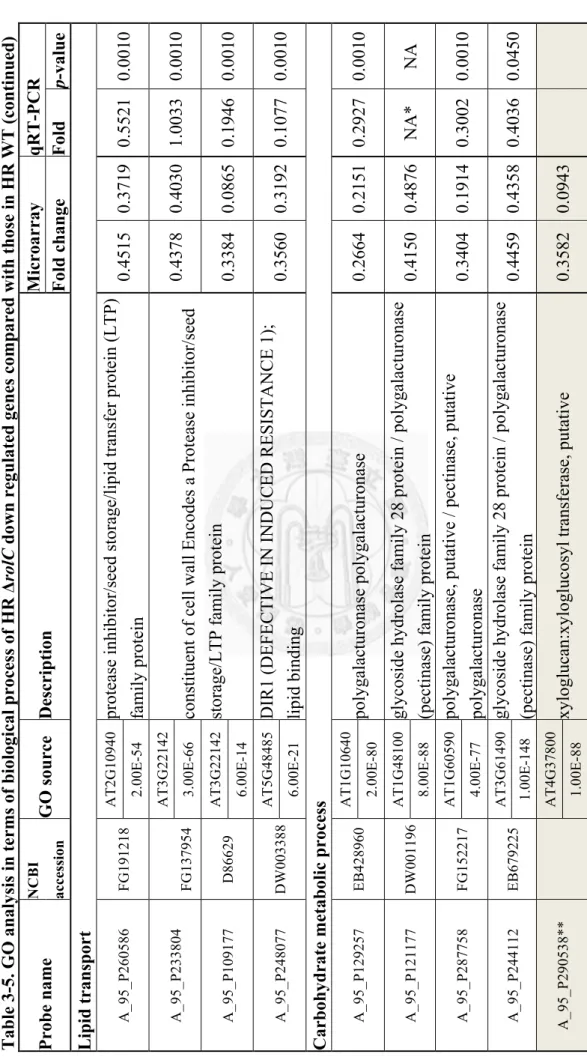
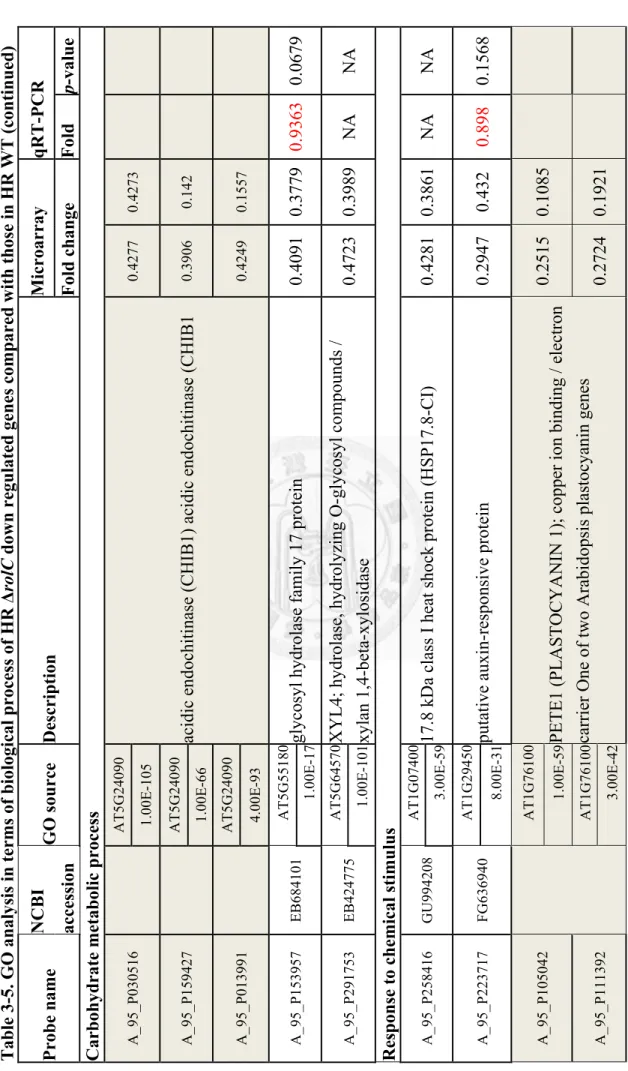
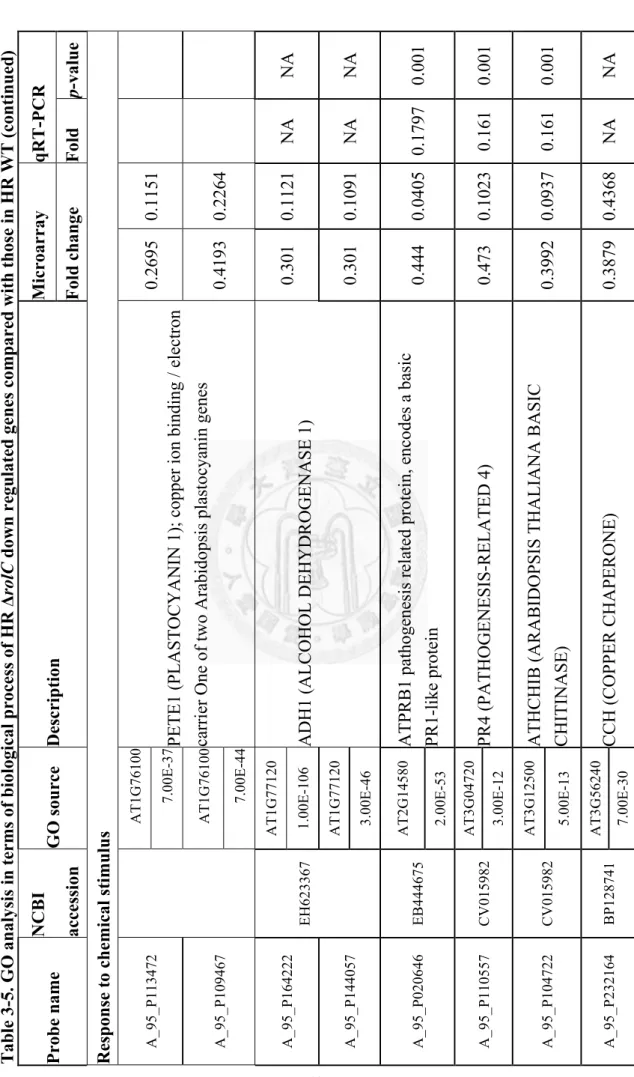
Table 3-5. GO analysis in terms of biological process of HR D rolC down regulated genes compared with those in HR WT. ... 57
Chapter 1. Introduction
1.1 Aim of research
Hairy root is considered as the most powerful plant secondary metabolites- producing system because of its hormone-free culturing ability, high-level secondary metabolites production, and short-term biomass accumulation (Bulgakov, 2008; Ono and Tian, 2011; Banerjee et al., 2012). The formation of hairy root have been known to be related to four root inducing (rol) genes rolA, rolB, rolC, and rolD that lie in the transferred DNA (T-DNA) of Agrobacterium rhizogenes (Bulgakov, 2008; Welander and Zhu, 2010). However, the biological functions of rolA, rolB, and rolC remains unclear to date, despite that they had been discovered since 1985 (White et al., 1985) and that many papers aimed to uncover their biological functions (Estruch et al., 1991;
Estruch et al., 1991; Filippini et al., 1996). In order to unveil the biological functions rol genes have in hairy root, we aimed to understand the biological process changed in the absence of single rol genes in a comprehensive way. We hope this will shed light on the rol genes’ biological function research and / or improve hairy root plant secondary
metabolite producing system. Therefore, this study used microarray technology to comprehensively analysis the biological process changes in the presence / absence of single rol genes.
1.2 General backgrounds of hairy root
Hairy root (Fig. 1-1b, c, and d) is an ectopic plant tissue emerged after Agrobacterium rhizogenes (Fig. 1-2) infecting plant (Fig. 1-1a). It was first known as a
plant disease in apple trees in the 1930s (Riker et al., 1930). Thereafter, hairy root has also been found in many dicot plants, but not in the monocots, and is viewed as a plant
disease (Ark and Thompson, 1961). In the 1980s, two unique characters of hairy root system were discovered. First, it can grow in the absence of exogenous phytohormones (Spano et al., 1981). Second, plant secondary metabolites were observed to be accumulated in high levels in the ectopic root tissue of Beta vulgaris and Nicotiana rustica, respectively (Hamill et al., 1986). In addition to these two unique characters,
the fast growing, easy transforming, and long-term stability in transgenic lines make it a perfect system for producing valuable plant secondary metabolites (Toivonen, 1993;
Bulgakov, 2008; Ono and Tian, 2011). Therefore, hairy root system is no only referred to as a plant disease, but also as a promising plant factory that produces massive valuable secondary metabolites.
There have been many successful cases of using hairy root system as a plant secondary metabolites factory. For example, the production of resveratrol, an anti-carcinogen compound, was increased more than 100-fold in grape (Vitis amurensis Rupr.) hairy root than in normal culture (Kiselev et al., 2007). Another well-established example is the anti-apoptosis compound, gensenoside, produced by ginseng. By using the hairy root system, the yield of gesenoside was three times more than that of normal ginseng (Bulgakov et al., 1998). Taxol is a famous anti-cancer compound, produced from pacific yew tree (Taxus brevifolia). By using Hairy root system, the production of taxol was 210-fold more than that of normal yew tree (Furmanowa and Syklowska-Baranek, 2000; Kim et al., 2009). Recently, hairy root system has also been used in producing valuable recombinant proteins. Human secreted alkaline phosphatase (Gaume et al., 2003), mucosal adjuvant Ricin B (Gaume et al., 2003), and liver enzyme mammalian P450 2E1 protein (Banerjee et al., 2002) are some of the examples. Thus, hairy root system is a powerful factory not only of plant secondary metabolites but also of valuable recombinant proteins.
Molecules responsible for hairy root emergence after A. rhizogenes infection were studied in the 1980s. In 1980, White and Nester showed that the virulent trait of A.
rhizogenes lie in its large plasmids rather than its chromosome. The plasmids were
denoted pRi for their root inducing capacity (White and Nester, 1980) (Fig. 1-3).
Further studies showed that fragments of DNA designate transferred DNA (T-DNA) in the large plasmid are responsible for the ectopic hairy root phenotype (White et al., 1982) (Fig. 1-3 green bar). During A. rhizogenes infection, the T-DNAs are delivered into plant nucleus and integrated into its chromosome (Slightom et al., 1985) (Fig. 1-3 green bar in the gray circle). After the infection, the genes on the T-DNAs start to function in the infected plant cell (White and Nester, 1980; White et al., 1985). These plant cell-expressed T-DNA genes turn the transformed plant cell into ectopic root (Taylor et al., 1985). The T-DNA harboring root tissue is capable of regeneration into a whole plant when external phytohormones were added (Ooms et al., 1986). The plant regenerated from T-DNA transformed hairy root is termed regenerated plant.
The most commonly studied strain of A. rhizogenes is strain A4. It has two T-DNAs designated as TL-DNA and TR-DNA (Huffman et al., 1984; Taylor et al., 1985) (Fig. 1-3 the two green bars on Ri plasmid). During infection, the two T-DNAs insert into plant chromosomes independently (Vilaine and Cassedelbart, 1987). Studies showed that both T-DNA regions are able to transform plant cell into hairy root separately, but they work more efficient when both exist (White et al., 1985; Vilaine and Cassedelbart, 1987). TR-DNA is known to share homologous with tumor-inducing plasmid (pTi) of Agrobacterium tumefaciens (White et al., 1985). Thus, the molecular mechanism of how it manipulates plant cell is better understood. On the other hand, no homologous sequence is found in TL-DNA and T-DNA region of pTi. Therefore, TL-DNA is of particular interest. By using genetic and molecular analysis, four genes in
the TL-DNA were shown to play crucial roles in hairy root formation. The four root loci (rol) were named rolA, rolB, rolC, and rolD, respectively (Fig. 1-4) (White et al., 1985).
Following briefly summarize findings about the four genes.
1.3 RolA
rolA is a 303 bp, no-intron gene (GenBank: K03313.1, X12579.1). Its protein contains 100 amino acids and is a basic protein (isoeletric point = 11.2) (UniProtKB/Swiss-Prot: P11888) (Slightom et al., 1986; Levesque et al., 1988). RolA was discovered through morphological observation of Kalanchoe diagremontiana hairy roots induced by A. rhizogenes Tn-5 inserting mutant (White et al., 1985). The Tn-5 inserting-rolA mutant (rolA interrupted mutant) induces hyper-hairy roots with longer root length when comparing to wild type A. rhizogenes-induced ones. On the other hand, morphological differences of regenerated plants that induced by rolA-transformed hairy roots of bittersweet (Solanum dulcamara L.) and tomato (Lycopersicon esculentum Mill.) were also reported (McInnes et al., 1991; Van Altvorst et al., 1992). These plants all exhibited shorter plant height, reduced internode length, extensive wrinkle leaves, retard flowering time and severe male infertility. In order to understand how and why one gene was capable to cause the massive changes in plant morphologies, studies had been focusd on its spatial and temperal regulations in regenerate plant (Sun et al., 1991;
Van Altvorst et al., 1992; Armando Aguado-Santacruz et al., 2009).
Promoter region of rolA, which spans 638 bp upstream of its translation start site, has been studied extensively (Carneiro and Vilaine, 1993; Guivarch et al., 1996). When rolA was expressed under the control of its full-length promoter, it was expressed
throughout the whole regenerated plant in vegetative stage with all the chimeric phenotypes, like wrinkle leaves and reduced internode. Moreover, when leaf discs of the
regenerate plants were cut and put on hormone-free medium, roots form spontaneously (Guivarch et al., 1996). However, when -638 to -473 region was deleted, the spontaneous root formation disappears and rolA was expressed only in companion cells of the phloem. Therefore, this region is thought to comprise of tissue-type regulation (Guivarch et al., 1996). When rolA promoter region was further deleted from -638 to -336, wrinkle leaves and reduced root phenomenon of the regenerated plant vanished.
This indicates that -473 to -336 is responsible for the two phenotypes (Carneiro and Vilaine, 1993). Deletion of rolA promoter from -638 to -200 results in significantly reduced rolA expression in leaves and low expression in stem phloem. Nevertheless, the low expression in stem was still sufficient to inhibit internode elongation. Therefore, region -336 to -200 consists of phloem-specific elements and is able to alter stem morphology (Guivarch et al., 1996). The 100 bp upstream of rolA translation start site shows an unexpected character: the prokaryotic origin nucleotides are recognized by eukaryotic plant cell and spliced out in the mRNA level (Xue et al., 2008). As qRT-PCR results indicated, plant cells recognize the 3’AG (at position -3) and 5’GT (position -73, and -76 respectively) sites of the pre-rolA mRNA and spliced it out to make a mature one (Xue et al., 2008). The mature rolA mRNA is important to produce functional RolA protein since the in vitro test showed that the translation of pre-rolA mRNA was at least 10-20 times weaker than that of the mature one. Moreover, 3’AG mutant is a null mutant that did not show ectopic morphology in Arabdopsis (Magrelli et al., 1994). In conclusion, rolA promoter controls not only the tissue specific expression but also the chimeric morphology of the regenerated plant.
On the other hand, mRNA levels as well as protein functions of rolA have also been studied. The mRNA level of rolA had the highest level in stem and this content was more than five and fifty times in leaves and in roots, respectively (Carneiro and
Vilaine, 1993). These data consist with the fact that the -336 to -200 promoter region of rolA controls the gene in a stem-specific manner (Carneiro and Vilaine, 1993). The
protein product of rolA mRNA is a 100 amino acids with molecular weight of 11.4 kDa.
Also, amino acid sequence analysis indicated that RolA protein is a basic protein with isoelectric point of 11.2 (Slightom et al., 1986; Levesque et al., 1988). The basic nature of RolA leads to the hypothesis that it may harbor DNA binding capacity (Rigden and Carneiro, 1999). This hypothesis was strengthened by the fact that RolA structure adopts the papillomavirus E2 DNA-binding domain by computer simulation model (Rigden and Carneiro, 1999). If RolA is really a DNA-binding protein, it is expected to localize in the nuclei. However, the product of RolA::GUS fusion protein showed the GUS activity was highest in microsomes and plasmamembrane region but low in nuclei (Vilaine et al., 1998). Moreover, no studies have found nuclear localization signals in RolA sequence. Therefore, whether RolA protein is a DNA-binding protein as well as its biological function remains to be elucidated.
1.4 RolB
Gene rolB is 780 bp long, and its protein product contains 259 amino acids (GenBank: K03313.1, UniProtKB/Swiss-Prot: P20402). It shares homology with RolB in TR-DNA (the two gene have the same name because of the homology) (UniProtKB/Swiss-Prot: P15397).
Among all the rol genes, rolB affects hairy root morphology most dramatically in many plants. In K. diagremontiana, the Tn5-interrupted rolB mutant resulted in avirulent trait (White et al., 1985). Tobacco harboring 35S rolB itself was sufficient to induce hairy root syndrome, which confirms the crucial role of rolB (Cardarelli et al., 1987). In transgenic plants, rolB stimulateed the formation of flower and root
meristemoids in tobacco thin cell-layers (Capone et al., 1989; Altamura et al., 1994).
The meristomoid development has been known to be regulated by auxin (De Smet et al., 2007). Therefore, rolB is suggested to be involved in auxin homeostasis (Capone et al., 1989). This hypothesis is strengthen by the fact that the promoter region of rolB was induced by auxin (Maurel et al., 1990). Besides the auxin-induced character, rolB promoter has many other intriguing traits. First, the promoter was active not only in the central cylinder of regenerate embryo but also all types of meristem in the regenerated tobacco and regenerated carrot (Capone et al., 1989; Schmulling et al., 1989; Altamura et al., 1991). Second, its expression was organ-specific. The expressing level of the rolB promoter was high to low in the order of stem, root and leaf, respectively (Capone et al., 1989; Chichiricco et al., 1992). Third, each promoter fragment of the rolB, defined by restriction sites, harbors different functions. For example, fragment -623 to -471 enables the downstream gene to express in root cap and protoderm. Deletion of this fragment largely reduced expressing level of the reporter gene (Capone et al., 1994). Fragment -341 to -306 is crucial for the promoter activation and defines the expression in root tip and meristem of vascular tissue. Another example is fragment -218 to -158. Deletion of this region results not only in the vanish signal in vascular meristamatic cells but also in express signal in protoderm. The deletion of fragment -158 to -85 where deletion of this fragment causes vanish expressing signals in dermatocalyptogen and cortex (Capone et al., 1994).
Aside from the promoter region of rolB, its biological function has also gained a lot of research interest. Reflecting the fact that promoter rolB is induced by auxin and that rolB may be involved in auxin homeostasis, investigation of the biological function of rolB have been focused on its relationship with auxin. The protein product of rolB was first suggested to be a 3-glucosidase which can release IAA (indole-3-acetic acid),
one kind of active auxin, from IAA-beta-glucoside (indole-3-acetyl-beta-glucoside) (Estruch et al., 1991). This point of view was supported by the observation that higher IAA and lower GA content were found in protein RolB-expressing anther (Spena et al., 1992). Nevertheless, further study showed that neither endogenous free IAA pool, nor the rate of IAA biosynthesis and metabolism were altered in rolB-transformed tobacco (Nilsson et al., 1993; Schmülling et al., 1993). In addition, the morphology of rolB-expressing transgenic tobacco did not resemble that of IAA overproduction ones
(Nilsson et al., 1993). Therefore, the hypothesis that protein RolB is a 3-glucosidase which release free auxin in plant cell is not likely to be true. Though it may not play a role in either active auxin release or auxin biosynthesis or metabolism, RolB could instead affects auxin transportation. This is supported by the fact that protein RolB not only is found in the plasma membrane but also increases the amount of auxin binding to tobacco plasma membrane (Filippini et al., 1994; Filippini et al., 1996). Furthermore, protein RolB was shown to possess tyrosine phosphatase activity when purified exogenously from E. coli (Filippini et al., 1996). Thus, it is suggested that RolB affects auxin transportation through the kinase / phosphatase cascade signal transduction (Filippini et al., 1996). However, the study did not show the tyrosine phosphatase activity of RolB in vivo. Thus, whether rolB functions as a tyrosine phosphatase in plant cell remains to be elucidated.
1.5 RolC
RolC is a 543 bp gene (GenBank: K03313.1). Its protein is 20 kDa and contains
180 amino acids (UniProtKB/Swiss-Prot: P20403). Hairy root induced from K.
kiagremontiana by Tn5-interrrupted rolC mutant A. rhizogenes shows attenuate growth
after initiation (White et al., 1985). Regenerated tobacco harboring rolC under its own
promoter show short plant height, reduced apical dominance, early flowering time, small size flower, and poor pollen production (Schmulling et al., 1988). Like other rol genes discussed above, rolC alone affects plants’ morphology drastically. Thus, many studies have been conducted to determine its biological functions.
Studies of the rolC promoter can be divided into two parts. One is the regulatory mechanism of the rolC promoter; another is the plant nucleus proteins capable of binding to the promoter region of rolC. Promoter analysis using GUS as a reporter in regenerate tobacco showed that rolC promoter is phloem- and root- specific (Schmulling et al., 1989; Sugaya et al., 1989). A further study demonstrated that the promoter region was responsible for phloem-specific expression lies within -153 to +1 (Sugaya and Uchimiya, 1992). Moreover, the -135 to -94 region of the rolC promoter, which overlaps with phloem-specific region, is also induced by sucrose (Yokoyama et al., 1994). Since high levels of sucrose is likely to be found in the phloem, it will be interesting to know the correlation between rolC expression and sucrose concentration.
On the other hand, multiple plant proteins were found to be capable of binding to rolC promoter. These plant proteins include the 43 kDa, RCS2 protein
(rolC ssDNA-binding protein 2)
, AII protein and BI protein (Matsuki and Uchimiya, 1994;Fujii, 1997). The latter two were shown to bind from -203 to -92. Still another protein, protein Ava S, was found to interact with rolC promoter. However, Ava S only bound to single strand DNA of the promoter from -94 to +23 (Suzuki et al., 1992).
Attempts to find the biological functions of RolC have not been succeed.
RolC-specific antibody experiments demonstrated that it lies in the soluble, cytosolic fraction of the transgenic cells (Estruch et al., 1991; Oono et al., 1991). In 1991, Estruch et al. demonstrated that RolC harbors cytokinin-beta-glucosidase activity in vitro using recombinant protein system (Estruch et al., 1991). This indicates that plant morphology
affected by RolC may be due to the fact that more active cytokinin was produced.
However, attempts to confirm this idea in vivo had shown contradictory results. Nilsson and coworker found that the cytokinin levels were low in RolC-expressing tobacco cell, whereas abscisic acid levels were high (Nilsson et al., 1993). Faiss et al. (1996) also found that the free cytokinins level did not change in any tissue and they did not observe cytokinin-beta-glucosidase activities of RolC as well (Faiss et al., 1996). Thus, the biological function of RolC remains unknown to date.
1.6 RolD
Gene rolD is a 1035 bp gene (GenBank: K03313.1). Its protein contains 344
amino acids and served as a
NAD+-dependent ornithine cyclodeaminase in pRi1855 (Trovato et al., 2001). RolD was first characterized as the Tn5-interrupted rolD mutant induced retarded hairy root growth and increase callus phenotype in K. kiagremontiana (White et al., 1985). Afterward, the effect of rolD in hairy root initiation in tobacco was also studied. Surprisingly, rolD was found not necessary for hairy root induction in tobacco system (Vilaine and Cassedelbart, 1987). Therefore, whether rolD is required for virulence seems to be plant species-dependent. Interestingly, though not obligate for hairy root initiation, regenerate tobacco harboring rolD shows early flowering followed (at the stage of 10-11 internodes) by rapid growth of numerous lateral inflorescences (Mauro et al., 1996). Adventitious root meristem was also increased in rolD expressing A. thaliana (Falasca et al., 2010).Due to the effects rolD have on root meristem, studies have investigated its promoter region. Shorten rolD promoter (-325 to -1) was shown to exhibit root-specific expressing pattern in regenerate tobacco (Leach and Aoyagi, 1991). This is further confirmed by the fact that the ratio of root to leaf expressing level of mature regenerate
tobacco is 28 and 24 when using -1271 to -1 (full length) and -426 to -1, respectively (Elmayan and Tepfer, 1995). Since then, the -325 to -1 region of rolD has been used as a root-specific promoter (Kamo, 2003; Tamot et al., 2003; Jayaraj et al., 2008).
The protein function of rolD is also characterized. Trovato et al. found that the protein product of rolD is a NAD+-dependent ornithine cyclodeaminase, an enzyme that converts ornithine to proline (Trovato et al., 2001). Proline accumulation may be a defense response connected to biotic and abiotic stresses (Mauro et al., 1996; Trovato et al., 2001). Therefore, it will be interesting to know whether this defense response is really altered in hairy root induced by rolD deficient mutant.
1.7 Research strategies
As mentioned above, only rolD gene has known functions so far; protein product of rolA, rolB, and rolC still remain poorly understood. Considering their crucial role in hairy root formation, and the potential of hairy root for the production of secondary metabolites, unveiling the functions the rol genes have in hairy root will give a fundamental progress to plants as well as bacteria biology.
From our literature review, it is surprising that although many attempts have been made to elucidate rol genes’ function, few of them chose hairy root system as their model. On the contrary, most of them used regenerate plants as their targets. Also, most previous studies that used hairy root as their material focused on hairy root initiation rather than the architecture of hairy root. Since hairy root have been view as the most powerful plant secondary metabolites-producing system, understanding how rol genes affect hairy root architecture may provide new insights of how to improve the quantity of the hairy root tissue. Moreover, researchers have turned their interest into single clone, high quantity secondary metabolite production for the past decade (Bulgakov,
2008; Ono and Tian, 2011), when many comprehensive analyses, the -omics data, became mature. This leads to poor comprehensive information of how plant cell is manipulated by the rol genes, and hindered the elucidation of the rol genes’ biological function.
Therefore, this study focused on hairy root system induced by rol gene-deficient A.
rhizogenes rather than the regenerate plant induced from it. Starting from morphological
differences analysis, attempts were made to elucidate how individual rol genes affect hairy root architectures. Then, microarray and qRT-PCR technology was used to identify how plant genes were manipulated by individual rol gene. Combining morphological and gene expression data, the underlying molecule mechanisms of how individual rol genes affect plant cell were discussed. We hope that by these data, the biological functions of the rol genes can be better understood.
Chapter 2. Materials and Methods
2.1 Plant materials and growth conditions
Nicotiana tabacum L. cv. Wisconsin 38 was used in this study. The seeds were
surface sterilized by 70% (v/v) ethanol once followed by washing with sterilized water three times. Then, 1% sodium hypochlorite containing 0.01% Tween-20 was used to further surface sterilize the seed once followed by washing with sterilized water until no surfactant remained. The surface-sterile seeds were deposited onto ½ MS plate (half-strength Murashige and Skoog medium containing 3% sucrose, pH 5.8 (adjusted by KOH), and 0.3% (w/v) phytagel). The seeds were grown under 22 oC,
400 µmoles/m
2/s
light intensity with 14 h light / 10 h dark photoperiod for 3 weeks.Afterward, the young plants were transferred onto ½ MS containing-107 x 94 x 96 mm culture box and grown for another 5 weeks before the bacteria infection.
2.2 Bacteria and growth conditions
In this study, wild-type Agrobacterium rhizogenes strain A4 and its derivatives were used. The derivatives: ΔrolA, ΔrolB, ΔrolC, and ΔrolD A. rhizogenes strain A4 (rolA, rolB, rolC, and rolD deleted mutant, respectively) were kindly provided by Jung-Hao Wang. These bacteria were constructed using homologous recombination techniques. A. rhizogenes strain A4 derivatives were grown on YEB plate (5 g / L tryptone, 1 g / L yeast extract, 5 g / L nutrient broth, 5 g / L sucrose, and 0.49 g / L MgSO4‧7H2O, pH 7.2, solidified with 15 g / L agar) at 26 oC. Single colony was selected and sub-cultured in glass tube containing 3 mL YEB at 26 oC, 130 rpm. For growth curve analysis, OD600 were recorded every 3 hours until the observation values did not increase. Three biological replications were performed for each genotype.
2.3 Genotype confirmation for A. rhizogenes strain A4 derivatives
The genotype of wild-type A. rhizogenes strain A4 and its derivatives were checked routinely to ensure no contamination existed during the experiment. DNA of these bacterium were extracted using UniversAll Tissue PCR kit (Yeastern, Taiwan) by dipped a single colony into 10 µL UniversAll extraction buffer then incubated at 95 oC for 10 min. Then, the extractant became ready-to-use template. The template was then confirmed by PCR with primer pairs shown in Table 1. The pK18HRrol check primers (red arrows in Fig. 2-1) were designed to be flanked by the respective rol gene (blue bar in Fig. 2-1). Therefore, the non-deleted rol genes will give PCR amplified fragments of about 1500 bp, while the amplified fragments of deletion of the rol genes will be about 500 bp. The 10 µL PCR solution containing 5 µL of 2.0 fold and 1.5 mM MgCl2 Taq DNA Polymerase Master Mex Red (Ampliqon, Denmark), 1 µL extracted DNA, and 4 µL primer mix (final 0.2 µM each). PCR was performed as follow: 95 oC 5 min, 35 cycles of 95 oC 30 s, 55 oC 30s, 72 oC 100 s, then 72 oC for 10 min.
2.4 Hairy root induction
Single colony of A. rhizogenes strain A4 and its mutant ΔrolA, ΔrolB, ΔrolC, and ΔrolD were picked, inoculated in test tube containing 3 mL YEB medium, and cultivated at 26 oC, 130 rpm for 2 days. The bacteria culture was then diluted by ½ MS medium to 0.1 units of OD600 to make infection medium. The 8-week-old N. tabacum leaves were cut into approximately 1 cm2 and the basal side was slightly dipped into the infection medium. Aside from dipping, 0.4 µL of the infection medium was injected to the main vein of the leaf disc in hairy root initiation ability test to control the quantity and position of infection. Either way was used, the bacteria-containing leaf discs were
then planted onto ½ MS plate for co-inoculation at 22 oC for 3 days in dark. After co-inoculation, the dipped infected-leaf discs were washed three times by 200 ppm cefotaxime-containing ½ MS medium to reduce the bacterium titer then implanted to 300 ppm cefotaxime-containing ½ MS (½ MS+Ce) plate. On the other hand, the bacterium injected-leaf discs were put directly onto ½ MS+Ce plate. After 21 days post infection (dpi), hairy root emerged from the infected leaf disc was cut and placed onto a 6 cm diameter, fresh ½ MS+Ce plate. Only one single root of each leaf disc will be transferred onto the new plate to guarantee clone independency. Hairy roots induced by A. rhizogenes strain A4 and its rol gene-deficient mutant, ΔrolA, ΔrolB, ΔrolC, and
ΔrolD were designated HR WT, HR ΔrolA, HR ΔrolB, HR ΔrolC, and HR ΔrolD, respectively. The independent hairy root clones were sub-cultured every two weeks.
Moreover, at least 3 succeeded sub-culturing onto a fresh ½ MS+Ce plate were conducted to eliminate A. rhizogenes contamination before any measurements were performed.
2.5 Hairy root initiation test
Hairy root initiation was measured by RL ratio (the primary hairy root number per leaf disc) and DREPI (days of the first root emergence post infection). The RL ratio is defined as the primary root number per leaf disc at 21 days post infection, while the DREPI is defined as the days of the first root emergence post infection during 21 dpi (Swain et al., 2010). The better root initiation was defined as early DREPI and high RL ratio. In this experiment, each leaf was cut into 5 pieces and infected by either WTA4 or its derivatives. Thirty independent leaves were used each time. However, some leaf discs were abandoned due to contamination. Therefore, the biological replications of
WT and ΔrolA, ΔrolB, ΔrolC, and ΔrolD used in this test were 60, 60, 60, 45, and 52, respectively.
2.6 Hairy root genotype confirmation
After succeeding at least 3 times in sub-culturing, genotypes of the hairy root were confirmed using primers described above (Table 2-1). Tobacco ACTIN-9 primers were used as a positive control of the materials, and VirA primers were used as a negative control to evaluate whether the bacteria had been eliminated completely. The genomic DNA of hairy roots were extracted by Wizard Genomic DNA Purification Kit (Promega, USA) then adjusted to 2.5 ng/µL. The 10 µL PCR solution containg 5 µL of 2.0 fold and 1.5 mM MgCl2 Taq DNA Polymerase Master Mex Red (Ampliqon, Denmark), 4 µL (10 ng) genomic DNA, and 1 µL primer mix (final 0.2 µΜ each). PCR was performed as follows: 95 oC 5 min, 30 cycles of 95 oC 30 s, 55 oC 30s, 72 oC 100 s, then 72 oC for 10 min.
2.7 Analysis of hairy root architectures
The parameters used for hairy root architecture analysis were main root length (MRL), branch root number (BRN), total branch root length (TBRL), and branch root density (BRD) (Hernández-Mata et al., 2010). These parameters were measured after 18 days of sub-culturing. The sub-culture was performed by cutting 1.5 cm of hairy root from the root tip onto a fresh ½ MS+Ce plate (6 cm diameter) then cultured at 22 oC in dark. The position of the incision root was marked on the plate (dash line in Fig. 2-2).
Main root indicates the same root extended directly from the marked root, while branch root is defined as the roots directly extruded from the main root (shown in asterisk in
Fig. 2-2). Total branch root length is the length of all branch roots. Branch root density means the branch root number per cm of the main root (cm-1).
2.8 Statistical analysis
Statistical analysis were performed by R program version 2.14.1 (R Development Core Team, 2011).
The DREPI and RL ratio data were first analyzed by the Shapiro-Wilknormality test but both were not normally distributed under the significant level α = 0.05 (data not shown). Therefore, nonparametric methods were used for significant test. Significant effect of group was tested by Kruskal Wallis method and Mann-Whitney U tests with Bonferroni correction as the post-hoc (Bonferroni, 1936; Kruskal and Wallis, 1952;
Kruskal, 1957).
The parameters of hairy root architectures (MRL, BRN, TBRL, and BRD) were analyzed statistically using permutation tests of ANOVA with 1000 replications because the population distribution did not obey normal distribution. This may occur due to the small population used in this study. If insertion position of the T-DNA were taken into account, each gene must be inserted to make the complete hairy root population. To achieve the complete hairy root population, at least 4.5x10⁹ independent clones have to be established (every space between two nucleotide have to be inserted once) (Nicotiana tabacum (common tobacco) genome view 2012), which surpass the maximum loading of our work. However, we tried to establish as much clones as we could in this study. More than 50 independent hairy root clones were used in each group (see 2.7 Analysis of hairy root architectures). Permutation test was chosen to test if different groups come from the same distribution under 95% confidence level because it does not assume normality and homogeneity of variance of the data; which was the case
of our data. The permutation test was conducted as follow: a F-value was obtained using ANOVA comparing one of the rol-gene deficient induced HR and WT HR. Then, the groupings of all the observations were permuted. The permuted data was then analyzed by ANOVA and obtained another F-value. The permutation were performed 1000 times, and hence 1000 more F-value. The percentage of F-value larger than or equal to the original one was reported as the permuted p-value. Therefore, the smaller the p-value was, the more significant between the groups. All the comparisons were conducted against HR WT.
2.9 RNA extraction
To bypass gelling agent contamination during hairy root tissue, hairy root were cultured in liquid medium before sampling. Each hairy root was cut 1.5 cm from the root tip then put into a 50 mL ½ MS broth in a 250 mL flask, and cultured in the dark at 22 oC for 14 days. After the culturing, each hairy root was put onto a clean paper towel to eliminate the medium before putting into a liquid nitrogen pre-freezed mortar. The tissue was then homogenized by pestle and mortar to fine powder. Before thawing, the tissue powder was put into Trizol reagent (Invitrogen, USA) then stored at -80 oC. Each clone of hairy root powder was stored in Trizol in an independent eppendorf. After all the samples were collected, at least 24 independent hairy root samples in Trizol reagent of HR WT were pooled to make one mixed sample. The HR ΔrolA, HR ΔrolB, HR ΔrolC, and HR ΔrolD were done in the same way. Total RNA extraction of the mixed sample was performed by Direct-zol RNA MiniPrep (Zymo research, USA) follow the manufacture’s instruction manual.
2.10 Microarray labeling, scanning, and data extracting
The qualities of the total RNAs were checked by Agilent 2100 bioanalyzer (Agilent, USA). 0.2 µg of total RNA was amplified by a Low Input Quick-Amp Labeling kit (Agilent Technologies, USA) and labeled with Cy3 or Cy5 (CyDye, Agilent Technologies, USA) during the in vitro transcription process. Cy-labled cRNAs were hybrid to dual-channel Agilent Tobacco Oligo 4x44K Microarray (Agilent Technologies, USA) then scanned with an Agilent microarray scanner (Agilent Technologies, USA) at 535 nm for Cy3 and 625 nm for Cy5. The scanned images were analyzed, normalized by rank-consistency-filtering LOWESS method using Feature extraction 10.5.1.1 software (Agilent Technologies, USA). For comparison between HR WT and HR ΔrolA, as well as HR WT and HR ΔrolD, one replicate was done. For comparison between HR WT and HR ΔrolB, as well as HR WT and HR ΔrolC, two biological replicates were performed. Also, the two biological replicates were analyzed in a dye-swap manner. Genes consistent down regulated with a two-fold cut off threshold in HR ΔrolB / HR ΔrolC compared to that in HR WT were selected and listed for further ontology analysis (data not shown).
2.11 Gene ontology of microarray data
The extracted genes were analyzed by Gene Ontology (GO) Analysis Toolkit and Database for Agricultural Community (agriGO) (Du et al., 2010). Using Singular Enrichment Analysis (SEA) with default setting, the biological process differences between HR WT and HR ΔrolB were evaluated, as well as between HR WT and HR ΔrolC according to their probe name. The default settings of SEA analysis are described below. The Fisher method was used for statistical test, Yekutieli (FDR under
dependency) method was used for multi-test adjustment method, significant level were set at 0.05 and the minimum number of mapping entries was 5, and complete GO database was used. Gene ontology in terms of biological process was reported as a diagram with explanation shown in Fig. 2-3. In general, each block represents a specific gene ontology group, and the scope of the group shrinks from top to bottom. Therefore, the lower the block represented a more specific GO the group. The relationship of the blocks between two adjacent rows is expressed by different kinds of arrows (Fig. 2-3).
The significant level was expressed within parentheses.
2.12 qRT-PCR
Probe names extracted from GO analysis were blasted to search the best fits mRNA and / or DNA in the NCBI database. Specific primers were designed according to the above information. The primers were named after their NCBI accession numbers as shown in Table 2-2. These primers were first tested using HR WT cDNA template to see if only one peak exists in the melting curve, and whether the CT value lies within 35 cycles. After the preliminary test, the primers were used for expression level examination.
In experiment comparing HR ΔrolC and HR WT, 3 independent clones were chosen. On the other hand, due to low biomass and poor viability, only 2 HR ΔrolB clones were analyzed with another two independent HR WT clones. The two-week old hairy roots after sub-culturing into liquid ½ MS medium and were used for total RNA extraction by Direct-zol RNA MiniPrep (Zymo research, USA). The first-strand cDNA was synthesized using 1.5 ng of total RNA with GoScript Reverse Transcription System (Promega, USA). The extending temperature was 42 oC and RNasin was used during the reverse transcription. The qRT–PCR analyses were performed by CFX384 real-time
PCR detection system with iQ SYBR green supermix (Bio-Rad, USA). For each test, 3
technical replications were performed. The qRT-PCR program was: 95
oC 3 min; 40 cycles of 95 oC 10 sec, 55 oC 30 sec, plate reading; 95 oC 10 sec; melt 65 to 95 oC, increment 0.5 oC every 5 sec, plate reading. TAC-9 (tobacco ACTIN-9) andbeta-TUBULIN were used as control genes. Permutation test was used for statistic
analysis as previously described.Chapter 3. Results
3.1 Genotype confirmation of rol gene-deficient A. rhizogenes strain A4
A. rhizogenes strain A4 and its derivatives were used in this study. The derivatives
were: ΔrolA, ΔrolB, ΔrolC, and ΔrolD A. rhizogenes strain A4 (rolA, rolB, rolC, and rolD deleted mutant, respectively) kindly provided by Jung-Hao Wang. These strains
were constructed using homologous recombinant techniques (unpublished data). The genotype of A. rhizogenes strain A4 and its derivatives were checked periodically during this study by amplified their DNA using pK18HRrol check primers. The designation of pK18HRrol check primers was interpreted in Fig. 3-1B (red arrow); the primers were franked by the rol genes (blue line in Fig. 3-1B). Therefore, lacking rol genes resulted in smaller PCR amplified fragments (about 500 base pairs) than the wild-type ones (larger than 1500 bp). Moreover, G3PDH served as a bacterium control while VirA indicated the presence of pRi, both of which had products about 200 bp.
Water was added in the no template group as a negative control
Results in Fig. 3-1 showed that the genotype of A. rhizogenes strain A4 and its derivatives were consistent with expectation as the lengths of amplified PCR fragment of the expected-deleted rol genes were about 500 bp and the undeleted larger than 1500 bp (Fig. 3-1). Existence of the G3PDH and VirA PCR amplified fragments confirmed the existence of A. rhizogenes and pRi in the materials. No amplified fragments in the no template group confirmed contamination was not present in the reagent. Overall, the results re-confirmed the genotypes of A. rhizogenes strain A4 and its derivatives.
3.2 Tobacco infection by A. rhizogenes strain A4 and its derivatives
To understand if rol gene deletion has any effects on bacterium growth in
YEB broth, growth curve by recording OD600 with three biological replicates were performed (Fig. 3-2). Although wild type A. rhizogenes strain A4 grew slower than its rol gene-deficient derivatives during 12-24 h after inoculation, there was no significant
differences between all groups when incubate longer than 24 h in YEB broth.
According to the results and previous studies (Cardarelli et al., 1987; Batra et al., 2004;
Lee et al., 2007), 48 h post inoculation was chosen for tobacco infection.
3.3 Confirmation of hairy root genotype
Hairy root genotype confirmation was performed using the pK18HRrol check primer sets after the hairy roots were transferred to fresh ½ MS+Ce for at least three times. Tobacco ACTIN-9 served as a positive control, while A. rhizogenes VirA served as a negative control. N. tabacum L. cv. Wisconsin 38 root (W38 root) were used to validated no fragment were amplified by pK18HRrol check primer. Instead of DNA template, water was added in the no template group as a reagent control. The results confirmed that the genotype of each hairy root was as expected (Fig. 3-3). In HR WT, all the PCR products amplified by pK18HRrol check primers showed the same size as that of WT A4, indicating the presence of the rol genes (row 2 of Fig. 3-3). Moreover, the absence of the VirA product and the presence of tobacco ACTIN-9 confirmed the hairy root origin; instead of A. rhizogenes strain A4. In HR ΔrolA, the PCR product of pK18HRrolA had smaller fragment than that of WTA4, while others had the same size (row 3 of Fig. 3-3), confirming the phenotype was correct. The same results can be seen in other types of hairy roots as well. The results confirmed the accuracy of the hairy root genotype.
3.4 Hairy root initiation test
In wild-type A. rhizogenes strain A4 (WTA4) infected tobacco leaf discs, hairy roots started to initiate 10 days post infection (dpi). By 21 dpi, more than 90% of the WTA4-infected leaf discs had at least one hairy root. Earlier hairy root initiation time and higher percentile of leaf discs with hairy root indicate greater induction ability.
Therefore, days of the first root emergence post infection (DREPI) recorded during 21 dpi and primary root number per leaf disc (RL ratio) recorded at 21 dpi were chosen for initiation test parameters (Swain et al., 2010).
The DREPI and the RL ratio seemed to be quite different between groups tested.
Figure 3-4 shows 5 representative leaf discs selected systematically according to their hairy root numbers and length at 21 dpi. It can be clearly seen that hairy root numbers, as well as its length decreased in ΔrolB and ΔrolC -infected leaf discs. To further confirm this phenomenon, statistical analysis was performed. The DREPI and RL ratio data were first analyzed by the Shapiro-Wilknormality test but both were not normally distributed under the significant level α = 0.05 (data not shown). Therefore, nonparametric methods were used for significant test.
Significant effect of A. rhizogenes genotype on DREPI (p = 1.815x10⁻⁸) was analyzed by a Kruskal Wallis test. A post-hoc test using Mann-Whitney U tests with Bonferroni correction showed significant differences between WTA4 and ΔrolB (p = 1.1x10⁻³) and between WTA4 and ΔrolC (p = 8.4x10⁻⁶). This may be due to the fact that there were lower root emergence rate of both groups during 10-21 dpi, and that about 20% lower at 21 dpi (Fig. 3-5). Although ΔrolD showed lower root emergence rate before 16 dpi, the root emergence rate thrived after that. At 21 dpi, no significant differences existed between ΔrolD and WTA4. On the other hand, ΔrolA showed little or no differences in root emergence rate comparing with WTA4.
The Kruskal Wallis test revealed a significant effect of A. rhizogenes phenotype on RL ratio (p = 1.815x10⁻⁸) (Fig. 3-6). Mann-Whitney U test adjusted with Bonferroni correction revealed the significant differences between WTA4 and ΔrolB (p = 1.1x10⁻³) and between WTA4 and ΔrolC (p = 8.4x10⁻⁶).
The statistical analysis confirmed that the hairy root initiation ability in ΔrolB and ΔrolC were impaired when comparing to WTA4.
3.5 Measurements of hairy root architecture
Morphology of HR WT, HR ΔrolA, HR ΔrolB, HR ΔrolC, and HR ΔrolD were shown in Fig. 3-7. Five independent hairy root clones of each genotype were selected by systematic sampling according to their main root length (MRL) 18 d after sub-culturing. The population of HR ΔrolB and ΔrolC seemed to show growth retardation. When comparing the fourth picture of each group, HR ΔrolB and HR ΔrolC showed much shorter MRL. Moreover, the branch root development of the two populations seems to be retarded, as shown in the first picture in each group, although the population distributed a large variation. To understand if there are any statistic significant differences among the genotype of the hairy root, several parameters including main root length (MRL), branch root number (BRN), total branch root length (TBRL), and branch root density (BRD) were analyzed.
The results of main root length (MRL) analysis showed significant differences between HR WT and HR ΔrolC (p = 9.99x10⁻⁴), as well as HR WT and HR ΔrolD (p = 9.99x10⁻³) (Fig. 3-8B) by permutation test using ANOVA with 1000 replications. The population distribution of HR WT showed skew-to-right normal distribution with peak around MRL 5 cm (Fig. 3-8A WT). About 30% of the clones belonged to this group,
while less than 10% had MRL less than 5 cm or longer than 10 cm. Similar skew-to-right normal distribution can be seen in HR ΔrolC (Fig. 3-8A ΔrolC). However, about 35% of the HR ΔrolC clones had MRL less than 5 cm, which was very different from that of HR WT. This phenomenon was more pronounced in MRL 0-2 cm.
Moreover, the percentage of the observations showing MRL longer than 10 cm was also fewer than that of HR WT. The population distribution of HR ΔrolD was similar to that of HR ΔrolC (Fig. 3-8A ΔrolD) with increased population with shorter MRL value when comparing with HR WT. On the other hand, although HR ΔrolB also showed similar population with MRL less than 10 cm, no significant differences existed between HR ΔrolB and HR WT (p = 0.12, Fig. 3-8B). This may due to the fact that about 20% of HR ΔrolB and HR WT had MRL value larger than 10 cm, while only about 10% was observed in HR ΔrolD. The population of HR ΔrolA was similar to that of HR WT (Fig. 3-8A, HR ΔrolA vs. HR WT), and no significant difference was observed (p = 0.08). In conclusion, increased population with shorter MRL value resulted in main root length impairing of HR ΔrolC and HR ΔrolD when comparing with HR WT.
The branch root number (BRN) of HR ΔrolB and HR ΔrolC were significantly different from that of HR WT (p-value = 7.99x10⁻³ and 9.99x10⁻⁴, respectively) (Fig.
3-9B). A dramatic difference can be seen in HR ΔrolC, where all the hairy roots observed had less than 30 branch roots. Moreover, the BRN of more than half of the population was less than 2, indicating that branch root development may be drastically impaired in HR ΔrolC. Meanwhile, the BRN of almost 60% of the HR ΔrolB was less than 5. This population was about twice more than that of HR WT. HR WT showed steady decrease in BRN from 0-20 with little percentage having branch root larger than
30, which was also the case in HR ΔrolA and HR ΔrolD. Therefore, no significant differences were shown between HR ΔrolA and HR WT (p-value = 0.86), as well as between HR ΔrolD and HR WT (p-value = 0.55). In conclusion, when comparing to HR WT, HR ΔrolB and HR ΔrolC showed significant differences.
Other than branch root number, another parameter used to estimate branch root architecture was total branch root length (TBRL). In this analysis, significant differences were observed between HR WT and HR ΔrolB (p = 4.39x10⁻²), as well as between HR WT and HR ΔrolC (p = 9.99x10⁻⁴) (Fig. 3-10B). As can be indicated in population distribution, TBRLs were drastically decreased in both groups (Fig. 3-10A).
The result further strengthens the idea that branch root development may be impaired in HR ΔrolB and HR ΔrolC.
Another parameter used to measure branch root architecture was branch root density (BRD), which was defined as the number of branch root per centimeter of main root. HR ΔrolC and HR WT (p = 9.99x10⁻⁴) but not HR ΔrolB and HR WT (p = 7.89x10⁻²) showed significant differences (Fig. 3-11B). This may be explained by the fact that the range of the outliers in HR ΔrolB was larger than that of HR ΔrolC (Fig.
3-11A). Moreover, the BRD 0-0.5 of HR ΔrolC was twice than that of HR WT. On the other hand, there was only 33% more of BRD 0-0.5 HR ΔrolB (Fig. 3-11A). Although HR ΔrolD also showed 33% more in the BRD 0-0.5 than that of HR WT, more BRD value larger than 3.0 was also observed. This made the HR ΔrolD population range larger than that of HR WT and increased the p-value to 0.38.
Overall, hairy root architecture analyses revealed that hairy root growth was dramatically affected in HR ΔrolB and HR ΔrolC when comparing with HR WT.
3.6 Microarray Data Analysis
To elucidate the biological functions that rol genes manipulated in hairy root, Agilent Tobacco Oligo 4x44K microarray were used to analysis transcriptional profiles differences between hairy roots induced by A. rhizogenes strain A4 and its respective rol gene-deficient derivatives. We first compared transcriptome of hairy roots induced
by WTA4 and all respective rol gene-deficient derivatives. Considered the pivotal roles ΔrolB and ΔrolC had on hairy root architecture, we then performed another biological replicate by comparing the transcriptome of hairy roots induced by ΔrolB / ΔrolC and WTA4 using the same kind microarray chip in a dye-swap manner. Each microarray RNA sample was combined of at least 20 independent hairy root clones.
In comparison between ΔrolA and WTA4, 217 genes were differentially up regulated in HR ΔrolA under 2-fold cut off threshold and 352 genes were differentially down regulated (Table 3-1). On the other hand, comparison between ΔrolD and WTA4 showed that 271 genes were differentially up regulated in HR ΔrolD under 2-fold cut off threshold and 297 genes were differentially down regulated (Table 3-1).
The consistent up- and down- regulated genes from the comparison between HR ΔrolB vs. HR WT as well HR ΔrolC vs. HR WT in the two biological replicates were meshed under 2-fold cut off threshold. The number of up regulated genes in HR ΔrolB and HR ΔrolC compared with HR WT were 6 and 42; the number of down regulated genes in HR ΔrolB and HR ΔrolC compared with HR WT were 242 and 208, respectively (Fig. 3-12, and Table 3-1). The number of the constitutive expressed genes was lower in comparison with other microarray analyses. This may due to different hairy root clones have different T-DNA insertion sites and / or insertion copy number, and we used two different sets of hairy root to perform the biological replicates.
Therefore, we are more confident with the constitutive expressed genes as they may be more likely to be regulated by lacking of the rol genes, albeit their T-DNA insertion site and / or insertion copy numbers. The same results can be seen in the constitutive down regulated genes with minor effects. The down-regulated genes were used for gene ontology analysis as they may be positively regulated by rolB and rolC, respectively.
3.7 Gene ontology of HR ΔrolB down-regulated genes
Gene ontology of the 242 down regulated-genes in HR ΔrolB was performed using agriGO with default settings (Du et al., 2010). Half of the 242 genes have been annotated, therefore only these genes were compared. The GO terms with p-value smaller than 0.05 were shown in Table 3-2. To get better impression about the relationships among the GO extracted, diagram according to biological process was produced (Fig. 3-13).
Four main categories of GO were present: localization, cellular process, metabolic process, and response to stimulus. The subgroups in “localization” pin point that the lipid transport was drastically decreased in HR ΔrolB (p = 2.95x10⁻¹³). Genes included in this blocks are listed in Table 3-3. The major group “response to stimulus” contained two specific subgroups showing significant differences. These groups were “response to wounding” and “response to ethylene” (p = 1.36x10⁻⁴ and 4.43x10⁻², respectively; Fig.
3-13). Although there was no significant difference in the group “cellular process and metabolic process”, one of their subgroup “cellular amino acid derivative biosynthesis process” was extracted (p = 3.35x10⁻², Fig. 3-13).
3.8 Gene Ontology of HR ΔrolC down-regulated genes
Gene ontology of the down regulated genes in HR ΔrolC was performed as that