Proceedings of 7th PAAMES and AMEC2016 13-14 Oct., 2016, Hong Kong
Extreme Typhoon Loads Effect on the Structural Response of an Offshore Wind Turbine
Bryan Nelson1*, Tsung-Yueh Lin1, Yann Quéméner1 Ya-Jung Lee2, Hsin-Haou Huang2, Chi-Yu Chien2
1 Research Department, CR Classification Society, Taipei, Taiwan
2 Department of Engineering Science and Ocean Engineering, National Taiwan University, Taiwan Correspondence: Bryan Nelson, E-mail: [email protected]
Abstract
Taiwan has recently started to evaluate the potential for offshore wind energy production off the island's west coast. However, concerns have been raised about the appropriateness of adopting existing solutions designed for mild environments for use in Taiwan, which is struck by an average of four typhoons per year. In the present study, the authors investigated the strength of an offshore wind turbine jacket foundation under typhoon conditions. First, the typhoon environmental conditions were collected for a 50-year return period (i.e. 10-4 probability of failure), which corresponds to the ‘normal’
safety class described by DNV. The wave loads, for an extreme wave height of 14.9 m and a current speed of 1.4 m/s, were determined by the Morison equation, executed via the in-house HydroCRest code, and the wind loads, for an extreme peak gust speed of 70 m/s, on a parked wind turbine with pitch control failure were calculated by blade element method (BEM), for an extreme operating gust (EOG) profile, as specified by the IEC. A structural model of the proposed jacket, including piles in soil, was then built using finite elements, and the extreme environmental loads were applied to the structural model for static and dynamic analyses, which revealed a strong dependence of the dynamic response on the duration of the gust event, specifically, a 25% reduction in gust duration resulted in a 10% increase in dynamic stress.
Keywords: offshore wind turbine, extreme load, structural response, jacket foundation
Introduction
Taiwan has recently started to evaluate the potential for offshore wind energy production off its west coast. However, most of the worldwide experience regarding wind energy is limited to onshore units and offshore units in mild environments. Concerns have thus been raised about employing these existing solutions for Taiwan’s harsh environment, which is frequently subjected to typhoons. Extensive data collection is the key to producing reasonable and safe design load conditions, and, to this end, three meteorological masts were installed in the
proposed wind farm areas in 2015, with the first full-scale-test 3.6 MW offshore wind turbine to be installed later in 2016.
At present, however, there is a scarcity of reliable long term typhoon wind and wave data, and so this study considered a 50-year return period wind speed and a 100-year return period wave height, in compliance with the require- ments of the Ministry of Economic Affairs [1].
Chang et al [2] recently conducted analyses for the west coast of Taiwan to statistically predict design extreme wind speeds at an approximate wind turbine hub height of 100 m, derived from wind measurements at ground level. A peak gust
wind speed of 70 m/s is consistent with their predicted 50-year extreme gust wind speed.
Preliminary metocean data, including significant wave height data, were also made available for the installation site, and 14.9 m is consistent with a 100-year maximum wave height. Finally, based on the metocean data, an extreme water depth, including storm surge, was set to 25 m, with a surface current speed of 1.4 m/s.
Accurate typhoon design load evaluations are also required to reduce uncertainties. The following two sections evaluate, respectively, the wave loads on the jacket foundation and the wind loads on the parked wind turbine considering pitch control system failure, which prevents rotor feathering, resulting in extremely high loads being induced at the nacelle. The third section presents the dynamic structural response of the wind turbine foundation to the loads calculated in the preceding sections.
Wave loads on jacket foundation
Nearshore ocean wave dynamics are subject to nonlinearity and wave breaking due to the seabed terrain. There are various wave theories to analytically define the wave flow field of non- breaking waves, while breaking waves can be studied through experiments and computational hydrodynamic analyses. Figure 1 presents the range of validity of regular wave theories, as per DNV [3]. For the design wave considered in this study (see Table 1), the flow properties may be evaluated using the nonlinear intermediate-depth 5th-order Stoke’s wave theory.
Table 1. Typhoon wave parameters.
Wave Height (m) 14.88
Period (s) 12.47
Wave Length (m) 194 Water Depth (m) 25.03 Current Speed (m/s) 1.4
Figure 2 presents the wave particle velocities and accelerations at the free surface, assessed by 5th-order Stokes wave theory (full line) and regular Airy wave theory (dashed line). The non- linear wave velocity and acceleration are seen to result in larger amplitudes and steeper variations compared to the linear wave assumption.
Fig. 2 Comparison of 5th-order Stoke’s and Airy wave velocity (m/s) and acceleration (m/s2) at the free surface.
When the wave particles’ flow is defined, the wave loads on the offshore structure can be computed. A popular and convenient approach to evaluate the wave loads on slender bodies is to apply the Morison equation [4], given in Eq. (1), which calculates time-varying loads of slender bodies per unit length (i.e. line loads). The applicability of the equation is limited to non- breaking, regular waves where the wavelength is 100 times longer than the characteristic dimension of the structure; here the diameters of the jacket legs and bracings are 2 m.
The Morison equation divides the wave loads into an inertia and a drag term, and assumes that the flow condition is not significantly disturbed by the structure. The inertia term is proportional to the acceleration of the wave particles, and the drag term relates to the square of the velocity:
v v D 2 C
v 1 A C
FM sw M sw D (1) where ρsw is the specific gravity of seawater, and CM is the inertia coefficient, set to 2.0 as a minimum value recommended by DNV [3] “for structures in shallow waters near coastlines where there is a significant current in addition to the waves”. A is the projected area of the
considered jacket leg/bracing, D is the leg/
bracing diameter, and CD is the drag coefficient, which, as per DNV [3], considers the roughness of the structure, and hence the marine growth, here assumed to occur below the lowest astro- nomical tide (LAT) water level. For the con- sidered jacket component under extreme wave height, the drag coefficients below and above the LAT water level were respectively calculated as 1.25 and 0.65. Finally, the wave particle velocity included the current velocity, which followed a power law distribution with water depth from the seabed (V = 0 m/s) to the “calm water” sea surface (V = 1.4 m/s, as in Table 1).
This study employed the in-house code, HydroCRest, to compute the Morison equation from the wave particles field derived from linear and nonlinear Stokes and Cnoidal theories’
waves. To calculate the Morison equation, the velocities and accelerations of water particles at virtual structural nodes were analytically derived from the corresponding theoretical wave [5].
Wind loads for a parked wind turbine
In preference to time consuming computational fluid dynamic (CFD) simulations, a modified blade element method (BEM) was adopted to calculate the aerodynamic loads on the wind turbine. Due to its maturity, the BEM is widely employed for the design and analysis of wind turbines [6]. The blade element theory discretises the rotor into a number of 2D airfoil sections, such that the axial and tangential loads on each 2D section may be calculated from the respective airfoil’s lift and drag characteristics for the respective local relative flow velocity and angle. These local loads are then integrated along the length of the rotor blades and multiplied by the number of blades, as per Eq. 2, to determine the total thrust and rotor toque:
R
0 l d
2 rel B
R
0 l d
2 rel B
N
r 2 cr
n 1 Q
r 2 c
n 1
d cos C sin C U
d
d sin C cos C U
dF
(2)
where Urel and φ are, respectively, the relative inflow velocity and direction, Cl and Cd are the sectional lift and drag coefficients, c is the chord
length of each blade section, and nB is the number of blades.
Typically, the blade element theory is combined with axial and angular momentum theories to determine the reduction in flow velocity through the rotor plane due to the extraction of energy from the wind. However, as the current study considers a parked wind turbine (i.e. no energy extraction), the axial and tangential induction factors are neglected.
The BEM implemented in this study includes the following modifications:
■ The effects of the wind turbine tower on the upstream flowfield were modelled by assuming potential flow around a circular cylinder [7], such that the radial and angular components of the flow velocity at a considered point are given by Eq. 3:
𝑈𝑟 = 𝑈∞(1 −𝑅𝑟22) cos 𝜃
𝑈𝜃 = −𝑈∞(1 +𝑅𝑟22) sin 𝜃 (3)
■ A wind shear profile was included, such that the wind velocity at height z for a specified hub height velocity U(H) is given by Eq. 4:
𝑈(𝑧) = 𝑈(𝐻) (𝐻𝑧)𝛼 (4)
where the power law exponent for offshore locations is taken as = 0.14, in accordance with DNV [8].
■ In order to investigate the extreme loads at different azimuth angles, the wind turbine rotor plane was discretised onto a radial grid, such that the Cartesian coordinates of the blade elements (taking into consideration tilt, coning angle, and rotor overhang (Fig. 3)) are known throughout the rotor plane, thereby allowing for easy computation of relative wind components at each blade element position.
■ The tilt angle, which increases the clearance between tower and blades, also affects the orientation of the blades, resulting in an azimuthal variation in angle of attack, which is accounted for by transforming the relative wind to each blade element’s local coordinate system.
Fig. 3 Rotor plane discretisation onto radial grid
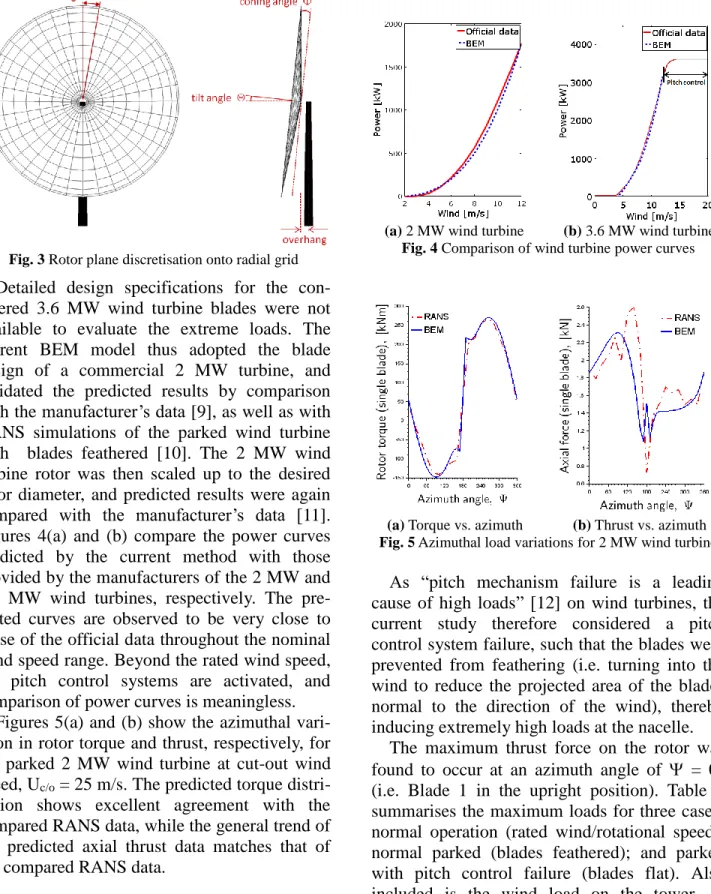
Detailed design specifications for the con- sidered 3.6 MW wind turbine blades were not available to evaluate the extreme loads. The current BEM model thus adopted the blade design of a commercial 2 MW turbine, and validated the predicted results by comparison with the manufacturer’s data [9], as well as with RANS simulations of the parked wind turbine with blades feathered [10]. The 2 MW wind turbine rotor was then scaled up to the desired rotor diameter, and predicted results were again compared with the manufacturer’s data [11].
Figures 4(a) and (b) compare the power curves predicted by the current method with those provided by the manufacturers of the 2 MW and 3.6 MW wind turbines, respectively. The pre- dicted curves are observed to be very close to those of the official data throughout the nominal wind speed range. Beyond the rated wind speed, the pitch control systems are activated, and comparison of power curves is meaningless.
Figures 5(a) and (b) show the azimuthal vari- ation in rotor torque and thrust, respectively, for the parked 2 MW wind turbine at cut-out wind speed, Uc/o = 25 m/s. The predicted torque distri- bution shows excellent agreement with the compared RANS data, while the general trend of the predicted axial thrust data matches that of the compared RANS data.
■ Note: The large harmonic fluctuations of the torque curve in Fig. 5(a), and, to a lesser extent, of the load curve in Fig. 5(b), are due to the afore-mentioned tilt effects.
(a) 2 MW wind turbine (b) 3.6 MW wind turbine Fig. 4 Comparison of wind turbine power curves
(a) Torque vs. azimuth (b) Thrust vs. azimuth Fig. 5 Azimuthal load variations for 2 MW wind turbine
As “pitch mechanism failure is a leading cause of high loads” [12] on wind turbines, the current study therefore considered a pitch control system failure, such that the blades were prevented from feathering (i.e. turning into the wind to reduce the projected area of the blades normal to the direction of the wind), thereby inducing extremely high loads at the nacelle.
The maximum thrust force on the rotor was found to occur at an azimuth angle of = 0°
(i.e. Blade 1 in the upright position). Table 2 summarises the maximum loads for three cases:
normal operation (rated wind/rotational speed);
normal parked (blades feathered); and parked with pitch control failure (blades flat). Also included is the wind load on the tower, as calculated by the drag force formulation provided in Eq. (5), which neglects the mutual interaction between the rotor and the tower.
ρ C
z U
z2 z 1
FW air DD w2 (5) where CD is the drag coefficient, D is the tower diameter, and Uw is the wind speed.
As a final validation, the overturning moment at the mudline was calculated by applying the predicted maximum rotor load at an assumed height of 100 m, and integrating the tower loads along its height. This load was compared with the design load provided by the turbine manufacturer [13] at a wind speed of 56 m/s. A torsional moment was also determined for the special case of pitch control failure in one blade, with the other two blades feathered. These moments and their respective errors with respect to the manufacturer’s data are summarised in Table 2.
In order to investigate the dynamic response of a 3.6 MW wind turbine foundation to extreme gust loads, the authors adopted the extreme operating gust (EOG), specified in the IEC 61400-1 standard [14], with a mean wind speed of 50 m/s and a peak gust speed of 70 m/s (Fig. 6). The gust event duration is specified in the standard as 10.5 s. However, this choice of gust duration is not explained in the standard, nor is it ever challenged in the literature. To this end, the current study also investigated the effect of gust duration on the dynamic response of the turbine foundation.
Table 2 Wind shear force on a 3.6 MW wind turbine.
Loaded components Wind Speed
12 m/s 70 m/s Blades – Normal operation 441 kN - Blades – Parked without fault - 139 kN Blades – Parked with pitch fault - 1385 kN
Tower 14 kN 475 kN
Table 3 Moments on a 3.6 MW wind turbine
Moment Official data BEM Error
Overturning 100 000 kNm 99 600 kNm 0.04%
Torsional 8 889 kNm 8 414 kNm 5.3%
Fig. 6 Extreme operating gust (EOG) profile
Structural analysis
The wind turbine tower, jacket foundation, and piles in soil were modeled using 1D 'Beam' finite elements of tubular section and of approximately 1 m length. Figure 7 presents the FE model of the wind turbine.
Fig. 7 FE model of the offshore wind turbine
The material was set as linear elastic with a Young modulus of 210000 N/mm2 and a Poisson ratio of 0.3. The masses of the turbine and secondary structures (e.g. nacelle, blades, access platform, etc) were added to the FE model. The soil resistance to the pile lateral and axial displacements was represented through spring connectors, where the nonlinear elastic behavior corresponds to the p-y, t-z and q-z curve formulations provided by DNV [8]. At each pile of the jacket foundation, scouring of 2 m depth was considered by not adding soil support.
Explicit dynamic finite element analyses of the parked wind turbine were performed by applying the dynamic wind and wave loads discussed in the previous sections to the FE model as line loads (i.e. force per unit length) on the beam elements, with a concentrated force for the rotor wind loads applied at the nacelle. As suggested by DNV [8] for ultimate strength assessment, a 1.35 load factor was applied to the environmental loads. Figure 8 shows the global overturning moment at the seabed produced by the environmental loads applied on the FE model. First, the nominal wind load (i.e. 50 m/s) was applied for a 5 s preload step. The dynamic
wave loads were then exerted for three wave periods. The gust wind profile was then set to initiate at the trough of the first wave (t = 13.5 s) where the hydrodynamic loads on the jacket are low and constant, so that the dynamic response of the jacket due to the wave and that due to the gust could be clearly identified. This allowed for an investigation of the effects of the gust duration on the dynamic response of the jacket.
Fig. 8 Wind turbine total load evolution
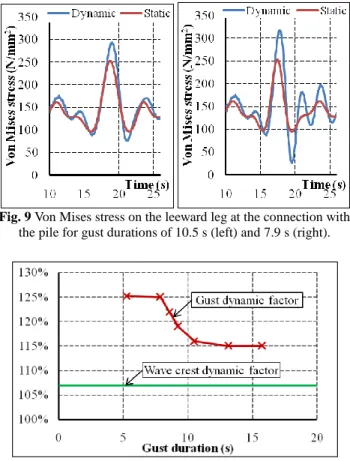
Figure 9 shows the stress in the leeward leg of the jacket at the leeward leg connection to the pile obtained by FEA for two gust duration settings. In Fig. 9, it can be observed that the stress obtained though dynamic analysis attained a maximum value significantly higher than that produced by static analysis. For the gust duration of 7.9 s, large oscillations of stress can be observed after the peak of the gust, indicating a significant dynamic behaviour of the structure compared with the results of the 10.5 s gust, for which the evolution was more consistent with the static analysis.
A dynamic factor was then extracted as the ratio of the maximum dynamic stress to the maximum static stress during the gust. Figure 10 shows the dynamic factor produced for various gust durations. It appeared that for gust durations longer than the 10.5 s specified by IEC, the dynamic factor stagnated to 115%, whereas for shorter gust events the dynamic factor increased significantly up to a threshold of 125% for gust durations of 7.9 s, a 25%
reduction of the IEC's value. For comparison, the maximum dynamic factor obtained at the wave crests was 107%. Therefore, the precise definition of a design gust wind profile for typhoon conditions, especially in terms of gust
duration, is needed to ensure an accurate ultimate strength assessment of wind turbines.
Fig. 9 Von Mises stress on the leeward leg at the connection with the pile for gust durations of 10.5 s (left) and 7.9 s (right).
Fig. 10 Ratio of dynamic to static Von Mises stresses on the leeward leg at the connection with the pile.
Conclusions
This study evaluated the extreme typhoon loads acting on an offshore wind turbine jacket foundation. The design environment considered a 14.9 m maximum wave height in a 25 m extreme water depth and surface current speed of 1.4 m/s, combined with an extreme 50-year gust event, with a peak gust speed of 70 m/s.
The dynamic wave loads on a four-legged jacket foundation were evaluated by application of the Morison equation, and the wind loads acting on a parked wind turbine with blade pitch control failure were computed using a modified blade element method (BEM). Finally, finite element analyses were conducted to evaluate the static and dynamic structural responses of the considered jacket foundation.
By adopting the blade design of a commercial 2 MW wind turbine and scaling up to the desired rotor diameter, the BEM model was able to calculate extreme loads which were in excellent
agreement with those provided by the 3.6 MW turbine manufacturer at a wind speed of 56 m/s.
At peak gust speed, Ug = 70 m/s, the load for the parked wind turbine with pitch failure condition was found to be 996% higher than that for the normal parked condition. However, the tre- mendous increase of load on the parked wind turbine with fault condition would require significant structural reinforcement and, con- sequently, additional cost, so that for typhoon- prone areas the addition of a backup system such as an emergency generator fitted in the nacelle would enable preventing this kind of system malfunction reducing significantly the severity of the design loads.
Finally, FEAs were conducted for which the dynamic effect due to the wave crest and the wind gust can be clearly identified. It was observed that the gust duration definition has a significant effect on the dynamic response, where the stress on the leeward leg connection to the pile increased from 15% to 25% for a shorter gust duration. By comparison the wave crest dynamic effect increased the stress by just 7%. Therefore, the precise definition of a design gust wind profile for typhoon conditions, especially in terms of gust duration, is needed to ensure an accurate ultimate strength assessment of wind turbines.
To conclude, this study provided simplified load evaluation models that can produce realistic extreme design loads in typhoon condition with limited data. In the future, the validation of the load evaluation approaches should be carried out based on full scale measurements of wind speed, wave height and structural accelerations.
Acknowledgments
The authors would like to acknowledge Fuhai Wind Farm Corp. for providing us information regarding the design of the investigated offshore wind units. This work was financially supported by the Ministry of Science and Technology, Taiwan (MOST 104-2221-E-002-154).
References
[1] Ministry of Economic Affairs, ROC, "風力發電離 岸系統示範獎勵辦法 (Regulations for Demon- stration and Rewards of Offshore Wind Power System)." Taiwan, 2012.
[2] P.C. Chang, R.Y. Yang, C.M. Lai, "Potential of Offshore Wind Energy and Extreme Wind Speed Forecasting on the West Coast of Taiwan."
Energies, 2015 , 8, 1685-1700.
[3] "Environmental Conditions and Environmental Loads – Regular wave theories,” DNV-RP-C205, Oct. 2010.
[4] J.R. Morison, M.P. O’Brien, J.W. Johnson, S.A.
Schaaf, "The force exerted by surface waves on piles.” Petroleum Transactions, Vol. 189: pp.149- 154, 1950.
[5] J.D. Fenton, “Nonlinear Wave Theories,” The Sea, Ocean Engineering Science, Vol. 9, 1990, New York.
[6] R. Carriveau, “Fundamental and Advanced Topics in Wind Power,” InTech, Free online ed., June 2011 .
[7] Hansen, M. 2007 “Aerodynamics of Wind Turbines”, 2nd Ed., Earthscan, London, UK [8] "Design of Offshore Wind Turbine Structures.”
DNV-OS-J101, May 2014.
[9] AMC Portal of Wind Park Tai-Chung Power Plant,
"Zephyzos Z72 wind turbine – Technical and Performance Data." Taiwan Power Company, 1981.
[10] Y.C. Chen, “Numerical study an aerodynamics effects of gusting winds on a wind turbine during standstill”, MSc thesis, Department of Engineering Science and Ocean Engineering, National Taiwan University, 2011
[11] Siemens brochure, “Thoroughly tested, utterly reliable: Siemens Wind Turbine SWT-3.6-120”, Germany, 2011
[12] Sharples, WG, “Buoyancy Stabilized Offshore Wind Turbine”, Technical report, USDOE, 2014 [13] Siemens Report: SWT-3.6-120 on jacket
foundation: initial offshore interface loads, 68.25m –Fuhai, Report No.: E W EN OEN DES TLS 4 2–40-7624-01
[14] IEC Standard 61400-1, “Extreme operating gust (EOG),” p.26-27, 2005