國立臺灣大學海洋所 碩士論文
Institute of Oceanography
National Taiwan University Master Thesis
造礁珊瑚黑病之菌相分佈研究
Bacterial consortium associated with the
“black disease"of reef-building corals
廖敏惠 Ming-Hui Liao
指導教授﹕陳昭倫 博士、湯森林 博士 Chaolun Allen Chen, Ph.D., Sen-Lin Tang, Ph.D.
中華民國 97 年 7 月 July, 2008
國立臺灣大學
海洋研究所 碩士論文
造礁珊瑚黑病之菌相分佈研究 廖敏惠 撰
95
1
摘要
目前全世界的珊瑚礁都受到破壞,而珊瑚疾病為主要威脅因素之ㄧ。然而受 限於傳統微生物學方法限制,過去對於珊瑚疾病爆發的原因和感染機制仍不清 楚。2006 年,台灣綠島發生大量珊瑚死亡事件,原因為受到如黑色覆蓋物之海綿
(Terpios hoshinota)入侵所引起,簡稱「黑病」。本研究將利用電子顯微鏡方法與
非依賴培養式的微生物分子生物技術,細菌 16S rDNA 序列和變性梯度電泳法 (denaturing gradient gel electrophoresis, DGGE),分析 T. hoshinota 特有菌相,並比 較受海綿覆蓋之珊瑚(Porites lutea)與未受海綿覆蓋之珊瑚(P. lutea)其菌相變 化情形,期望發現與疾病有關微生物,以利往後病態監測所用。
結果發現,不論珊瑚或海綿,其菌相分布都與周遭海水菌相不同。T. hoshinota 細菌群相專一,主要為具光合作用的單細胞球形藍綠菌,經分子序列及外觀比對,
可能是新種藍綠菌。此藍綠菌數量極大應該是和 T. hoshinota 存有某種程度的共生 關係。另外,利用 DOTUR、LIBSHUFF 軟體來分析珊瑚 P. lutea 的細菌群相之間 的多樣性和組成相似度。結果發現未罹病珊瑚 P. lutea 的菌相分佈,主要以 Gammaproteobacteria、Cyanobacteria、unclassified bacteria 為主;而罹病珊瑚 P. lutea 的菌相是以 Gammaproteobacteria、Alphaproteobacteria 為主,而 Cyanobacteria 以 及 unclassified bacteria 則大量減少。過去研究發現,珊瑚上有許多共生細菌,當珊 瑚受到環境壓力時,可能改變或抑制原本正常菌叢,導致菌相會以某一類群細菌 為 主 , 而 非 專 一 性 的 細 菌 也 會 伺 機 而 生 ; 本 研 究 發 現 罹 病 珊 瑚 上 Gammaproteobacteria 大量增加,可能和環境壓力有關(受海綿覆蓋或海水污染),
而 Alphaproteobacteria 則可能為伺機生長的細菌,而這樣的改變,影響正常菌叢對 珊瑚的功能,推測可能影響珊瑚健康。由於珊瑚上共生細菌易受環境壓力而改變,
未來若能建立珊瑚共生菌相長期監測資料,應可作為珊瑚的健康指標。
關鍵字: 海綿、藍綠菌、珊瑚疾病、珊瑚微生物菌相、非培養式微生物分子技術
Summary
Coral diseases are one of the major natural disturbances that threat the survival
of coral reefs worldwide. However, the characterization and mechanism of infection
have been difficult in understanding the outbreak of coral diseases due to the
limitation of applying classical microbiological assays. In this thesis, the bacteria
consortium of the “black disease” caused by a black mat-like sponge, Terpios
hoshinota, was characterized by electronic microscopy, denaturing gradient gel
electrophoresis (DGGE), and 16S ribosomal DNA library construction. In order to
understand the possible pathogenic bacteria in “black disease”, the specificity of T.
hoshinota associated bacterial community and the variation between sponge-infected
(SI) and non-sponge-infected (NSI) Porites lutea associated bacterial community
were investigated in the fringing reef of the Green Island (Lutao), where outbreak of
Terpios sponge was first reported in 2006.
Result shows that the bacterial communities from seawater, sponge, and coral
were specific. T. hoshinota associated bacterial community was specific and the
dominant bacteria group was autotrophic Cyanobacteria. The Cyanobacteria
associated with T. hoshinota were supposedly a new Cyanobacteria species as
demonstrated by 16S rDNA sequence with a unique morphology. Furthermore, the
high abundance of cyanobacteria in T. hoshinota may contribute positively to T.
hoshinota outbreak. On the other hand, the diversity and composition similarity of
bacterial community associated with SI and NSI P. lutea were analyzed using
DOTUR and LIBSHUFF. In NSI P. lutea, the dominant bacterial groups were
Gammaproteobacteria, Cyanobacteria, and unclassified bacteria; however, in SI P.
lutea, Gammaproteobacteria and Alphaproteobacteria were major groups and the
abundance of Cyanobacteria and unclassified bacteria were low. In previous studies,
there were diverse coral holobiont on a coral. The natural coral holobiont changed to
dominant bacteria group with abundance of opportunistic bacteria when corals
experience environmental stress; similar situation was observed in SI P. lutea. The
increase of the abundance of Gammaproteobacteria is probably related to
environmental stress (sponge or seawater pollution). In addition, the unexpected
emergence of alphaproteobacteria could be opportunistic bacteria because of
disturbance of natural bacterial community. Disturbance of coral holobiont possible
loss the normal symbiont function for coral and it directly or indirectly supposed to
result in coral disease. Coral associated microbes were variable in different
environment and may be a good bioindicator for environmental stress; therefore,
building up a bioindicator, a long term investigation is apparently essential.
Key words: sponge, Cyanobacteria, coral disease, coral microbiology,
uncultured molecular method
Content
口試委員審定書 i
致謝 ii
中文論文摘要 iii
英文論文摘要 iv
1 Introduction...1
1.1 Coral reef ecosystem degradation and mortality...1
1.2 Coral disease ...2
1.2.1 Definition of coral disease ... 3
1.2.2 Microbial diseases of corals... 3
1.2.3 Microbial-induced coral disease: two examples... 5
1.2.4 The limitation of coral disease research ... 8
1.2.5 Coral disease studies in Taiwan ... 9
1.2.5.1 Black disease outbreak in Green Island ...10
1.2.6 Terpios hoshinota, “the coral killer sponge” ... 11
1.2.6.1 Biology of Terpios hoshinota...13
1.2.7 Symbiotic relationships between sponge and endogenous microbe 14
1.2.7.1 Sponges as hosts of single-celled autotrophs...17
1.2.7.2 Sponge as hosts of heterotrophic single-celled microbes ...19
1.3 Aim of this thesis ...22
2 Materials and Methods...30
2.1 Sampling ...30
2.1.1 Seawater sampling ... 31
2.1.2 Coral sampling... 31
2.1.3 Sponge sampling... 32
2.2 Electron microscopy ...32
2.3 Molecular Method for bacterial library construction...33
2.3.1 DNA extraction ... 33
2.3.2 Amplification of bacterial 16S ribosomal rRNA by polymer chain reaction 35
2.3.3 Clone library construction ... 36
2.3.4 Denaturing gradient gel electrophoresis analysis ... 38
2.3.5 Recovery of DNA from DGGE gel ... 39
2.3.6 Sequencing and phylogenetic analysis ... 39
2.3.7 Bacterial group assignment... 40
2.3.8 Diversity estimation in DOTUR ... 40
2.3.9 Sequence library comparison... 41
2.3.10 Phylogenetic analyses ... 41
2.3.11 DGGE Cluster analysis... 42
3 Results...44
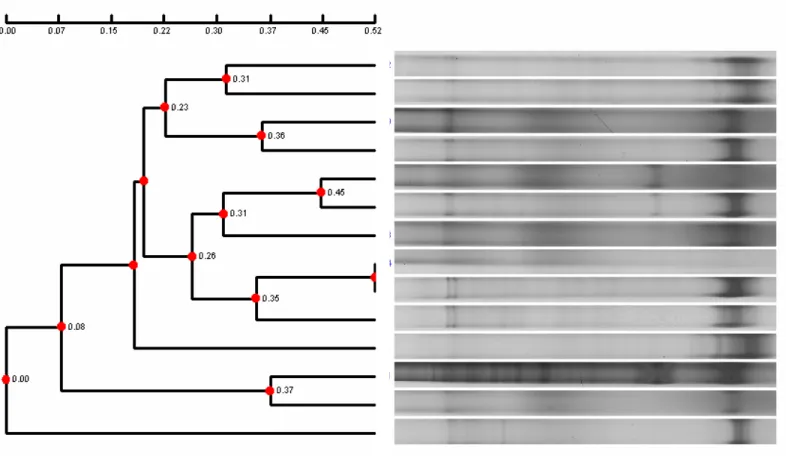
3.1 16S rRNA-DGGE analysis...44
3.1.1
P. luteaassociated bacteria communities changed when
T. hoshinotacovered ...44
3.1.2
Gammaproteobacteriawere the major group in bacteria communities of seawater and
P. lutea...44
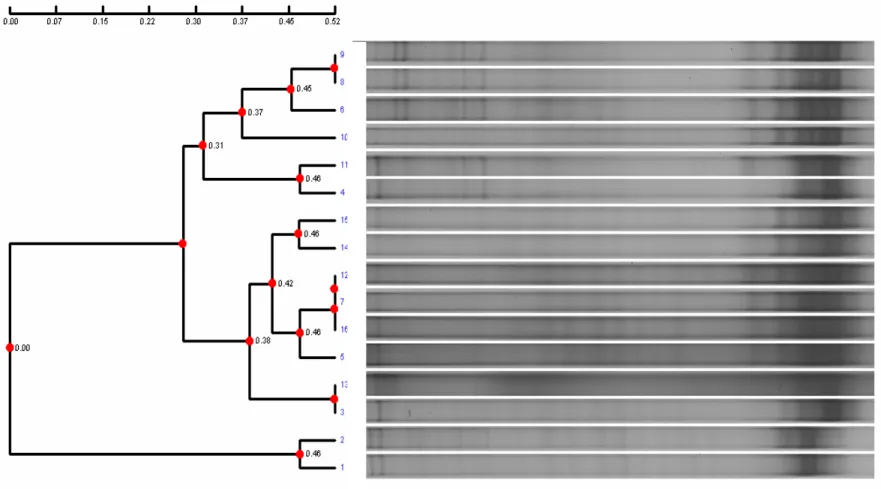
3.1.3
T. hoshinotaassociated bacterial community was specific...45
3.1.4
Cyanobacteriawere the major group in
T. hoshinotaassociated bacterial community...45
3.2 16S rRNA library construction ...50
3.2.1 Composition analysis of bacterial community...50
3.2.1.1
Gammaproteobacteriawas the major group in seawater samples...50
3.2.1.2 Bacterial communities associated with
P. luteachanged when
T. hoshinotacovered ...50
3.2.1.3
Cyanobacteriawere the major group in the sponge ...51
3.2.2 Diversity analysis of bacterial 16S rRNA clone libraries ...58
3.2.2.1 Higher diversity of bacteria community associated with SI
Porites lutea(close-to sponge part, P
dI) ...58
3.2.2.2 Low diversity of bacterial community associated with
T. hoshinota...59
3.2.3 Comparing different bacterial communities ...63
3.2.3.1 Different composition between Chai-Kou and Kun-Guan seawater clone libraries...63
3.2.3.2 Different composition between SI and NSI
P. luteaclone libraries ...63
3.2.3.3 Similar bacterial communities associated with
T. hoshinotacovered on five different coral species ...64
3.3 Phylogenetic analysis ...68
3.3.1 Bacterial community associated with
P. lutea...68
3.3.2 Bacterial community associated with
T. hoshinota...70
3.4 Electronic microscopy of
T. hoshinota...79
4 Discussion...84
4.1 The role of bacterial community associated with
T. hoshinota...84
4.2 New species of
Cyanobacteriaassociated with
T. hoshinota...85
4.3 The composition of bacterial community associated
P. lutea...87
4.3.1 The role of
Cyanobacteriaassociated with coral ... 89
4.3.2 Variation of bacterial community associated with coral... 90
4.4 Future research...94
Reference 97
Appendix 107
Table Content
Table 1 Standard Systematically Describing Coral Disease/Syndrome... 24 Table 2 Coral diseases observed in Taiwan... 25 Table 3 Standard systematically description of black disease ... 25 Table 4 The bacteria taxonomy in samples based on 16S rRNA bacteria clone libraries
using RDP II analysis... 52 Table 5 Diversity indices for the bacterial communities (Porites lutea and seawater)... 60 Table 6 Diversity indices for the bacterial communities (sponge) ... 61 Table 7 Difference in bacteria 16S rRNA clone libraries composition... 65 Table 8 Difference in bacteria 16S rRNA clone libraries composition... 66 Table 9 16S rRNA gene sequence analysis of bacterial clones from the
non-sponge-infected Porites lutea ... 72 Table 10 16S rRNA gene sequence analysis of bacterial clones from the sponge-infected
Porites lutea (far-away sponge, PdH) ... 73 Table 11 16S rRNA gene sequence analysis of bacterial clones from the sponge-infected
Porites lutea (close-to sponge, PdI) ... 74 Table 12 16S rRNA gene sequence analysis of bacterial clones from Terpios hoshinota
(infected Porites lutea) ... 76
Figure Content
Fig. 1 Coral diseases observed in Taiwan ... 26
Fig. 2 A large area of coral reef was covered by the blackish mat... 26
Fig. 3 Different morphologies of corals were covered by the blackish mat. ... 27
Fig. 4 Close-up of black disease infecting Porites sp ... 27
Fig. 5 Close-up of sponge crust. ... 28
Fig. 6 Portions of tylostyle head (spicule). ... 28
Fig. 7 Transmission electron microscopy of T. hoshinota. ... 28
Fig. 8 Progress rate of T. hoshinota in Green Island... 29
Fig. 9 Scars on T. hoshinota suspected by fish bite ... 29
Fig. 10 News of black disease outbreak in Taiwan... 29
Fig. 11 P. lutea sampling procedure... 43
Fig. 12 T. hoshinota sampling procedure... 43
Fig. 13 T. hoshinota covering on four kinds of coral species. ... 43
Fig. 14 Bacterial community composition (according to Fig. 15A 16S rRNA-DGGE gel and cluster diagram)... 46
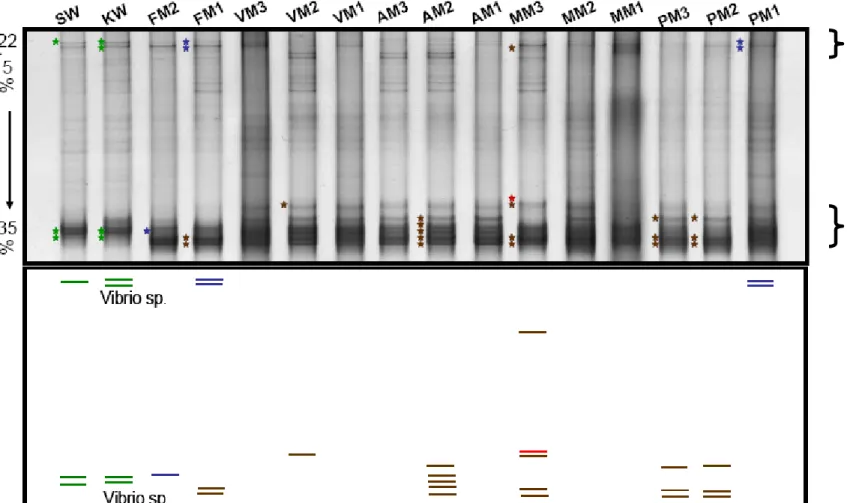
Fig. 15 Bacterial community composition on Porites lutea, Terpios hoshinota and seawater... 47
Fig. 16 Bacterial community composition (according to Fig. 17 16S rRNA-DGGE gel and cluster diagram)... 48
Fig. 17 Bacterial community composition in sponge-infected five different coral species ... 49
Fig. 18 Pie charts illustrating the diversity of bacterial groups on Porites lutea and seawater... 55
Fig. 19 Pie charts illustrating the diversity of bacterial groups on Terpios hoshinota.... 56
Fig. 20 Comparison of predominant bacterial community among samples ... 57
Fig. 21 Rarefaction curves for the 16S rRNA bacteria clone libraries (Porites lutea and seawater). ... 62
Fig. 22 Rarefaction curves for the 16S rRNA bacteria clone libraries (Terpios hoshinota collected from five coral species) ... 62
Fig. 23 Non-metric multidimensional scaling plot (nMDS-2 dimensional) of Porites lutea, Seawater... 67
Fig. 24 Non-metric multidimensional scaling plot (nMDS-2 dimensional) of Terpios hoshinota... 67
Fig. 25 Maximum parsimony tree of sponge-associated and black band disease related cyanobacteria based on 16S rRNA. ... 77
Fig. 26 Neighbor-Joining tree of Porites lutea -associated and seawater related bacteria based on 16S rRNA 78 Fig. 27 Terpios hoshinota infected coral Isopora palifera. Black arrow: close-to coral,
white arrow: far-away coral. ... 80
Fig. 28 Transmission electron micrographs of Terpios hoshinota ... 81
Fig. 29 Transmission electron micrographs of Cyanobacteria ... 82
Fig. 30 Transmission electron micrographs of Cyanobacteria membrane ... 83
Fig. 31 Transmission electron micrographs of cyanobacterial symbionts in Ircinia variabilis from Marseille. ... 96
1 Introduction
1.1 Coral reef ecosystem degradation and mortality
Coral reefs, the rain forests of the sea, are the most diverse marine ecosystems;
they not only provide the critically importance of the ecosystem goods but also
service to maritime tropical and subtropical nations (Moberg and Folke, 1999). Under
profound or uncertain threatening factors, however, world-wide coral reefs are in
serious decline; an estimated 30% coral reefs are already severely damaged and close
to 60% may be lost by 2030 as ever suggested by C. Wilkinson, 2002. As a result,
what are these threatening factors? These factors include natural factors, such as
hurricanes (alternatively typhoon or cyclones) attacking and global climate changing,
and detrimental anthropogenic factors, such as local habitat degradation, over-fishing,
pollutant rapidly accumulating, disease emerging, ocean eutrophication and increasing
population. All of these factors are contributing to the recent declines of coral reef or
to phase shifts in the coral reef’s community structure (Jackson et al., 2001; Hughes et
al., 2003; Bellwood et al., 2004).
1.2 Coral disease
Since the 1990s, an increase in coral disease has caused the changes in
composition and structure of tropical reefs (Aronson et al., 1998; Harvell et al., 1999),
most notably in the Caribbean (Green and Bruckner, 2000). In the Caribbean, the fast
emergence, high prevalence and virulence of coral diseases and syndromes are
detected. Moreover, the widespread geographic distribution and the frequent epizootic
events have already resulted in significant coral mortalities. On most of the Caribbean
reefs, loss of Acroporids is accompanied by an apparent ecological phase shift from
coral-dominated substrata to algal-dominated substrata (Hughes, 1994).
Frequent outbreaks of coral disease seemed closely related to anthropogenic
impacts including increased sedimentation and human sewage (Goreau et al., 1998).
In the Caribbean Sea, the environment is a relatively small, partially enclosed and
highly interconnected water body surrounded by dense human population. As
increasing human pollution in combination with impacts of global warming and rapid
currents in the basin all might facilitate the emergence and spread of pathogens and/or
spread of other stress agents that could affect the natural susceptibility/resistance of
coral reef organisms to their pathogens (Peter, 1997; Richardson, 1998; Harvell et al.,
1999; Rosenberg and Ben-Haim, 2002). Currently, diseases of coral have become one
of the most important factors in the decline of coral reefs throughout the entire region
(Porter et al., 2001; Weil, 2004). In addition, the number and distribution of coral
disease across the Indo-Pacific is also increasingly reported recent years (Rosenberg
and Loya, 2004).
1.2.1 Definition of coral disease
Coral disease is defined as “any impairment of a coral’s vital organ, system and/or
body functions”. This definition includes both infectious diseases caused by
biological parasites-pathogens and noninfectious diseases caused by genetic mutations,
malnutrition and/or environmental factors (Peter, 1997).
In general, the term “disease” is used for any affliction for which the causative
agent has been identified and “syndrome” for those afflictions for which the causative
agent is not known (Peter, 1997). Presently, however, the nomenclature to a coral
disease is yet clearly defined according such definition.
1.2.2 Microbial diseases of corals
More and more microbe-induced coral diseases (MICD) are reported particularly
in recent years and have become significant troubles, although non-microbial-induced
coral diseases , such as bleaching, has long been paid more attention in the early years.
To date, a number of MICD-related studies have been excised. Unfortunately only
few of coral specific pathogens are evidently and directly identified.
Part of the answer for why only few specific pathogens identified, some studies
pointed out that microbe were opportunistic colonization on unhealthy corals rather
than the specific, primary agent for the particular disease (Ainsworth et al., 2008).
From this point of the view, a considerable number of reported coral diseases actually
should be regarded as syndrome but not disease because their etiology remains
uncertain.
Etiology, the study of relationship between the host and disease-causing pathogen,
of biotic diseases has been concisely reviewed by Richardson (1998). She emphasizes
in the review that the fulfillment of Koch’s postulates, the procedure by which a
presumed disease pathogen is demonstrated to be the causative agent, has to be done
for most coral diseases, otherwise, they should just be regarded as potential disease
states rather than true diseases (Richardson, 1998). Indeed, a considerable number of
the most common diseases in Caribbean have not been verified with the Koch’s
postulates (Weil et al., 2006). Currently, only white band-II, white plague-II,
aspergillosis, white pox and bleaching of Oculina patagonica in the Mediterranean
Sea have fulfilled the Koch’s postulates (Weil et al., 2006).
1.2.3 Microbial-induced coral disease: two examples
The first coral disease was reported in 1965 and during the subsequent three
decades, only 4 new diseases were ever reported (Sutherland et al., 2004). To date, the
rate of discovery of new diseases has increased dramatically with more than 29 coral
diseases now described (Green and Bruckner, 2000; Rosenberg and Loya, 2004; Weil
et al., 2006) These diseases have been affecting at least 150 scleractinian, gorgonian,
and hydrozoan zooxanthellate species, but only 6 of them have been identified
etiologically (Rosenberg et al., 2007). Two characteristic examples of coral diseases,
black band disease and coral bleaching, are selected to represent the study progress of
microbes in coral diseases, in the coming paragraphs.
Black band disease (BBD), first reported by Antonius (Antouius, 1973), is now
distributed globally, affecting at least 25 Caribbean and 45 Indo-Pacific coral species
which mainly the massive-framework-building corals. (Frias-Lopez et al., 2004;
Sutherland et al., 2004; Weil, 2004). Symptoms of BBD can be recognized as a dark
band that moves across coral colonies destroying coral tissue. Rates of movement of
band across coral colonies have been reported of up to 2 mm per day in average and
can kill entire colonies in a matter of months (Rutzler and Santavy, 1983; Rutzler et
al., 1983). Active disease progress during the warm summer months were observed in
the field survey (Kuta and Richardson, 1996). Microscopic observation of BBD
revealed a complex microbial consortium including heterotrophic and photosynthetic
bacteria (Richardson, 1997, 1998). The recent progress in molecular techniques has
enabled molecular characterization of the bacterial community associated with BBD.
The BBD microbial community is dominated by filamentous Cyanobacteria whose
identity has been the subject of recent controversy (Cooney et al., 2002; Frias-Lopez
et al., 2002; Frias-Lopez et al., 2003; Sekar et al., 2006; Sussman et al., 2006; Myers
et al., 2007), sulfide-oxidizing bacteria proposed to belong to the genus Beggiatoa,
and a group of sulfate-reducing bacteria that includes members of the genus
Desulfovibrio. Moreover, more than 60 species of heterotrophic bacteria (Cooney et al., 2002; Frias-Lopez et al., 2002), and marine fungi (Ramosflores, 1983) were also
found in BBD. A hypothesis supported by a series of experiments has been
demonstrated that the mechanism of BBD is due to changes of microbial community
resulting in anoxic and sulfide rich microenvironment which in turn kill the coral
tissue (Carlton and Richardson, 1995). Many of these microorganisms have been
suggested as potential primary pathogens that cause BBD. However, Koch’s
postulates have not been fulfilled with any of the BBD consortium members. In the
research, Voss JD et al. discovered that the BBD community composition was
variable among different biogeographic areas (Voss et al., 2007). Therefore, although
a large number of studies have been made on searching for the primary pathogen of
BBD, the answer still remains unclear. Perhaps, instead of a single primary pathogen,
the BBD is actually due to polymicrobial infection (Richardson, 2004).
Coral bleaching, disruption of the symbiotic interaction between coral hosts and
the endosymbiotic algae, has been considered a disease because of the physical stress,
abnormal seawater temperature or salinity (Hoeghguldberg and Smith, 1989).
However, there were two cases of coral bleaching likely caused by bacterial infection
when the local seawater temperature turned warm (Kushmaro et al., 1998; Toren et al.,
1998; Ben-Haim et al., 2003). The first case was observed from the bleaching of
Oculina patagonica in the Mediterranean Sea. Koch’s postulates were successfully applied to demonstrate that Vibrio shiloi was the causative agent of the bleaching
disease (Kushmaro et al., 1996; Kushmaro et al., 1997). There were four steps
employed as follows to complete the Koch’s postulates of the bleaching of O.
patagonica. 1) The bacterium was isolated from all 28 bleached coral samples but absent from all 24 unbleached corals; 2) the bacterium was purely cultivated and
classified as a new species of Vibrio; 3) with controlled aquaria experiments, it
demonstrated that V. shiloi could cause bleaching of healthy corals. At 29℃, 120
bacteria/ml induced 60% bleaching of O. patagonica in 10 days and 100% bleaching
in 20 days. No bleaching occurred for several months under the same conditions if V.
shiloi was not added or if antibiotics were administered at the same time as the
inoculum. 4) Finally, V. shiloi was reisolated form the tissues of the infected bleached
corals (Kushmaro et al., 1997). Although the experimental procedures seemed
reasonable, two uncertainties were still hidden. Firstly, this bacterium failed to be seen
in the microbial diversity assays of the bleaching coral tissues (Ainsworth and
Hoegh-Guldberg, 2008). Secondly, the other research team has lately also proved no V.
shiloi involvement in the bleaching coral samples by fluorescence in situ hybridization and electronic microscopy (Ainsworth et al., 2008). Therefore, the
mechanism of microbe induced bleached coral is still inconclusive.
Another example was the bleaching of Pocillopora damicornis in the Indian
Ocean and Red Sea. Vibrio coralliilyticus was detected as the pathogen of bleaching
of P. damicornis (Ben-Haim and Rosenberg, 2002; Ben-Haim et al., 2003), but it has
not fulfilled Koch’s postulates.
1.2.4 The limitation of coral disease research
Although more researches of coral disease are emphasized today, coral diseases
remain unidentified. The epizootiology, etiology and pathology of coral pathogens are
poorly understood. Epizootiology is the study focus on local and geographic
distributions, environmental correlates, host ranges, prevalence, impact, vectors and
natural reservoirs, and spatial and temporal variability. Pathology is the study of
isolation and identification of the pathogen.
The reasons may be that the study of coral disease has suffered from a lack of
standardization in nomenclature of gross lesions. Many existing descriptions of coral
disease are ambiguous or open to subjective interpretation making geographic
comparisons problematic, particularly between oceans. According to the paper by
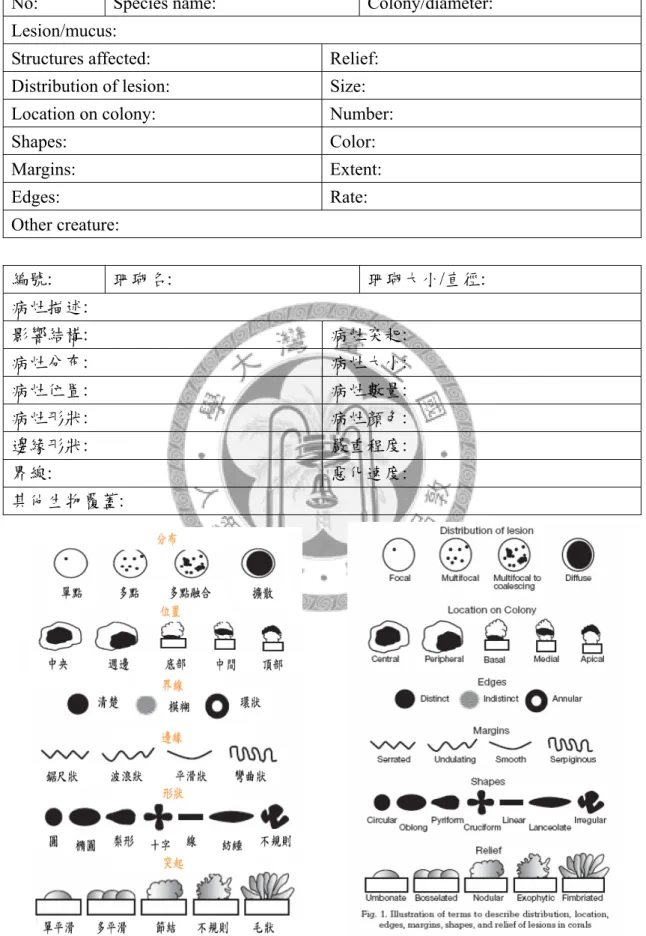
Work and Aeby, 2006, we designed the table (Table 1) to provide a structured
approach to describing gross lesions in corals and attempt to bridge the gap between
coral biology and veterinary pathology.
1.2.5 Coral disease studies in Taiwan
Coral communities around Taiwan are under severe stress from natural and
anthropogenic impacts (Dai, 1997). However, there is a lack of understanding about
the prevalence of coral diseases derived from the consequences of these impacts.
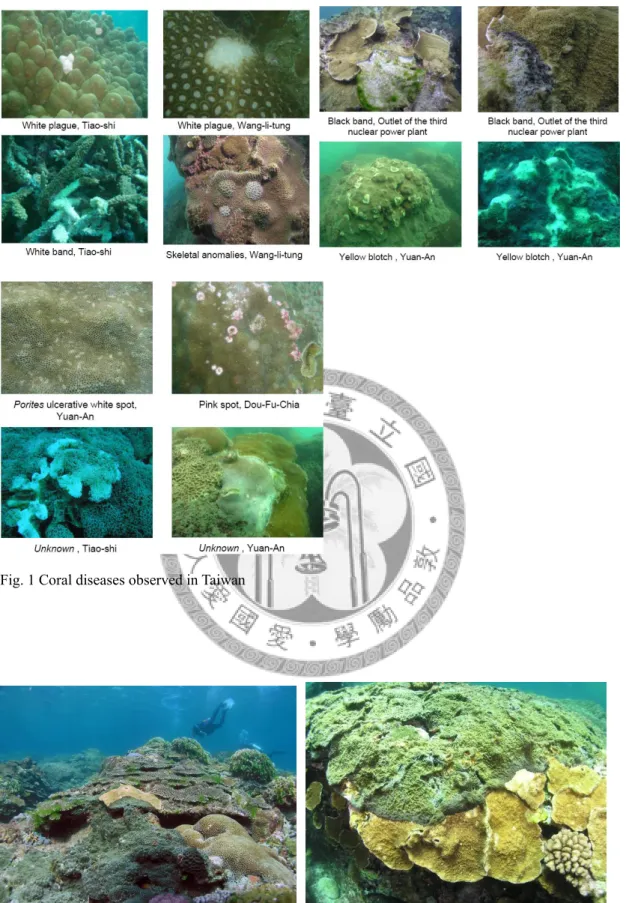
We have performed a qualitative survey of coral disease around Taiwan from July
2006 to September 2006 and July 2007. In this survey, systematic description (Table 1)
of the symptoms and syndromes of coral diseases are conducted around the coral reefs
and communities, including Dou-Fu-Chia, Ye-Liu in northeastern Taiwan, Yuan-An in
southwestern Taiwan, Wang-Li-Tung, Tiao-Shi, outlet of the third nuclear power plant
in south Taiwan and Green Island, an off-shore island. Eight previously described
diseases/syndromes, including black band disease, white plague disease, white band
disease, pink line/spot syndrome, yellow blotch disease, Porites ulcerative white spot
syndrome, skeleton anomalies and black disease were found in this preliminary
survey (Table 2 and Fig. 1). No significant disease outbreak was observed except
black disease in Green Island. Currently, quantitative surveys are been undertaking to
confirm these observations (personal communication with Dr. A. Chen).
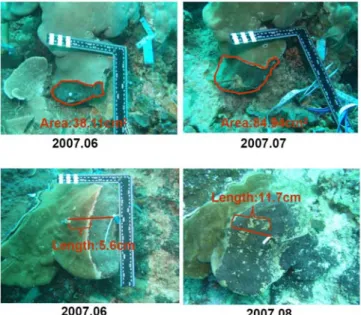
1.2.5.1 Black disease outbreak in Green Island
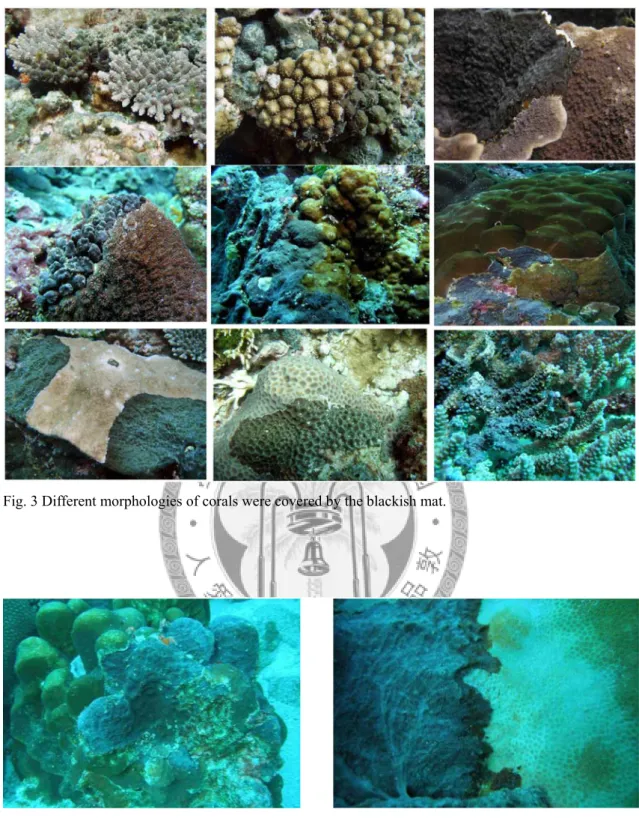
While conducting ReefCheck in 2006 at Green Island (Lyu-Dao in Chinese), off
the southeastern coast of Taiwan, a large area of scleractinian corals was observed to
have been overgrown by a blackish mat (Fig. 2), especially in the waters of Northern
Green Island, Chai-Kou (22°51.66'N; 121°48.83'E) and Kun-Guan (22°40.29'N;
121°29.17'E). This phenomenon was not reported in ReefChecks between 1998 and
2004 at Chai-Kou (Dai et al., 2005). However in 2006, 30% of the corals, regardless
of coral morphology, was overgrown by the blackish mat along a 100 m transect belt
(Fig. 3). The major distribution depth was 3 m to 20 m.
The corals once covered by this blackish mat die rapidly. Such phenomenon
therefore is suggested as a kind of coral disease, colloquially called “black disease” in
Okinawa (Table 3 and Fig. 4) (Rutzler and Muzik, 1993)
This blackish mat was a kind of sponge, Terpios hoshinota, distinguished by canal
system (astrorhizae, osculum) with more detailed researches (Fig. 5), lobed tyostyle
spicules (Fig. 6), encrusting morphology, black or dark brown color and associated
with the highly abundant cyanobacteria (Fig. 7) in a preliminary study. The progress
rate of this sponge was measured about 1 mm per day (Fig. 8). Similar characteristics
had been observed in the sponges in Okinawa (Ryukyus in Japan) and Guam (Bryan,
1973; Rutzler and Muzik, 1993).
1.2.6 Terpios hoshinota, “the coral killer sponge”
Sponges are important space competitors on coral reefs and are able to overgrow
living corals. An outbreak of T. hoshinota was reported to be a “black disease” that
killed and overgrowed live corals and is responsible for the death of large reef areas in
the Ryukyus (Japan) and Guam in the last century (Bryan, 1973; Plucerrosario, 1987;
Rutzler and Muzik, 1993). Furthermore, when the black disease has well colonized, it
could last for over a decade occupying the substrates and preventing the recruitment
of juvenile corals (Plucer-Rosario, 1987), and also weakened the carbonate skeleton
resulting in coral reef destroyed (Bryan, 1973). There were few studies on interaction
between T. hoshinota and corals. One study reported that sponge growing over live
corals was significantly faster than growing over non-living substrate; corals retracted
the tentacles and closed the stomodaea as sponge covered it suggesting T. hoshinota
may gain the nutrition from coral tissue (Bryan, 1973). However, there was a different
hypothesis from G. Plucer-Rosario, 1987. He compared the growth rate of T.
hoshinota between a living coral prong and an air-blasted prong. The sponge did not grow on the living coral prong in 11 out of 21 cases but grow faster on the air blasted
prong. This result supported that T. hoshinota kills the corals in competition for space
rather than for nutrients (Plucerrosario, 1987)..
Another interesting result was discovered by Teruya and his co-workers (2004)
that T. hoshinota actually contains toxic chemicals for competition. Two novel
cytotoxic alkaloid compounds, nakiterpiosin and nakiterpiosinone, were extracted
from the Okinawa sponge T. hoshinota (Teruya et al., 2004). This observation also
partially supported the competition hypothesis.
In addition, Bryan (1973) reported an intriguing observation that there were
“scars” on the sponge. In our field survey, we also notice the similar scars appearing
on the Green Island sponge (Fig. 9). Although there is yet no clue for this
phenomenon, it is speculated that the scars were caused by browsing fish feeding.
More research is required to verify the role of grazing reef fishes to the sponge, and to
evaluate whether these fishes could serve as controlling agents for T. hoshinota.
1.2.6.1 Biology of Terpios hoshinota
T. hoshinota, belongs to Phylum Porifera, Class Demospongiae, Order
Hadromerida, Family Suberitidae, and Genus Terpios. The morphology of this sponge is extremely thin (typically less than 1 mm thick) encrustations. The sponge is gray or
dark gray to brownish and black. Its canal system structure constitutes small oscula (3
mm) at the center of radiating, superficial exhalant networks (astrorhizae) and pores
(50-300μm) situating in the meshes of those vein networks (Fig. 5A). All spicules of
this species are tylostyles. The length and maximum shaft width of this tylostyle are
244.7μm and 3.0μm, respectively. All spicules are organized into radiating bundles
near the ectosomal region. A typically developed head (tyle) consists of four knobs
with axes perpendicular to each other and to the shaft. (Fig. 6A).
More interestingly, T. hoshinota harbors a massive amount of intercellular
unicellular zoocyanellae, which fills almost all of intercellular space in sponge tissue.
This zoocyanellae were identified as a kind of Cyanobacterium, Aphanocapsa
raspaigellae based on morphology. However, the morphological similarity remains questionable because of no thin sheath observed in the cyanobacteria but in
Aphanocapsa raspaigellae (Bryan, 1973; Plucerrosario, 1987; Rutzler and Muzik, 1993). Additionally the suggestion has no molecular phylogenetic evidence to
support.
Despite the symbiotic relationship between T. hoshinota and the cyanobacteria
remaining unclear, the fast-growing ability of T. hoshinota may be related to the
cyanobacteria. Most of the successful space competitors often harbor large quantities of photosynthetic microorganisms. It is likely that the growth potential of these
encrusting sponges is considerably enhanced by nutritional benefits derived from the
association with photoautotrophs (Rutzler and Muzik, 1993).
1.2.7 Symbiotic relationships between sponge and endogenous microbe
Sponges are sessile, filter-feeding organisms which, despite a simple body plan,
are remarkably efficient at filtering food from the surrounding water. Sponge also
develops intimate associations with other organisms because of its structure,
homogeneous, malleable and simple, but pervaded by canals. Sponges have likely
hosted associated microorganisms since the first appearance of the phylum over 500
million years ago (Wilkinson, 1984). The diversity of microorganisms known from
sponges was categorized in 14 recognized bacterial phyla (and one candidate phylum),
both major archaeal lineages, and assorted microbial eukaryotes (Hentschel et al.,
2003; Hentschel et al., 2006). In fact the ecological and physiological roles of these
microbes within sponges are mostly unclear, nonetheless most papers used the
terms ”symbiont” or “symbiosis” to describe the relationship between sponge and its
associated microbes.
Three decades ago, marine sponges might contain a specific microbe were noted
(Vacelet, 1975; Vacelet and Donadey, 1977; Wilkinson, 1978a; Wilkinson, 1978c,
1978b; Wilkinson, 1984). Based on electron microscopy and bacterial cultivation
studies, these pioneers of sponge symbiont research proposed the following three
broad types of microbial associates in sponges: 1) abundant populations of
sponge-specific microbes in the sponge mesohyl, 2) small populations of specific
bacteria occurring intracellularly, and 3) populations of nonspecific bacteria
resembling those in the surrounding seawater.
Although microbial communities can vary considerably among sponge species in
both cultivation or uncultivation-based studies, many diverse sponge species, even
from nonoverlapping geographic ranges, share a common set of unique, associated
microbes (Hentschel et al., 2002; Hentschel et al., 2006). Indeed, subsequent studies
have lent further weight to this notion (Thoms et al., 2003; Lafi et al., 2005; Hill et al.,
2006; Thiel et al., 2007). Furthermore, distinct microbial communities between
sponges and the surrounding seawater were demonstrated in some studies (Olson and
McCarthy, 2005; Schleper et al., 2005; Hill et al., 2006). These results indicate that
sponge-associated microbial communities are indeed unique and at least partially
sponge specific. Currently, the existence of sponge-specific microorganisms has
consequently become something of a paradigm in this field (Taylor et al., 2007).
In some sponge species, microorganisms account for up to 60% of the sponge
biomass (Wilkinson, 1978c, 1978b, 1978a;), exceeding seawater concentrations by
two to three orders of magnitude (Friedrich et al., 2001). Reiswig coined the term
“bacteriosponge” to describe sponge species with a significant biomass of
microorganisms (Reiswig, 1973). Two types of associations between microbes and the
host sponge were identified by Vacelet and Donadey according to 11 taxonomically
diverse demosponge species using transmission electron microscopy (TEM) (Vacelet
and Donadey, 1977). One is that sponges with dense tissues contain abundant, dense,
and morphologically diverse microbial communities (i.e. bacteriosponges) and
another is that sponge with well-irrigated tissues contain few bacteria and typically
only a single morphotype; these two sponge types have recently been called High
Microbial Abundance (HMA) sponges and Low Microbial Abundance (LMA)
sponges (Hentschel et al., 2006).
Sponge and the microorganisms living within and around them display the
different mechanism of interactions; for example microbes as parasitism which
sometimes resulting in sponge death, or microbes as the major food source for
heteroterophic sponges (Reiswig, 1975), or nutritional enhancements (Arillo et al.,
1993), and mutualistic interaction that bacteria produce the secondary metabolite
production to help defense of sponge (Unson et al., 1994; Schmidt et al., 2000).
The sponge-microbe interaction is likely depended on what function the bacteria
possess. In the coming sections, more details on the relationship between sponge and
phototrophic or heterotrophic microbes are described.
1.2.7.1 Sponges as hosts of single-celled autotrophs
Photosynthetic single-celled organisms, from Cyanobacteria to dinoflagellates,
are common symbionts of sponges and have been demonstrated to be beneficial in a
wide variety of taxa. All of over 100 sponge species found to host Cyanobacteria are
in only 26 of the 72 recognized demosponge families. Four genera (Aplysina,
Xestospongia de Laubenfels, Dysidea, Theonella Gray) are particularly rich in these associations, with 5-10 species in each genus hosting Cyanobacteria (Diaz and Ward,
1999). Filamentous Cyanobacteria have been documented in the dictyoceratid
Oligoceras violacea in the Caribbean (Rutzler, 1990) and Dysidea herbacea on Great Barrier Reef (Hinde et al., 1999). In both cases, the proportion of cyanobacterial
biomass to overall biomass was particularly high, in O. violacea as much as half of
the total cell volume of the association.
Many Cyanobacterium-containing species, flattened shapes, allowed optimal light
reception for their photosynthetic symbionts (Wilkinson, 1983). Substantial
differences are in the proportion of photosymbiont-harboring sponge species, near
shore (0%), middle distances from shore (20%-64%), far from shore (5%-90%) on the
Great Barrier Reef. This observation suggested that these reflect differences in the
nutrient content of the ambient water and therefore the relative ability of sponge to
support themselves solely through filter feeding or photosymbiont (Wilkinson, 1987).
As a result, the photosymbiont-harboring sponges more rely on the nutrient from
photosymbiont. This idea was also emphasized with a study that shading of
Lamellodysidea chlorea (sponge)-Oscillatoria spongeliae (filamentous
Cyanobacterium) association for two weeks resulted in loss of 40% of sponge area covered by shaded individuals, indicating dependence of the host sponge on these
symbionts (Thacker, 2005). Another study showed the sponge Chondrilla nucula
underwent metabolic collapse and thiol depletion in dark conditions for 6 months. The
reason was that symbiotic Cyanobacteria participated in controlling the redox
potential of the sponge host cells by the transfer of reducing equivalent (Arillo et al.,
1993). Therefore, metabolic integration is also important relationship between
symbiotic Cyanobacteria and sponges. Moreover, there is evidence that secondary
metabolic production is produced by symbiotic photosynthetic Cyanobacteria in
Dysidea herbacea (Unson et al., 1994).
High degree of host specificity and potential coevolution between symbiotic
Cyanobacteria and their host sponges were demonstrated by phylogenic construction (Thacker and Starnes, 2003). Coevolution of sponges and Cyanobacteria is further
indicated by vertical transmission of symbionts in Chondrilla australiensis, via
incorporation into eggs (Usher et al., 2001) or via the unusual giant larvae in Svenzea
zeai (Rutzler et al., 2003). Understanding of diverse relationship between sponge and symbiotic Cyanobacteria could offer more sponge ecology information.
The other symbiotic autotroph cell is dinoflagellate. Rutzler has pointed out one
curious pattern that dinoflagellates (zooxanthellae) in sponges inhabit primarily
excavating sponge species in the order Hadromeria (Rutzler, 1990). Rich brown
colors, ranging from the golden medium brown of Cliona varians to an almost black
brown in Cliona caribbaea indicate excavating species can be packed with
zooxanthellae. Zooxanthellae had positive influence on growth rate of Cliona viridis
(Rosell and Uriz, 1992) and may be coopted by sponge as sponge kills coral with
producing alkaloids (Wulff, 2006).
1.2.7.2 Sponge as hosts of heterotrophic single-celled microbes
Heterotrophic prokaryotes appear to be ubiquitous symbionts of sponges, even
though sponges are efficient consumers of bacteria (Reiswig, 1971, , 1973; Pile et al.,
1997). An enormous variety of heterotrophic bacteria, including representatives of
seven divisions, has been identified by comprehensive surveys using 16S rRNA
sequences. Three divisions were described as follows.
Archaea are the second well-understood sponge-associated microbial lineage next to the Cyanobacteria. Marine sponge-associated Archaea, Cenarchaeum symbiosum,
was originally discovered by Preston et al., 1996. The worldwide distribution of the
sponge-specific C. symbiosum clade (Webster et al., 2001; Margot et al., 2002; Lee et
al., 2003) resembles the similarly cosmopolitan distribution of the free living marine
Crenarchaeote group I. This phenomenon suggests that a free-living form of this archaeal sponge symbiont clade exists which is able to persist in sponges following
uptake by filtration.
Proteobacteria, the complex picture of proteobacterial diversity within sponge was discovered using molecular phylogenetic method. More than two-thirds of the
thousands of cultivated isolates from deep water and boreal sponges and other
invertebrates belonged to the Alphaproteobacteria and Gammaproteobacteria
(Graeber et al., 2004; Sandell et al., 2004) and Gammaproteobacteria dominated
among the nearly 2000 isolates from Halichondria panacea (Imhoff and Stöhr, 2003).
A sponge-specific gammaproteobacterial cluster showed closest homology to the
ammonia-oxidizing Nitrosococcus clade, especially in mangrove sponges (Hentschel
et al., 2006).
Actinobacteria, the phylum attracting scientist’s eyes, are prolific secondary metabolite producers, which has obvious implications for natural products and drug
discovery. Three sponge-specific actinobacterial clusters were described in Theonella
swinhoei and Aplusina aeropoba and further extended to Scleritoderma spp. from deeper waters. Bioactive Salinospora previously only known from marine sediments
(Kim et al., 2005) was isolated from the Australian sponge Pseudoceratina clavata.
One indication of the possibility of tight coupling between host sponges and their
symbionts is the similarity of symbiotic bacteria over time, even after 11 days of
starvation or antibiotic treatment of their sponge hosts (Friedrich et al., 2001). A
hypothesis of co-speciation of sponges in the order Halichondrida and their bacterial
symbionts has been supported by comparative phylogenetic analysis based on the
gene coding for cytochrome oxidase subunit I (COI) (Erpenbeck et al., 2002).
The difficulty of culturing heterotrophic prokaryote sponge symbionts renders
determination of their function in their host extremely challenging. Nitrifying
symbionts add significant amounts of biologically meaningful nitrogen to tropical
shallow benthic communities (Diaz and Ward, 1997). A variety of possible functions
of prokaryote symbionts in sponges was listed by Hentschel et al., 2003. However, in
most cases what the symbiosis provides for the sponges is largely mysterious, though
these may be ancient associations.
1.3 Aim of this thesis
“Black disease” outbreak in the waters of Northern Green Island has been widely
reported in several major Taiwan’s newspapers (Fig. 10). This outbreak has also been
highly paid attentions by the government, public and academic. Green Island not only
is one of the hottest tourist point in Taiwan but also has recently been suggested to be
upgraded onto a national reservation park because of its highly abundant in- or
off-land’s biodiversity and beautiful off-shore ecosystems. To combat this disease, an
integrated research team has been formed by Construction and Planning Agent,
Ministry of the Interior, in 2007, and is expected to obtain relevant information about
this disease in a short time which will be helpful for disease control and prevention.
To be the member of this integrated team, we focus on understandings of the black
disease associated microbes. As discussed above, the microbes play a crucial role on
coral and sponge. The relationship of microorganism associated with sponge and coral
is ranging from mutual benefit to parasitism and disease. Therefore, understanding the
microbial community is important to explain the ecological interaction between T.
hoshinota and corals. Hence, in this thesis, we would like to investigate the diversity and distribution of the microbial community of the “black disease” using
culture-independent molecular techniques revealed a previously unseen microbial
diversity that encompasses an estimated >99% of the total microbial community of a
given sample (Imhoff and Stöhr, 2003). Two goals are addressed as follows.
1) Identify the microbial community associated with Terpios hoshinota, and find out
the major microorganisms in this sponge.
2) Realize variation of coral associated microbial community, and compare the
difference of microbial community between healthy coral and unhealthy coral
(sponge-infected). Furthermore search for any particular microbe(s) can be used
as a bioindicator of unhealthy coral.
Table 1 Standard Systematically Describing Coral Disease/Syndrome, according to Work and Aeby, 2006
No: Species name: Colony/diameter:
Lesion/mucus:
Structures affected: Relief:
Distribution of lesion: Size:
Location on colony: Number:
Shapes: Color:
Margins: Extent:
Edges: Rate:
Other creature:
編號: 珊瑚名: 珊瑚大小/直徑:
病灶描述:
影響結構: 病灶突起:
病灶分布: 病灶大小:
病灶位置: 病灶數量:
病灶形狀: 病灶顏色:
邊緣形狀: 嚴重程度:
界線: 惡化速度:
其他生物覆蓋:
(Work and Aeby, 2006)
Table 2 Coral diseases observed in Taiwan
Location Disease
Ye -L iu Dou-Fu- Yu an -A n W ang-Li- T ung T iao-Shi Outlet of the third nuc le ar power plant Green Islan d
Black band V
Black disease V V
Skeletal anomalies V V
White plague V V V V V
Whit band V V
Skeleton eroding
Pink line/spot V V V
Porites ulcerative white spot V
Dark spot
Yellow blotch V
Unknown V V V
Table 3 Standard systematically description of black disease
編號: 珊瑚名:Porites 珊瑚大小/直徑: 30 cm
病灶描述: 黑色薄膜覆蓋珊瑚,覆蓋處珊瑚死亡,交界處產生白化 影響結構: 侵蝕珊瑚蟲(無侵蝕骨骼,
但骨骼易碎)
病灶突起: 突起不規則(厚度約 1-3 公 厘)
病灶分布: 頂部、側邊 病灶大小:最大直徑 15 公分
病灶位置: 擴散 病灶數量:1(ㄧ大片)
病灶形狀: 不規則 病灶顏色: 黑色、墨綠、灰色
界線: 清楚 嚴重程度: 50%
邊緣形狀: 波浪狀 惡化速度: 1 公厘/天
其他生物覆蓋: 部分有藻類覆蓋,但大部分無
Fig. 1 Coral diseases observed in Taiwan
Fig. 2 A large area of coral reef was covered by the blackish mat.
Fig. 3 Different morphologies of corals were covered by the blackish mat.
Fig. 4 Close-up of black disease infecting Porites sp
.(Systematic descriptions in Table 3)
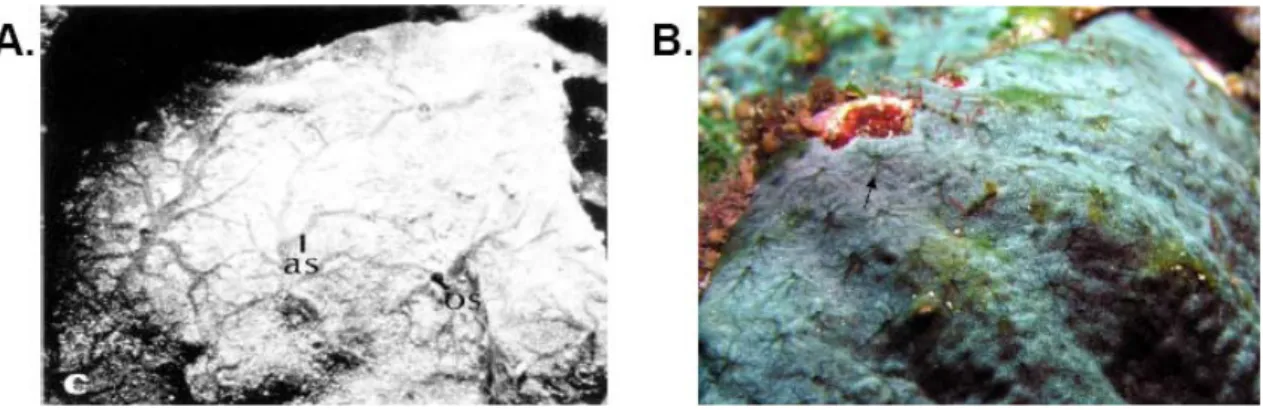
Fig. 5 Close-up of sponge crust.
A. as: astrorhizae, calcareous skeletons, superficial exhalant networks, os: oscula (3 mm, discernible in the field and center of radiating), Terpios hoshinota from Rutzler and Muzik, 1993. B. oscula like structure (black arrow), sponge specimen from Green Island.
Fig. 6 Portions of tylostyle head (spicule).
A. Scanning electron micrograph, Terpios hoshinota from Rutzler and Muzik, 1993. B. electron micrograph, sponge specimen in this study.
Fig. 7 Transmission electron microscopy of T. hoshinota.
A. zoocyanellae in choanosome (ds: dividing stage of zoocyanellae, sc: sponge cells), Terpios
hoshinota from Rutzler and Muzik, 1993. B. zoocyanellae like cells in dividing stage (white arrow),
sponge specimen from Green Island.
Fig. 8 Progress rate of T. hoshinota in Green Island.
Fig. 9 Scars on T. hoshinota suspected by fish bite
Fig. 10 News of black disease outbreak in Taiwan
2 Materials and Methods
2.1 Sampling
In order to reveal the specificity of microbial community associated with Terpios
hoshinota, Fourteen specimen of T. hoshinota covered on five different coral species 3
Montipora efflorescens (MM), 2 Millepora sp.(FM), 3 Porites lutea (PM), 3 Favia
complanata (VM), 3 Isopora palifera (AM) colonies were collected from Chai-Kou (22°51.66'N; 121°48.83'E) and Kun-Guan (22°40.29'N; 121°29.17'E), Green Island in
July 2007. The coral sampling strategy is to include the sponge-infected corals (SIC)
and the non-sponge-infected corals (NSIC) for the comparison of the microbial
community. Surrounding seawater was collected as a control for microbial diversity
analyses.
While all sponge and coral samples were collected underwater, the samples were
immediately placed in sterile 50 ml polypropylene centrifuge tubes. Back to the shore,
each sample was washed twice with 0.2 μm filtered and autoclaved seawater to
remove any loosely associated microbes. The detailed strategies for coral, sponge, and
seawater sampling are described respectively in the following sections.
2.1.1 Seawater sampling
One liter seawater was collected from 10 cm above the coral colonies using the
sterile Sanko high density polyethylene bottles in both sampling sites. The samples
were kept on ice and stored at -20 0C as soon as returned to the field station. Seawater
samples were filtered through sterile 0.22 μm pore diameter filters, Millex-GS
(Millipore, USA). The microbes retained on the filters were collected for DNA
extraction.
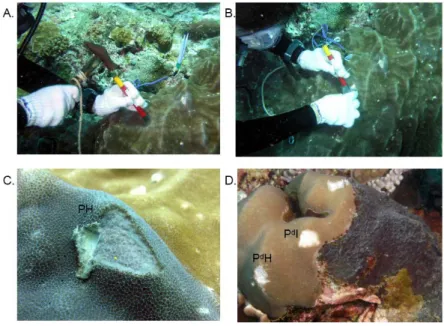
2.1.2 Coral sampling
2 cm diameter corers of the surface tissues and underlying skeleton to a depth of
0.5-1 cm were collected using a pair of hammer and chisel. Three SI and three NSI
colonies of Porites lutea (PH) were collected, respectively (Fig. 11). These coral
colonies lived at 6 m depths and were separated from each other by a distance of at
least 10 m. In each of the SIC colonies, two separated parts were sampled. These two
parts are the distal part (PdH) (an area of the coral colony away from the sponge
region) and proximal part (PdI) (an area of the coral colony about 5 cm close to
sponge). The samples were kept at 4 0C and transported back the field station less than
2hr, and stored in 100% ethanol at -20 0C until process.
2.1.3 Sponge sampling
T. hoshinota was collected using a pair of forceps or a 30ml sterile syringe (Fig.
12). Sponge specimens were taken from sponges covered on five kinds of coral
species (Fig. 13). The samples were kept at 4 0C and transported back a field station
less than 2h, and stored in 100% ethanol at -20 0C until use.
2.2 Electron microscopy
Small pieces of sponge tissue (c.f. 1 cm diameter) were fixed in 2.5%
glutaraldehyde and 4% paraformaldehyde in 0.1M phosphate buffer and stored
overnight at 4 0C for 24 hr. Fixed samples were rinsed with phosphate buffer 3 times,
each time for 15 minute, placed in 1% (w/v) osmium tetroxide solution (prepared in
0.1M phosphate buffer) at room temperature for 4 h, and rinsed again with phosphate
buffer 3 time for 15 min. Before embedded in Spurr’s resin, samples were
subsequently dehydrated in a graded acetone series [30%, 50%, 70%, 85%, 95% and
100% (v/v) acetone]. For each concentration the dehydration was lasted for 20min.
Sections were cut with a LEICA EM UC6 and stained with 5% (w/v) uranyl acetate in
methanone followed by 0.5% (w/v) lead citrate. Sections were mounted on 50 mesh
copper grids coated with Formvar. Samples were visualized by transmission electron
microscopy.
2.3 Molecular Method for bacterial library construction
In this thesis, two molecular techniques, 16S ribosomal RNA (rRNA) library
construction and denaturing gradient gel electrophoresis (DGGE), were applied to
identify the bacterial community associated with sponges, corals and seawater. The
16S rRNA gene is a common phylogenetic marker which enables to determine the
phylogenetic position of bacteria and helps to clarify which groups of bacteria in an
ecosystem and to assess the bacterial diversity.
2.3.1 DNA extraction
Total DNA was extracted using modified standard phenol–chloroform procedure
(Appendix 1) (Wilson, 1997) incorporating a grinding step in liquid nitrogen to lyse
the cells mechanically. Frozen coral and sponge samples with liquid nitrogen were
homogenized to a fine powder using sterile pestle and mortars. Ground sample in
alcohol was transfer to a 1.5 ml sterile tube and centrifuged at 13,000 rpm for 5 min.
The top alcohol layer was removed. The pellet was resuspended and votexed in 1 ml
TE buffer and then centrifuged at 13,000 rpm for 5 min. The supernatant was
discarded and the pellet was washed in TE buffer again. This procedure was repeated
three times and the pellet was ready for DNA extraction. The pellet was resuspended
by 500 μl of Lysis buffer and added 30 μl of 10% SDS, 3 μl of 20 mg/ml proteinase K.
The mixing sample was vortexed and kept at 37 0C for 1 hr. After that, the mixing
sample was added 100 μl of 5M NaCl and 80 μl CTAB/ NaCl solution (Dissolve 4.1g
NaCl and 10g of CTAB to 100ml). The mixing samples were vortexed and kept at 65
0C for 10 min. The supernatant was collected to two new Eppendorfs. 500 μl
chloroform/isoamyl alcohol (24:1) was added in each tube and gently shaken for1 min.
The mixing sample was centrifuged at 13,000rpm at 4 0C for 5 min. The top aqueous
layer was collected in a new sterile tube with equal volume of
phenol/chloroform/isoamyl alcohol (25:24:1) by vortexing and gently shaking for 1
min. The liquid phase was collected to a new sterile tube after the mixing sample was
centrifuged at 13 000 rpm at 4 0C for 5 min. The supernatant was extracted with an
equal volume of chloroform/iso-amyl alcohol (24:1) by vortexing and centrifuged at
13 000 rpm for 5 min at 4 0C. The supermentant was removed to new tube with
adding 0.6 volume isopropanol and slowly mixed. The mixture was centrifuged at 13
000 rpm for 7 mins, the supernatant was then discarded and the pellet was washed
with 70% pre-chilled ethanol. The pellet was air dried and suspended in 30 ml sterile
Milli-Q water. Made 2 μl aliquot DNA samples in each PCR tube. The aliquot sample
was used for only once for avoiding DNA degradation result from repetitively taking
a DNA sample in-and-out of freezer. Extraction of DNA from corals would also
co-extract humic and phenolic materials that might inhibit PCR. To remove these
interference factors, DNA was subsequently re-extracted by QIAamp® DNA Mini Kit
(Qiagen) for further purification.
2.3.2 Amplification of bacterial 16S ribosomal rRNA by polymer chain reaction
Two molecular methods were used to study the bacterial community in the
specimens. One is that using universal bacteria primers 27F (5’-AGA GTT TGA TCM
TGG CTC AG-3’) and 1492R (5’- TAC GGY TAC CTT GTT ACG ACT T-3’) (Lane,
1991) for constructing clone library. Universal bacterial primers were used for
amplification of the 16S rRNA genes from extracted genomic DNA of seawater, coral
and sponge samples. A total of 1465 PCR product were obtained. The other method
was denaturing gradient gel electrophoresis (DGGE). 16S rRNAs were amplified with
DGGE-specific, bacterial primers 341F-GC (5’-CGC CCG CCG CGC GCG GCG
GGC GGG GCG GGG GCA CGG GGG GCC TAC GGG AGG CAG CAG-3’) and
907R (5’-CCG TCA ATT CMT TTG AGT TT-3’) (Sanchez et al., 2007). A 40-bp rich
GC clamp was attached to the 5'end of the 341F primer to stabilize the melting
behavior of the DNA fragments during running DGGE. These primers amplify a
606-bp section of the 16S rRNA genes of members of the domain Bacteria.
16S rRNA genes were amplified in a 50 μl reaction mixture consisting of 5 μl of
10× PCR buffer, 1 μl of a 2.5 mM total deoxynucleoside triphosphate mixture, 2.5 μl
of 10 μM each primer, 1 μl of template DNA, and 1.2 U of DyNAzyme EXT DNA
polymerase (FINNZYMES, Finland), according to the conditions recommended by
the manufacturer. Amplification conditions for the bacterial library PCR consisted of
an initial denaturation step of 94 0C for 5 min, followed by 35 cycles of 94 0C for 30
sec, 55 0C for 30 sec, and 72 0C for 1.5 min. This was followed by a final step at 72
0C for 10 min and cooled at 4 0C. DGGE PCR amplification conditions consisted of
an initial denaturation step of 94 0C for 5 min, followed by 30 cycles of 94 0C for 30
sec, 46 0C for 30 sec, and 72 0C for 1 min and a final extension step of 72 0C for 10
min, then cooled at 4 0C.
All PCR reactions were performed on a PxE Thermal Cycler (Thermo Electron
Corporation, USA). The PCR products were checked using electrophoresis and
visualised using a UV trans-illuminator, ImageQuant 300 (GE Healthcare, USA).
2.3.3 Clone library construction
The PCR products of bacterial 16S rRNA were purified using the QIAquick gel
extraction kit (Qiagen, USA) for cloning. The purification procedure is followed
using the manufacture’s instruction
(http://www1.qiagen.com/literature/handbooks/literature.aspx?id=1000252). Finally
the DNA was recovered in 20 μl sterile Milli-Q water (Q-Gard 1 Purification Pack,
Millipore). The purified PCR products were ligated into TOPO-TA cloning vector
(TOP10 genotypes of E.coli strain) by the invitrogen manufacturer’s instructions
(http://www.invitrogen.com/site/us/en/home/brands/Product-Brand/TOPO-PCR-Cloni
ng/TOPO-TA-Kits-Selection-Guide.reg.tw.html). Positive colonies were selected by
blue and white screening on Luria Bertani agar plates with ampicillin (50 μg/ml),
IPTG (0.5 mM) and X-Gal (50 μg/ml). For finding the successful clones, each
positive colony was examined by PCR with M13 forward (5’-GTA AAA CGA CGG
CCA G-3’) and reverse primers (5’-CAG GAA ACA GCT ATG AC-3’). The
ampilification condition is the same as that with bacteria universal primer PCR
condition (see section 2.3.2). Reaction products were checked using DNA agarose
electrophoresis and visualized using a UV trans-illuminator.
To avoid the cloning bias, we therefore followed the bellow process to reduce the
bias. In each transformation plate, the number of positive colonies (i.e. white colonies)
must over 1000 (10-20 μl transformation solutions) which guarantees the
transformation efficiency sufficient. According to a random number created by
Microsoft Excel, we then randomly picked 30 white colonies from 100 white colonies
for sequencing (Singleton et al., 2001).
2.3.4 Denaturing gradient gel electrophoresis analysis
Denaturing gradient gel electrophoresis (DGGE) analysis was performed using the
D-Code universal mutation detection system (Bio-Rad Laboratories, USA). The equal
concentration (60 ng) of PCR products were loaded onto 7% (w/v) polyacrylamide
gels run in 1× TAE buffer. A 22.5–35% linear gradient of urea and formamide was for
16S rRNAs from sponge samples and a 22.5–45% linear gradient was for 16S rRNAs
from coral samples. The linear gradient range was decided by the result of
perpendicular gel which contained 0 to 80% denaturant. The gel was prerun at 60 0C,
130V for 15 min. Samples were electrophoresed at 60 0C, 130V for 7 hr. After
electrophoresis, the gels were washed three times by Milli-Q water for 5 min and
visualized using silver staining. The silver staining composed of the following steps: 1)
gel was soaked in 200ml solution of 0.1% AgNO3 and slowly shaken for 20 min. Gel
was washed once with Milli-Q water for 5 min. 2) gel was soaked and slowly shaken
in 200 ml of the developing solution ( 3.0g of NaOH, 0.02g of NaBH4, 0.8ml of
formaldehyde) for 10 min. Gel was washed once with Milli-Q water for 5 min. 3) gel
was soaked and slowly shaken in 200 ml stop solution (0.75% Na2CO3) for 5min. 4)
Finally, the gels were washed with Milli-Q water and dried at room temperature. All
reactions were kept at 27 0C avoiding chemical sedimentation as low temperature
(<25 0C)
2.3.5 Recovery of DNA from DGGE gel
From 16S rRNA-DGGE gels, distinct bands were excised from the dried gels
using sterile blades and were rehydrated by placed in 10 μl of sterile Milli-Q water for
1 hr to elute DNA (Chalhoub et al., 1997). The bands were re-amplified by PCR with
16S rRNA- primers 341F and 907R. The PCR products were checked by
electrophoresis and sequenced.
2.3.6 Sequencing and phylogenetic analysis
The amplified 16S rRNA was purified using the Plasmid DNA Extraction kit
(Viogene, Taiwan) and its partial sequences (650–700 bp) were obtained using the
27F primer. The sequencing works were completed by Mission Biotech
(http://16318279.boss.com.tw/show_page.asp?income=16318279) using ABI 3730
XL DNA Analyzer (Applied Biosystems, USA), and the sequencing reagents was the
ABI Prism BigDye Terminator Cycle Sequencing Ready Reaction Kit, V3.1 (Applied
Biosystems, USA).
2.3.7 Bacterial group assignment
Sequence cluster and approximate phylogenetic affiliations were characterized by
software of the Ribosomal Database Project II (http://rdp.cme.msu.edu/) (Maidak et al.
1996).
2.3.8 Diversity estimation in DOTUR
We calculate various diversity indices and richness of microbial diversity within
each clone library of coral, sponge, and seawater samples using DOTUR software
package (http://www.plantpath.wisc.edu/fac/joh/dotur.html) (Schloss and Handelsman,
2005). The results perform the number of sequences and their identity in each OTU as
a function of distance. Basically we grouped those sequences that had >97% sequence
identity together by DOTUR. However, 99% as threshold value for species
identification of bacteria associated with sponge, because the variation of sponge
bacterial sequences was small. DOTUR calculates richness indices including the
Shannon-Weaver, the full bias corrected Chao1, abundance-based coverage estimator
(ACE) and evenness indices including Simpson’s eveness indices. The sampling
completeness which how many sequences are required to obtain a desired level of
precision was estimated by the rarefaction curve.
2.3.9 Sequence library comparison
LIBSHUFF analyses (http://libshuff.mib.uga.edu) (Singleton et al., 2001) were
employed to compare clone libraries created from the different parts of corals, sponge
and ambient seawater samples to establish levels of similarity in the bacterial 16S
rRNA gene diversity. Moreover, the sequences representing OTUs from different
samples clone libraries were analyzed using non-metric multidimensional scaling
(nMDS) ordination and the relationships among samples are represented in plots of
the first two dimensions of the nMDS solution. Primer-E, a statistical tool, was used
for nMDS analysis (Clarke and Ainsworth, 1993)
2.3.10 Phylogenetic analyses
Phylogenetic analyses were conducted using MEGA version 4 (Tamura et al., 2007).
Sequences were aligned with similar sequences of cultured organisms and
environmental clones obtained from GenBank using a Clustal W algorithm in the
MEGA version 4 (http://www.megasoftware.net/). Cloned cyanobacteria sequence
from sponge were aligned with other sponge associated cyanobacteria (Steindler et al.,
2005) . Tree topologies were inferred from aligned sequences using neighbour-joining
(Saitou and Nei, 1987) and maximum parsimony methods (Nei and Kumar, 2000).
Evolutionary distances matrices were generated as described by Jukes and Cantor
(Jukes, 1990). The robustness of inferred tree topologies was evaluated after 1000
bootstrap resamplings of the neighbour- joining and maximum parsimony data.
2.3.11 DGGE Cluster analysis
For 16S rRNA-DGGE banding patterns, the software program AlphaEase FC
version 4.2.0 (Alphalnnotech, San Leandro, CA, USA) was used to make a similarity
matrix based on presence or absence of aligned bands from different lanes in a gel.
Moreover, the distance matrix and cluster analysis was used Pearson Coefficient
(Symonds, 1926) and UPGMA method (Prager and Wilson, 1978).