國立臺灣大學公共衛生學院職業醫學與工業衛生研究所 碩士論文
Graduate Institute of Occupational Medicine and Industrial Hygiene College of Public Health
National Taiwan University Master thesis
大氣中真菌孢子與氣喘急診之相關性
Association Between Ambient Fungal Spore Concentrations and Emergency Asthma Visits
蔡宜秦 Yi-Chin Tsai
指導教授﹕郭育良 博士、吳章甫 博士 Advisor: Yue-Lian Guo, Ph.D., Chang-Fu Wu, Ph.D.
中華民國 105 年 7 月
July, 2016
誌謝
是理想,是實現,是抱負,那引領著我通過接二連三的考驗與挫敗,而蛻變成 準備展翅飛翔的鳳凰。
首先,要感謝指導教授 郭育良博士,於學生求學期間耐心的指導與包容,不 論於研究上或處事態度皆給予莫大的助益,令學生沒齒難忘,對於任何事嚴謹的 自我要求,是學生的楷模。感謝吳章甫老師、黃耀輝老師與張靜文老師於研究論 文上不吝給予指導。感謝趙馨老師給予專業的意見以及鼓勵與關心。除此之外,
研究期間於每次會議報告上,感謝實驗室每位聆聽者的支持並且提供各個不同面 向的見解。尤其感謝 Bird,從領導我熟悉微生物的領域,直至論文之撰寫,皆花 了許多時間及心力。另外,特別感謝秉鈺學姊、恩民學長、世群學長、怡蓁學姊 及紘彰學長,不論於研究架構、實驗設計的規劃、統計分析甚或報告的技巧,因 為您們的幫助讓我的研究更臻完美,讓我的技術更上一層樓。也要感謝實驗室的 夥伴-黃聖厷,一起歷經了採樣的日曬雨淋,鑑菌到頭暈的夜晚,讓我的研究生 活沒有那麼孤單。
科技的進步,縮短了人類心靈上的距離,使得家人對於在異鄉求學的我能更放 心,諒解我無法時常返鄉,於本分與親情之間之取捨,也使我更珍惜每次之相聚。
感謝我的父親 蔡勝川、母親 葉明娟、長姊宜珊與幼弟宜庭,使我無後顧之憂,
專注於研究,包容我有時的任性及情緒。最後要感謝大嬸時代,尤其一起在公衛 大樓的各位,真的是給了我很多心靈上的支持。感謝李佳穎,曾經的台北家人,
即使分隔兩地,我們仍陪伴在彼此身旁,分享彼此的喜怒,感謝你每次幫我解決 大大小小的危機,一起度過一個又一個的考驗,最終好不容易一起走到了這個里 程碑。感謝趙敏,在我每個沒睡覺的夜晚,不停讓我保持清醒的腦袋,承擔了我 的歇斯底里,對我總是信心十足,鼓勵我走完了這趟研究旅程。
能夠擁有這份成就,是許多人的幫助,才有了今天的果實。要感謝的人實在太 多,不及備載,僅以此篇研究獻給二十幾年來啟發我、幫助我的每一位。我會繼 續抱著謙虛的態度,走向未來。「唯有放下台大,才能超越台大」。
中文摘要
研究背景:據文獻指出,2010 年約有三億人口受氣喘影響。先前的研究顯示暴露 高濃度生物氣膠,與過敏、肺功能下降及其他不良之健康影響有關。生物氣膠包 含花粉、真菌孢子及動、植物所產生的細胞碎片。而本篇研究主要想了解不同年 齡層其氣喘發作之季節性,及真菌孢子與氣喘發作之相關性。
研究方法:空氣採樣使用 Burkard-7-day 於古亭國小三層樓高之屋頂處(同環保
署空氣品質監測站地點),以 10 公升/分鐘之流速不間斷採樣,採樣時間自 2015
年 1 月至 12 月,以 1000 倍之光學顯微鏡鏡檢分析包含 26 種真菌種類,取得每日
大氣真菌平均濃度 (spores/ m3)。病例資料取自台大醫學院附設醫院 2015 年全年
之急診資料,依據患者主診斷之 ICD 碼 493 判斷患者是否罹患氣喘。本研究為一 病例交叉研究 (case-crossover study),以病患自己做為其對照組,在病例確診 後,同一確診月分內其他星期數則為對照組。利用條件式邏輯斯迴歸評估大氣中 真菌孢子濃度與氣喘之相關性。本研究亦考慮遲滯效應(1-day lag)。
結果:研究期間共採集 309 個空氣樣本,其中以 Ascospores,
Aspergillus/Penicillium, Basidiospores 和 Cladosoprium 最常見。研究期間 中氣喘急診之人次達 640 次,其中又以學齡前兒童(0-5 歲兒童)之人次最多。本
研究主要發現於成人中(15 歲以上),Aspergillus/ Penicillium 濃度會顯著提
高隔日因氣喘急診之風險 (OR: 2.007, 95% CI:1.034, 3.894),且存在劑量效應 關係(p-value = 0.034)。
結論:本研究發現不同年齡層氣喘發作之季節性不同。Aspergillus/ Penicillium 顯著增加成人氣喘發作之風險。
關鍵字:戶外、真菌孢子、急診、氣喘、病例交叉研究
Abstract
Background and Aim: It was estimated that about 334 million people were influenced
by asthma in the world in 2010. Previous studies showed that exposing to high level of
bioaerosols is associated with allergies, lung function decreasing and other adverse
health effect. Bioaerosols are composed of pollens, fungal spores and debris generated
by animals and plants. In this study, we aim to understand the seasonal pattern of
emergency asthma visits among different age people and determine whether exposure to
ambient fungal spores is associated with emergency room visit due to asthma.
Methods: The air samples were collected by Burkard 7-day recording volumetric spore
trap daily on the 3-floor rooftop in Guting elementary school with 10 liters per minute
of flow rate from January to December 2015. Fungal spores were identified as 26
categories by trained mycologists with 1000X microscope to retrieve the average of
daily fungal spore concentrations. The health data was attained from National Taiwan
University Hospital. Visits related to asthma in emergency rooms were identified by the
main diagnose of ICD-9 code 493. This was a case-crossover study. The subjects were
matched to themselves. After the cases were identified, we chose the control group by
choosing the same day of the week in the same month. Conditional logistic regression
was applied to examine the association between ambient fungal spore concentrations
and asthma. And the 1-day lag effect was considered.
Results: There were 309 air samples in total. The most prevalent fungal spores were
Ascospores, Aspergillus/Penicillium, Basidiospores, and Cladosoprium. There were 640
asthma emergency visits in National Taiwan University Hospital in 2015. The visits
were contributed to children more than to adults. We found that at 1-day lag, the
concentration of Aspergillus/ Penicillium was associated with the emergency visits due
to asthma for adults (4th quartile OR: 2.007, 95 % CI: 1.034, 3.894). And there was a
dose-response relationship (p-value = 0.034).
Conclusion: The seasonal pattern of emergency visits for asthma varied among
different age groups. Ambient levels of Aspergillus/ Penicillium spores were
significantly associated with asthma attack in adults with one day lag.
Keywords: Outdoor, Fungal spores, Emergency visits, Asthma, Case-crossover study
Table of Contents
誌謝 ... i
中文摘要 ... ii
Abstract ... iii
Table of Contents ... v
List of Tables ... vi
List of Figures ... vii
Chapter 1 Introduction ... 1
1.1 Background ... 1
1.2 Objectives ... 2
Chapter 2 Literature Review ... 3
Chapter 3 Materials and Methods ... 6
3.1 Study Design ... 6
3.2 Air Samples ... 6
3.3 Data of Health Outcome ... 7
3.4 Data of Meteorological Factors ... 8
3.4 Statistic Analysis ... 8
Chapter 4 Results ... 11
4.1 Fungal Spores ... 11
4.2 Health Outcome ... 11
4.3 Association Between Fungal Spores and Asthma ... 13
Chapter 5 Discussion ... 15
5.1 Fungal Spores ... 15
5.2 Health Outcome ... 16
5.3 Association Between Fungal spores and Asthma ... 18
5.4 Strengths and Limitations ... 20
Chapter 6 Conclusion ... 22
Reference ... 23
List of Tables
Table 1 Distribution of fungal spore concentrations (spores/m3) in 2015 ... 26 Table 2 Characteristics of the emergency visits for asthma in NTUH in 2015 ... 27 Table 3 Conditional logistic regressions for fungal spore concentrations and emergency asthma visits at 0-day-lag in different age groups ... 28 Table 4 Conditional logistic regressions for fungal spore concentrations and emergency asthma visits at 1-day-lag in different age groups ... 30
List of Figures
Figure 1 Temporal trend of the most prevalent fungal spores monthly average
concentrations in 2015 ... 32 Figure 2 Temporal trend of total fungal spore concentrations and monthly average of emergency asthma visits in NTUH in 2015 ... 33 Figure 3 Temporal variation of monthly average of emergency visits for asthma among different age groups in NTUH in 2015 ... 34
Chapter 1 Introduction 1.1 Background
Asthma is a chronic airway disease that is characterized by recurring symptoms of
airway obstruction, bronchial hyperresponsiveness and inflammation [1]. It is estimated
that there were 334 million people having asthma in the worldwide dated to 2010 [2].
Asthma attacks could be triggered by colds, exercise and inhaled allergens
including animal fur, dust mites, pollens and mold [2]. Previous studies have showed
that exposing to high level of fungal spores is associated with allergies, lung function
decreasing and other adverse health effect [3-5]. There are millions of fungi species in
fungi kingdom. Locating in subtropics, Taiwan is hot and humid which make fungi
easily grow and the fungal spore concentrations, in turn, are high.
A few studies have been conducted to access the ambient fungal spore
concentrations in Taiwan, including in Hualien, Tainan and Greater Taipei Area (Taipei
City and New Taipei City) [6-8]. But none of them has monitored the concentration
daily within a whole year.
Seasonal variation has been proved to be associated with the asthma hospitalization
among different areas in the world [9-11]. Since the fungal spore concentrations are
the relation between fungal spore concentrations and asthma attack in specific region.
1.2 Objectives
It led to two objectives in this study:
1. To elucidate the seasonal pattern of asthma in emergency visits and the fungal
spore concentrations.
2. To determine whether ambient fungal spore concentrations is associated with
asthma.
Chapter 2 Literature Review
Asthma prevalence is increasing and remains high in many regions. In the United
States, asthma prevalence has increased from 7.3% in 2001 to 8.4% in 2010 [12].
According to a national study in Taiwan, asthma caused 1.1% of total hospital
admissions in 2000 [13]. And another study reported that the asthma prevalence was
11.9% in 2007 [14]. Asthma caused by well-recognized fungi, such as Alternaria
alternate, are often mediated in Type I immunoglobulin (Ig) E / TH2 hypersensitivity
[15, 16].
A population-based study was done in Taiwan during 1998-2001 and implied the
fact that hospitalization peak for adult asthma was between January and March [13].
However, among 0-4 years old children, there was a peak in November and a trough in
February. Fleming, et al., have also proposed that the seasonal pattern of asthma
evolved with age [9].
As far as the fungal spores are concerned, airborne fungal spores fall in 2-10 μm,
which is able to penetrate the lower bronchi and leads to the allergies of lower
respiratory tract, for example, asthma. [16, 17]. The average concentration of total
fungal spores was 4844.41 spores/m3 in Hualien [6], the eastern coast of Taiwan, and
2564.98 spores/m3 in the Greater Taipei area (Taipei City and New Taipei City), the
northern of Taiwan [8]. It is reported that high temperature (15-29°C), high relative
humidity (50–80%) and rainfall are the necessities of fungal spores formation of
Alternaria and Cladosporium [18], which were proved that sensitization to these fungal
spores would be the risk factors for severe asthma in adults in Europe [19].
With the respect to epidemiological evidence, in London, when 0-14 years old
children exposed to the high concentration of ambient fungal spores (the interquartile
range of total fungal spores concentrations = 3311.6 spores/m3), the risk of paying
emergency visits and hospital admissions due to asthma increased even though it was
insignificant [20]. Another study conducted in Ottawa found out the emergency visits
due to asthma in a regional hospital were associated with Deuteromycetes,
Basidiomycetes and Ascomycetes, which the average of spores concentrations were
1672 spores/m3, 551 spores/m3 and 297 spores/m3 in order [21].
From the literature reviewed above, there is no consistent fungal taxon associated to
the emergency visits for asthma. Even though the seasonal pattern of emergency
admissions for asthma has been investigated before, the yearly information of fungal
spore concentrations is lack. Although many studies have inspected the effect of
metrological factors on fungal spores, it would be nice to have the bigger picture of the
fungal spore concentrations and the related health effect.
Chapter 3 Materials and Methods 3.1 Study Design
This was a time stratified case-crossover study to evaluate the effect of ambient
fungal spore concentrations on emergency visits of asthma. This study recorded daily
ambient fungal spore concentrations, which were assumed to be the personal exposure,
from January to December 2015. The study population was those patients who paid
emergency visits due to asthma in a regional hospital, National Taiwan University
Hospital, in Taipei, Taiwan.
3.2 Air Samples
Fungal spores were collected by Burkard 7-day recording volumetric spore trap
(Burkard Manufacturing Co. Limited, Rickmansworth Hertfordshire, England) and
sampled 24 hours continuously with 10 liters per minute. The flow rate was calibrated
once a week while the drum was changed. The sampling protocol referred to
Pan-American Aerobiology Association (PAAA) was as follows: A thin layer of
Lubriseal grease (Thomas Scientific, Swedesboro, NJ) was coated onto the Melinex
tape which mounted the drum. The rotating frequency of the drum was 2 mm per hour.
The particles, including aerosols and bioaerosols, impacted on the Melinex tape through
a 2mm X 14 mm inlet. After sampling, the Melinex tape was cut into 7 pieces with 48
mm in length of each, adhered to the slide by 10% Moviol and in turn stained by
Glycerin Jelly before identification. One single longitudinal traverse near the middle of
the trace was identified under the 1000 X microscope. Fungal categories were the same
as those decided by American Academy of Allergy Asthma & Immunology (AAAAI).
There were 26 categories including other and unidentified. The observed fungal spores
number could be converted into the concentration (spores/m3) by equation (1) and (2).
𝐴𝑣𝑒𝑟𝑎𝑔𝑒 𝐷𝑎𝑖𝑙𝑦 𝐶𝑜𝑛𝑐𝑒𝑛𝑡𝑟𝑎𝑡𝑖𝑜𝑛 (𝑠𝑝𝑜𝑟𝑒𝑠𝑚3 ) =𝑁𝑢𝑚𝑏𝑒𝑟 𝑜𝑓 𝑠𝑝𝑜𝑟𝑒𝑠(𝑠𝑝𝑜𝑟𝑒𝑠)
𝑉𝑜𝑙𝑢𝑚𝑒(𝑚3) equation(1) 𝑉𝑜𝑙𝑢𝑚𝑒 (𝑚3) =𝐹𝑖𝑒𝑙𝑑 𝐷𝑖𝑎𝑚𝑒𝑡𝑒𝑟 𝑜𝑓 𝑂𝑏𝑗𝑒𝑐𝑡𝑖𝑣𝑒 (𝑚𝑚)
𝑇𝑟𝑎𝑐𝑒 𝑊𝑖𝑑𝑡ℎ(𝑚𝑚) × 𝐹𝑙𝑜𝑤 𝑅𝑎𝑡𝑒 × 𝑇𝑖𝑚𝑒 equation(2) where, the field diameter of objective was 0.25 mm, trace width was 14 mm, flow rate
was 0.01m3/ min, and time was 1440 minutes.
The sampler was placed on the 3-floor rooftop in Guting Elementary School
(longitude: 121.53°, latitude: 25.02°) in Taipei City right next to the air monitoring
station founded by Environmental Protection Administration. The sampling period was
from January to December 2015. There were some missing dates of sampling including
New Year vacation (1/1-1/7), Chinese New Year vacation (2/12-2/25), failure of drum
exchange (8/13-8/26) and power-supplied problem (10/1-10/21).
3.3 Data of Health Outcome
The health data was retrieved from National Taiwan University Hospital (NTUH)
during January to December 2015. The enrollees were those who paid the visit to
emergency department due to the asthma. NTUH is about 2.5 km away from the
air-sampling site, a tertiary referral center with 2400s beds. Daily emergency visits were
recorded by identifying the main diagnose of ICD-9 (International Classification of
Diseases, Ninth Revision) code 493. This study was approved by the Institutional
Review Board of the Ethics Committee of the NTUH.
3.4 Data of Meteorological Factors
We have retrieved the meteorological factors during the studying period from the
open source of Taiwan Environmental Protection Administration in Guting air
monitoring station. We obtained the hourly data and calculated for the daily data by
applying arithmetic mean. The meteorological factors include the temperature, relative
humidity and concentration of CO (by non-dispersive infrared), NO2
(chemiluminescence), SO2 (by ultraviolet fluorescence), O3 (by ultraviolet absorption),
PM10 (by beta-ray attenuation), and PM2.5 (by beta-ray attenuation).
3.5 Statistical Analysis
The software to perform the data analysis was Microsoft Excel, JMP 10 and SAS
ver9.3 (SAS Institute Inc., Cary, NC, USA). The characteristics of the fungal spore
concentrations distribution and the characteristics of the asthma patients were presented
by the descriptive statistics. Conditional logistic regression was applied to examine the
ambient fungal spore concentration and emergency visits of asthma and the seasonal
impact. And we tested the dose-response relationship as well. The association between
meteorological factors and emergency asthma visits was assessed in order to adjust the
model. The analysis included 0-day lag effect, which meant that the exposure of the
subjects was the same day as the asthma attacked, and 1-day lag effect, which meant
that the exposure of the subjects was a day before the asthma attacked. We transferred
the fungal spore concentrations into ordinal variables due to that some fungal spore
concentrations were relatively low. In order to reflect the exposure reality, we discarded
the point estimate per log 10 increase of fungal spore concentrations.
There were three approaches to make the concentration of fungal spores into ordinal
variables. First, we would examine the median of fungal spore concentrations. When the
median concentration was zero, we would consider whether the specific fungal spores
were presented in the sampling day or not in our analysis. Another criterion would focus
on the fungal spore concentrations at 25 % percentile. When it was zero, the exposure
level would be cut into three groups: zero concentration, lower than the median
concentration of specific fungal spores and higher than the median concentration. The
remains would be categorized into quartiles by referring to the concentration of 25%,
50%, and 75% percentile.
In this study, we used time stratified case-crossover study due to the exposure
varying in short term and an abrupt health outcome [22]. The study design controls the
confounding factors of the individuals to remain constant in hazard period and control
period by matching the subjects to themselves [23]. After the cases were indicated, they
were matched by selecting the same day of the week in the same month as the control
period, which could be 7 to 28 days before or later at a week interval, and it led to 3 to 4
control periods per case.
Chapter 4 Results
4.1 Fungal Spores
There were 309 air-sampling samples in total. Table 1 showed the distribution of
fungal spore concentrations during the study period. The table was ordered by the
frequency; however, high frequency was not required to be in high concentration. The
highest fungal spore concentrations were Ascospores, Aspergillus /Penicillium,
Basidiospores, Cladosporium, which were 1850.47 spores/m3, 372.62 spores/m3,
1500.68 spores/m3, and 521.19 spores/m3. In the meanwhile, these were also the most
prevalent fungal categories as well.
Figure 1 showed the temporal differences of the monthly average of the most
prevalent spore concentrations in 2015. Whichever the fungal spore was, the highest
concentration was in July. For Cladosporium, the variation within the whole year was
relatively small, compared to other fungal categories. As to Aspergillus/ Penicillium, the
concentration was relatively low; however, the temporal trend was same as total spore
concentrations.
4.2 Health Outcome
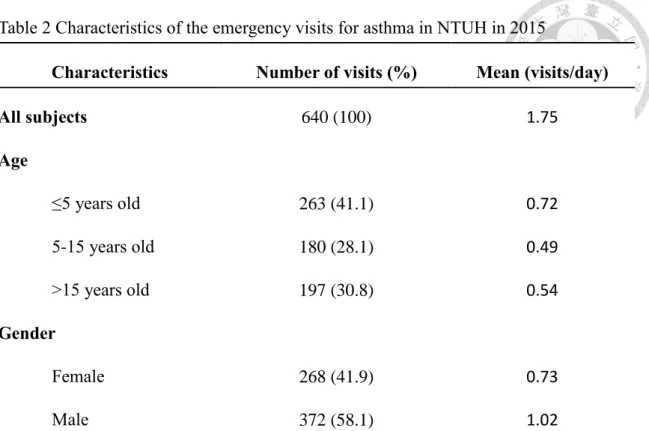
There were 640 emergency visits due to asthma in NTUH in 2015. The descriptive
statistics was shown in Table 2. According to the age of the patients, the visits were
divided into three subgroups, 0-5 (including 5) years old, 5-15 (including 15) years old,
and elder than 15 years old. Preschool children (0-5 years old) paid the most visits
during the study period. In spite of the age, there was a little difference between the
genders. 372 visits were contributed to female and 268 to male. And the average of
daily emergency asthma visits were 1.75 visits /day.
The temporal distributions of monthly average of total fungal spore concentrations
and emergency visits related to asthma were plotted in figure 2. There was only a peak,
which was between June and July, of high concentration of total spores. On the contrary,
the emergency visits, in generally, was high between March and May and followed by a
decrease and a trough in July, and then the trend inclined in September to reach the peak
in December.
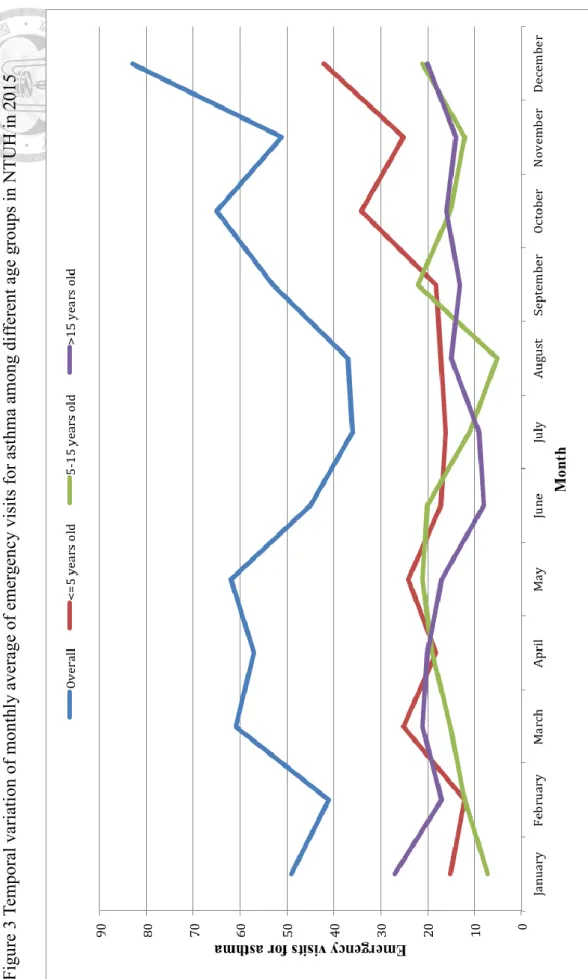
Figure 3 showed the overall emergency asthma visits and also interpreted in terms
of different age subgroups in each month in 2015. Preschool children intended to suffer
from asthma in fall and early winter (October, November, and December). School-aged
children (from 5 to 15 years old) paid more visits in May and September. In addition,
there were two clearly trough in August and January. To adults, elder than 15 years old,
the variation was mild, but, generally, the visits were more in winter.
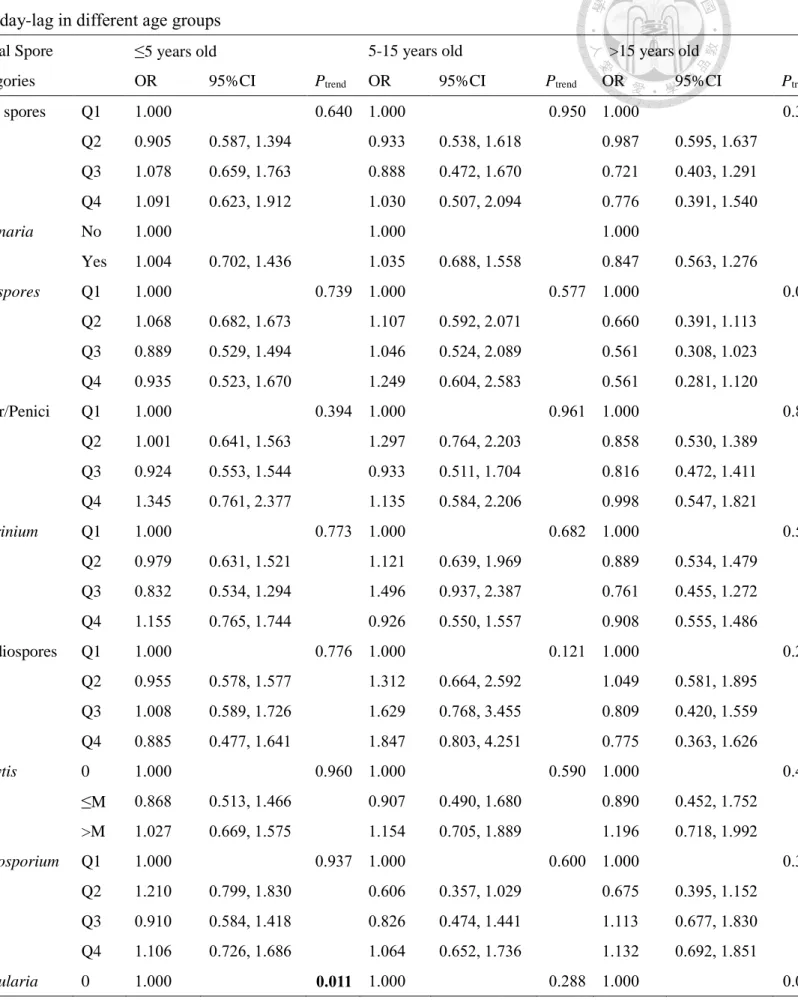
4.3 Association between Fungal Spores and Asthma
The individual fungal spore concentrations were evaluated in the conditional
logistic regression model one after another and correlated with the subjects in different
age groups. The result of 0-day lag was presented in Table 3. Cercospora, Drechslera/
Helminthosporium, Epicoccum, Oidium/Erysiphe, Peronospora, Pithomyces, Rusts, Stemphylium, Tetrapola, Ulocladium, which had low frequency (<20%) were not
analyzed in the model.
We did not find the association between meteorological factors and emergency
visits of asthma (the data was not shown). Thus, there was no additional adjustment in
our model to evaluate the correlation of fungal spore concentrations and emergency
asthma visits. At 0-day lag, Curvularia was inversely related to children under 5 years
old (concentration higher than median OR: 0.605, 95%CI: 0.402 - 0.911); however, as
to adults elder than 15 years old, Curvularia had significantly increased the odds ratio
of emergency visits related to asthma (concentration higher than median OR: 1.664,
95% CI: 1.071 – 2.587).
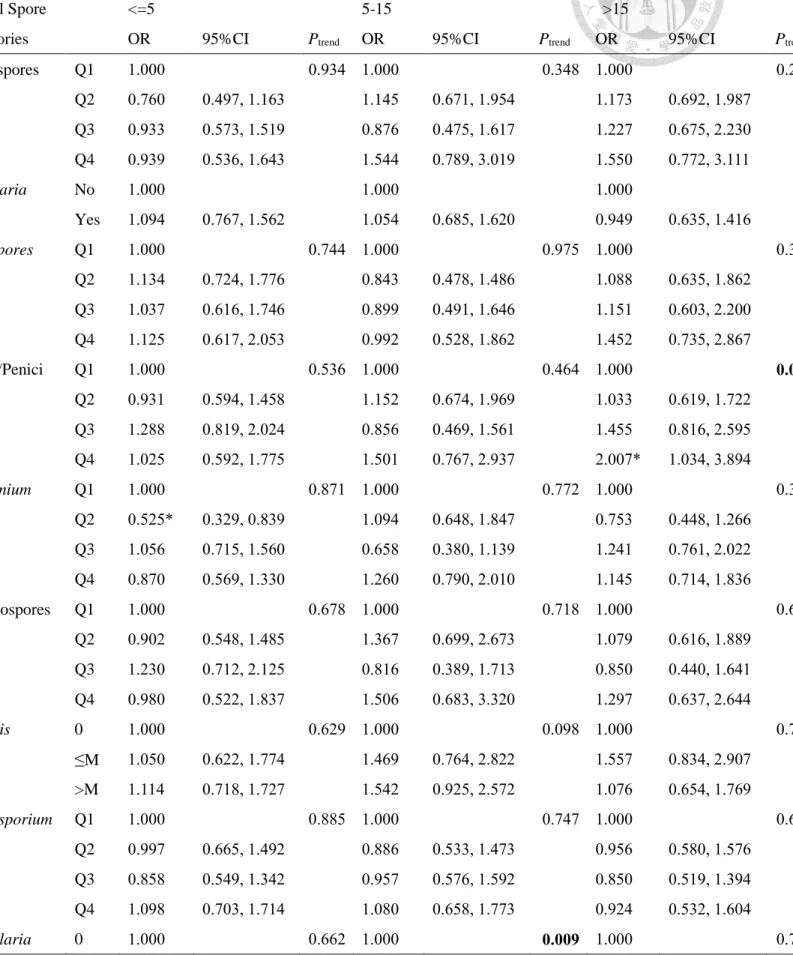
The effect of 1-day-lag was shown in Table 4. We found that Arthrinium was related
to children under 5 years old (second quartile OR: 0.525, 95% CI: 0.329 – 0.839).
Curvularia, on the other hand, was correlated to school-aged children (concentration
higher than median OR: 0.517, 95% CI: 0.310 – 0.861). And we found the association
between Aspergillus/ Penicillium and emergency asthma visits in adults (forth quartile
OR: 2.007, 95% CI: 1.034 – 3.894).
Chapter 5 Discussion
5.1 Fungal Spores
In this study, we have successfully monitored the fungal spore concentrations within
a whole year, except for some inevitable episodes. The average of total fungal spores
concentration was 4448.08 spores/m3 in our study, which was far lower than that in
Tainan [7]. Possibly because the weather condition in southern Taiwan, the tropical area,
was more appropriate for fungi growing. However, we share the common prevalent
fungal spore categories with other studies [6-8].
In our study, we found that Ascospores, Aspergillus /Penicillium, Basidiosporess,
Cladosporium, Smuts, Arthrinium, Nigrospora and Periconia presented more than 60 %
in our air samples. It is reported that Ascospores, Cladosporium,
Aspergillus/Penicillium, Ganoderma (belongs to Basidiomycetes),
Arthrinium/Papularia were the major fungal categories in Hualien [6]. In Tainan, the
predominant fungal categories were Cladosporium, Ascospores, Periconia,
Basidiospores, Botrytis, Smuts, Alternaria, Penicillium/ Aspergillus, and Fusarium [7].
Last but not least, the study conducted in Greater Taipei Area found the leading fungal
categories were Ascospores, Aspergillus/ Penicillium, Basidiospores, Cladosporium,
Smuts, Fusarium, Periconia, Nigrospora, Botrytis, and Arthrinium [8]. In addition, in
our study, we found that most of fungal spores were in high concentration in summer
(June, July and August), and low concentration in winter (December, January and
February).
5.2 Health Outcome
March and December were two periods having more emergency visits related to
asthma in NTUH in 2015. The result was similar to another study, which extracted the
subjects from National Health Insurance Research Database (NHIRD), in Taipei City
from 2000 to 2002 [24]. NHIRD, which covered more than 96% of the population in
2000, was the database provided by the Bureau of NHI [25].
We indicated the seasonal variation of the emergency asthma visits among
different age groups. From table 2, most of the visits were contributed to children (both
preschool children and school-aged children) than to adults. There are some possible
explanations.
Firstly, compared to adults, children are engaged in more outdoor activities, hence it
increased the exposure of ambient fungal spores [26]. Secondly, the process of lung
development is significant in childhood and the alveoli numbers in lungs continue
changing through adolescence. This suggested that the incomplete development of lung
might lead to certain level of damage from given exposure of fungal spore
concentrations [26, 27]. As the characteristics of asthma, chronic illness and recurring
symptoms, adults patients are likely to have more experience dealing to the disease
when the asthma attacks. They may have self-treat for mild asthma or pay the visits to
nearby clinics instead of visiting emergency rooms. On the contrary, whenever the
children have asthma attack, parents rush to bring the children to the hospitals [24, 26].
We speculated that the high number of visits among all age groups might result
from the flu and low temperature other than fungal spores exposure, especially for the
preschool children, who had poor immunity [28]. The temporal trend of paying
emergency asthma visits in school-aged children interestingly coincided with the
schooling time. In Taiwan, there’s a summer vacation in July and August and a winter
vacation along with Chinese New Year holiday in mid-January and February. The
emergency asthma visits dramatically dropped during these periods and increased
thereafter. The phenomenon also occurred in New Zealand, Malta, Sydney, and the UK
[10, 11, 29, 30]. It was probably because of that children increased social contacts in
schools and in turn increased the risks of suffering from viral infections in respiratory
tracts [11, 29].
5.3 Association Between Fungal Spores and Asthma
Many current studies divided fungal categories into three main phyla: Ascomycota,
Basidiomycota and Deuteromycota. In our study, we examined the fungal categories
down to the taxon, except for some categories that were not easily to tell the apart from
the morphology. We found that the concentration of Aspergillus/ Penicillium was
positively associated with emergency asthma visits to adults at 1-day lag. Besides, from
the trend test, we could tell that there’s a dose-response relationship. In southern
Pakistan, they found that the higher indoor concentration of Aspergillus/ Penicillium
was correlated to higher adults (≥16 years old) asthma exacerbation [31]. Dales et al.,
has indicated that Deutermycetes (including Aspergillus/ Penicillium) increased 1.9% of
the emergency visits for asthma in a regional children hospital study [21]. Another study
in Taiwan also revealed that the classroom concentration of Aspergillus/ Penicillium
was related to current asthma in school-aged children [3].
Curvularia played as different roles among different age groups from our findings.
To preschool children and school-aged children, Curvularia was inversely correlated to
emergency visits due to asthma at 0-day-lag and 1-day-lag respectively. On the other
hand, to adults, the positive relation between Curvularia and emergency asthma visits
was found. The evidence and the mechanism of Curvularia and asthma were limited
and unclear. However, the relationship between Curvularia and other respiratory disease
did exist. In 1981, McAleer et al., shared a case report of a 33 year-old woman having
allergic bronchopulmonary disease caused by Curvularia lunata [32]. And from the
previous literature, Curvularia was one of the common fungi in allergic
bronchopulmonary mycosis (ABPM). Other than Aspergillus, the prevalence of the
cases was 8% [33].
At 1-day lag, the 2nd quartile concentration of Arthrinium was found to be
negatively associated with emergency visits due to asthma. Nevertheless, the trend test
did not meet statistically significance.
To sum up, from our study results, we did not find the association between
emergency asthma visits and prevalent fungal spores but Aspergillus/ Penicillium.
Previous study suggested that 1500 spores/ m3 of Cladosporium was the threshold of
decreasing the lung function for school children [4]. This might explain the insignificant
result of Cladosporium in our study. The average concentration of Cladosporium from
what we observed was 529.19 spores/m3, which was far lower than the threshold. The
results might not be applied to other regions due to the spatial variation of fungal spores.
We did not either encourage exposing more of those fungal spores playing a protective
factor in our study. Here, only acute asthma was examined. There might be some other
adverse health effects of exposing high level of fungal spores, such as allergic
bronchopulmonary mycosis (ABPM) [33]. What’s more, the exposure of fungal spores
was a mixture exposure along with particles, pollens and other air pollutants. Therefore,
the interactions between fungal spores itself and other pollutants might be the next
target to work on. In this case, the policy makers would have the insight to set a
threshold for warning the public before engaging in outdoor activities.
5.4 Strengths and Limitations
To our knowledge, this was one of the few study that continuously monitoring the
temporal variation of fungal spore concentrations almost a year in Taipei. Having the
complete data, we could better understand the different trends between fungal spore
concentrations and the asthma. Even Taiwan is a small island with approximately
36,000 km2, the spatial variation of fungal spore concentrations still remains.
Additionally, this was a case-crossover study, we controlled the personal characteristics,
such as gender, environmental tobacco smoke and the effects of day of the week, which
secondary data did not provide [22, 34].
There are limitations in this study. Since this was a hospital-based study, the case
number was limited. Furthermore, we did not know the general population of how many
people were at risk. In this case, the temporal trend of emergency asthma visits could
only be presented in case number instead of the rate.
Another potential problem is that whether the one and only monitoring cite could
represent the exposure of the individuals. In addition, because of the privacy protection,
we assumed that all the subjects exposed to the fungal spores in the same region where
the air sampling conducted. Due to the limited manpower, we failed to access the fungal
spore concentrations in different locations. This was the difficulty that environmental
epidemiology studies often encountered.
We also face multiple comparisons in the statistical analysis. This might have
resulted increased chance of false positive findings. The results of association between
Aspergillus/ Penicillium spores and emergency visit due to asthma have to be further examined.
Chapter 6 Conclusion
This study found that Ascospores, Aspergillus /Penicillium, Basidiosporess,
Cladosporium, Smuts, Arthrinium, Nigrospora and Periconia were the predominant
fungal spore categories in our samples after monitoring for almost a year. Ambient level
of Aspergillus/ Penicillium spores was positively associated with emergency visits due
to asthma in adults (above 15 years old) with one day lag.
Reference
1. EPR-3., Expert Panel Report 3: Guidelines for the diagnosis and management of asthma. 2007, National Heart, Lung, and Blood Institute: Bethesda, MD.
2. The Global Asthma Report 2014. 2014: Auckland, New Zealand: Global Asthma Network.
3. Chen, C.H., et al., Current Asthma in Schoolchildren Is Related to Fungal Spores in Classrooms. Chest, 2014. 146(1): p. 123-34.
4. Chen, B.Y., et al., High ambient Cladosporium spores were associated with reduced lung function in schoolchildren in a longitudinal study. Sci Total Environ, 2014. 481: p. 370-6.
5. Gioulekas, D., et al., Allergenic fungi spore records (15 years) and sensitization in patients with respiratory allergy in Thessaloniki-Greece. J Invest Allergol Clin Immunol, 2004. 14(3): p. 225-31.
6. Ho, H.M., et al., Characteristics and determinants of ambient fungal spores in Hualien, Taiwan. Atmos Environ, 2005. 39: p. 5839-50.
7. Wu, P.-C., et al., Increased levels of ambient fungal spores in Taiwan are associated with dust events from China. Atmos Environ, 2004. 38(29): p.
4879-4886.
8. Kallawicha, K., et al., The spatiotemporal distributions and determinants of ambient fungal spores in the Greater Taipei area. Environ Pollut, 2015. 204: p.
173-80.
9. Fleming, D.M., et al., Comparison of the seasonal patterns of asthma identified in general practitioner episodes, hospital admissions, and deaths. Thorax, 2000.
55: p. 662-5.
10. Kimbell-Dunn, M., N. Pearce, and R. Beasley, Seasonal variation in asthma hospitalizations and death rates in New Zealand. Respirology, 2000. 5: p. 241-6.
11. Grech, V., et al., Seasonal Variations in Hospital Admissions for Asthma in Malta. J Asthma, 2002. 39(3): p. 263-268.
12. Akinbami, L.J., et al., Trends in Asthma Prevalence, Health Care Use, and Mortality in the United States, 2001–2010. 2012, National Center for Health Statistics: Hyattsville, MD.
13. Chen, C.H., S. Xirasagar, and H.C. Lin, Seasonality in adult asthma admissions, air pollutant levels, and climate: a population-based study. J Asthma, 2006.
43(4): p. 287-92.
14. Hwang, C.Y., et al., Prevalence of atopic dermatitis, allergic rhinitis and asthma in Taiwan: a national study 2000 to 2007. Acta Derm Venereol, 2010. 90(6): p.
589-94.
15. Denning, D.W., et al., Fungal allergy in asthma–state of the art and research needs. Clin Transl Allergy, 2014. 4(1): p. 1-23.
16. Zukiewicz-Sobczak, W.A., The role of fungi in allergic diseases. Postepy Dermatol Alergol, 2013. 30(1): p. 42-5.
17. Burge, H.A. and C.A. Rogers, Outdoor Allergens. Environ Health Perspect, 2000. 108: p. 653-9.
18. Artac, H., et al., Alternaria and Cladosporium spores in the atmosphere of Konya and their relationship with meteorological factors. Asthma Allergy Immunol, 2014. 12: p. 130-9.
19. Zureik, M., et al., Sensitisation to airborne moulds and severity of asthma: cross sectional study from European Community respiratory health survey. BMJ, 2002.
325: p. 7.
20. Atkinson, R.W., et al., Temporal associations between daily counts of fungal spores and asthma exacerbations. Occup Environ Med, 2006. 63(9): p. 580-90.
21. Dales, R.E., et al., Influence of Ambient Fungal Spores on Emergency Visits for Asthma to a Regional Children’s Hospital. AJRCCM, 2000. 162(6): p. 2087-90.
22. Jaakkola, J.J.K., Case-crossover design in air pollution epidemiology. Eur Respir J, 2003. 21(Supplement 40): p. 81S-85s.
23. Carracedo-Martinez, E., et al., Case-crossover analysis of air pollution health effects: a systematic review of methodology and application. Environ Health Perspect, 2010. 118(8): p. 1173-82.
24. Chan, T.C., et al., Spatiotemporal analysis of air pollution and asthma patient visits in Taipei, Taiwan. Int J Health Geogr, 2009. 8: p. 26.
25. Tsai, S.S., et al., Air pollution and hospital admissions for asthma in a tropical city: Kaohsiung, Taiwan. Inhal Toxicol, 2006. 18(8): p. 549-54.
26. Sun, H.L., M.C. Chou, and K.H. Lue, The relationship of air pollution to ED visits for asthma differ between children and adults. Am J Emerg Med, 2006.
24(6): p. 709-13.
27. Trasande, L. and G.D. Thurston, The role of air pollution in asthma and other pediatric morbidities. J Allergy Clin Immunol, 2005. 115(4): p. 689-99.
28. Buckley, J.P. and D.B. Richardson, Seasonal modification of the association between temperature and adult emergency department visits for asthma: a case-crossover study. Environ Health, 2012. 11(55).
29. Lincoln, D., et al., Childhood asthma and return to school in Sydney, Australia.
Public Health, 2006. 120(9): p. 854-62.
30. Julious, S.A., L.M. Osman, and M. Jiwa, Increases in asthma hospital admissions associated with the end of the summer vacation for school-age children with asthma in two cities from England and Scotland. Public Health, 2007. 121(6): p. 482-4.
31. Zubairi, A.B., et al., Association of airborne Aspergillus with asthma exacerbation in Southern Pakistan. Asia Pac Allergy, 2014. 4(2): p. 91-8.
32. McAleer, R., et al., Allergic bronchopulmonary disease caused by Curvularia lunata and Drechlera hawaiiensis. Thorax, 1981. 36: p. 338-44.
33. Chowdhary, A., et al., Allergic bronchopulmonary mycosis due to fungi other than Aspergillus: a global overview. Crit Rev Microbiol, 2014. 40.
34. Bateson, T.F. and J. Schwartz, Control for Seasonal Variation and Time Trend in Case-Crossover Studies of Acute Effects of Environmental Exposures.
Epidemiology, 1999. 10.
Table 1 Distribution of fungal spore concentrations (spores/m3) in 2015
Fungal Categories Freq(%) Mean Q1 Median Q3 SD Min Max
Total Fungal Spores 100.00 4448.08 1244.44 2838.89 6525.56 4187.03 155.56 18950.56 Ascospores 100.00 1850.47 501.67 1170.56 2582.22 1890.24 31.11 9601.67 Aspergillus/Penicillium 100.00 372.62 97.22 221.67 521.11 432.04 11.67 4281.67 Basidiospores 99.68 1500.68 167.22 758.33 2247.78 1747.74 0.00 8458.33 Cladosporium 99.68 529.19 143.89 326.67 688.33 589.07 0.00 3780.00
Smuts 95.47 69.18 19.44 46.67 101.11 69.62 0.00 416.11
Arthrinium 77.02 18.63 3.89 11.67 23.33 29.92 0.00 272.22
Nigrospora 69.26 10.47 0.00 3.89 15.56 14.79 0.00 116.67
Periconia 63.75 7.15 0.00 3.89 11.67 9.05 0.00 50.56
Curvularia 53.40 5.69 0.00 3.89 7.78 8.85 0.00 58.33
Botrytis 53.07 17.59 0.00 3.89 23.33 32.14 0.00 194.44
Torula 51.13 6.20 0.00 3.89 7.78 9.76 0.00 77.78
Fusarium 42.72 7.27 0.00 0.00 7.78 15.77 0.00 167.22
Alternaria 39.16 3.67 0.00 0.00 3.89 7.03 0.00 54.44
Cercospora 19.74 1.69 0.00 0.00 0.00 4.69 0.00 35.00
Drechslera/Helminthosporium 11.00 0.79 0.00 0.00 0.00 3.77 0.00 50.56
Peronospora 9.71 0.94 0.00 0.00 0.00 4.47 0.00 58.33
Rusts 8.41 0.58 0.00 0.00 0.00 3.46 0.00 54.44
Pithomyces 6.80 0.33 0.00 0.00 0.00 1.33 0.00 11.67
Tetrapola 5.18 0.24 0.00 0.00 0.00 1.21 0.00 15.56
Oidium/Erysiphe 4.53 0.21 0.00 0.00 0.00 1.04 0.00 7.78
Epicoccum 3.24 0.14 0.00 0.00 0.00 0.79 0.00 7.78
Steymphylium 3.24 0.15 0.00 0.00 0.00 0.87 0.00 7.78
Ulocladium 0.32 0.01 0.00 0.00 0.00 0.22 0.00 3.89
Polythrincium 0.00 0.00 0.00 0.00 0.00 0.00 0.00 0.00
Other Fungi 80.58 29.42 3.89 19.44 42.78 35.00 0.00 202.22
Unidentified Fungi 72.82 14.13 0.00 3.89 15.56 22.88 0.00 155.56 Freq - Frequency: The percentage of samples presented (n=309).
Q1- First Quartile, Q3 - Third Quartile, SD - Standard Deviation, Min – Minimum, Max- Maximum
Table 2 Characteristics of the emergency visits for asthma in NTUH in 2015
Characteristics Number of visits (%) Mean (visits/day)
All subjects 640 (100) 1.75
Age
≤5 years old 263 (41.1) 0.72
5-15 years old 180 (28.1) 0.49
>15 years old 197 (30.8) 0.54
Gender
Female 268 (41.9) 0.73
Male 372 (58.1) 1.02
Table 3 Conditional logistic regressions for fungal spore concentrations and emergency asthma visits at 0-day-lag in different age groups
Fungal Spore Categories
≤5 years old 5-15 years old >15 years old
OR 95%CI Ptrend OR 95%CI Ptrend OR 95%CI Ptrend
Total spores Q1 1.000 0.640 1.000 0.950 1.000 0.312
Q2 0.905 0.587, 1.394 0.933 0.538, 1.618 0.987 0.595, 1.637
Q3 1.078 0.659, 1.763 0.888 0.472, 1.670 0.721 0.403, 1.291
Q4 1.091 0.623, 1.912 1.030 0.507, 2.094 0.776 0.391, 1.540
Alternaria No 1.000 1.000 1.000
Yes 1.004 0.702, 1.436 1.035 0.688, 1.558 0.847 0.563, 1.276
Ascospores Q1 1.000 0.739 1.000 0.577 1.000 0.079
Q2 1.068 0.682, 1.673 1.107 0.592, 2.071 0.660 0.391, 1.113 Q3 0.889 0.529, 1.494 1.046 0.524, 2.089 0.561 0.308, 1.023 Q4 0.935 0.523, 1.670 1.249 0.604, 2.583 0.561 0.281, 1.120
Asper/Penici Q1 1.000 0.394 1.000 0.961 1.000 0.878
Q2 1.001 0.641, 1.563 1.297 0.764, 2.203 0.858 0.530, 1.389 Q3 0.924 0.553, 1.544 0.933 0.511, 1.704 0.816 0.472, 1.411 Q4 1.345 0.761, 2.377 1.135 0.584, 2.206 0.998 0.547, 1.821
Arthrinium Q1 1.000 0.773 1.000 0.682 1.000 0.529
Q2 0.979 0.631, 1.521 1.121 0.639, 1.969 0.889 0.534, 1.479 Q3 0.832 0.534, 1.294 1.496 0.937, 2.387 0.761 0.455, 1.272 Q4 1.155 0.765, 1.744 0.926 0.550, 1.557 0.908 0.555, 1.486
Basidiospores Q1 1.000 0.776 1.000 0.121 1.000 0.286
Q2 0.955 0.578, 1.577 1.312 0.664, 2.592 1.049 0.581, 1.895 Q3 1.008 0.589, 1.726 1.629 0.768, 3.455 0.809 0.420, 1.559 Q4 0.885 0.477, 1.641 1.847 0.803, 4.251 0.775 0.363, 1.626
Botrytis 0 1.000 0.960 1.000 0.590 1.000 0.497
≤M 0.868 0.513, 1.466 0.907 0.490, 1.680 0.890 0.452, 1.752
>M 1.027 0.669, 1.575 1.154 0.705, 1.889 1.196 0.718, 1.992
Cladosporium Q1 1.000 0.937 1.000 0.600 1.000 0.375
Q2 1.210 0.799, 1.830 0.606 0.357, 1.029 0.675 0.395, 1.152 Q3 0.910 0.584, 1.418 0.826 0.474, 1.441 1.113 0.677, 1.830 Q4 1.106 0.726, 1.686 1.064 0.652, 1.736 1.132 0.692, 1.851
Curvularia 0 1.000 0.011 1.000 0.288 1.000 0.050
≤M 0.704 0.473, 1.046 1.233 0.782, 1.944 0.822 0.504, 1.342 >M 0.605* 0.402, 0.911 1.267 0.807, 1.987 1.664* 1.071, 2.587
Fusarium No 1.000 1.000 1.000
Yes 0.713 0.496, 1.027 1.031 0.679, 1.565 0.973 0.622, 1.522
Nigrospora 0 1.000 0.880 1.000 0.158 1.000 0.187
≤M 0.952 0.623, 1.455 1.173 0.675, 2.039 1.623 0.981, 2.684
>M 1.026 0.703, 1.497 1.398 0.869, 2.248 1.378 0.874, 2.173
Periconia 0 1.000 0.169 1.000 0.707 1.000 0.811
≤M 1.187 0.806, 1.750 1.072 0.666, 1.727 1.091 0.636, 1.710
>M 1.305 0.887, 1.920 0.912 0.582, 1.428 1.044 0.668, 1.631
Smuts Q1 1.000 0.846 1.000 0.924 1.000 0.222
Q2 0.809 0.515, 1.273 1.152 0.665, 1.997 1.016 0.596, 1.732 Q3 0.790 0.502, 1.245 1.091 0.630, 1.888 1.136 0.676, 1.909 Q4 1.069 0.665, 1.717 1.061 0.586, 1.924 1.493 0.812, 2.747
Torula 0 1.000 0.699 1.000 0.339 1.000 0.303
≤M 0.838 0.532, 1.320 0.829 0.476, 1.442 1.277 0.784, 2.079
>M 0.948 0.670, 1.343 0.818 0.541, 1.237 1.215 0.807, 1.828 p-value < 0.05 ** p-value < 0.005
Bold-faced showed statistically significant trend.
Q1-Q4: First to forth quartile.
No /0: Specific fungal spores did not present.
Yes: Specific fungal spores presented.
≤M: Fungal spore concentrations were below median.
>M: Fungal spore concentrations were above median.
Table 4 Conditional logistic regressions for fungal spore concentrations and emergency asthma visits at 1-day-lag in different age groups
Fungal Spore Categories
<=5 5-15 >15
OR 95%CI Ptrend OR 95%CI Ptrend OR 95%CI Ptrend
Total spores Q1 1.000 0.934 1.000 0.348 1.000 0.243
Q2 0.760 0.497, 1.163 1.145 0.671, 1.954 1.173 0.692, 1.987
Q3 0.933 0.573, 1.519 0.876 0.475, 1.617 1.227 0.675, 2.230
Q4 0.939 0.536, 1.643 1.544 0.789, 3.019 1.550 0.772, 3.111
Alternaria No 1.000 1.000 1.000
Yes 1.094 0.767, 1.562 1.054 0.685, 1.620 0.949 0.635, 1.416
Ascospores Q1 1.000 0.744 1.000 0.975 1.000 0.301
Q2 1.134 0.724, 1.776 0.843 0.478, 1.486 1.088 0.635, 1.862 Q3 1.037 0.616, 1.746 0.899 0.491, 1.646 1.151 0.603, 2.200 Q4 1.125 0.617, 2.053 0.992 0.528, 1.862 1.452 0.735, 2.867
Asper/Penici Q1 1.000 0.536 1.000 0.464 1.000 0.034
Q2 0.931 0.594, 1.458 1.152 0.674, 1.969 1.033 0.619, 1.722 Q3 1.288 0.819, 2.024 0.856 0.469, 1.561 1.455 0.816, 2.595 Q4 1.025 0.592, 1.775 1.501 0.767, 2.937 2.007* 1.034, 3.894
Arthrinium Q1 1.000 0.871 1.000 0.772 1.000 0.342
Q2 0.525* 0.329, 0.839 1.094 0.648, 1.847 0.753 0.448, 1.266 Q3 1.056 0.715, 1.560 0.658 0.380, 1.139 1.241 0.761, 2.022 Q4 0.870 0.569, 1.330 1.260 0.790, 2.010 1.145 0.714, 1.836
Basidiospores Q1 1.000 0.678 1.000 0.718 1.000 0.668
Q2 0.902 0.548, 1.485 1.367 0.699, 2.673 1.079 0.616, 1.889 Q3 1.230 0.712, 2.125 0.816 0.389, 1.713 0.850 0.440, 1.641 Q4 0.980 0.522, 1.837 1.506 0.683, 3.320 1.297 0.637, 2.644
Botrytis 0 1.000 0.629 1.000 0.098 1.000 0.717
≤M 1.050 0.622, 1.774 1.469 0.764, 2.822 1.557 0.834, 2.907
>M 1.114 0.718, 1.727 1.542 0.925, 2.572 1.076 0.654, 1.769
Cladosporium Q1 1.000 0.885 1.000 0.747 1.000 0.625
Q2 0.997 0.665, 1.492 0.886 0.533, 1.473 0.956 0.580, 1.576 Q3 0.858 0.549, 1.342 0.957 0.576, 1.592 0.850 0.519, 1.394 Q4 1.098 0.703, 1.714 1.080 0.658, 1.773 0.924 0.532, 1.604
Curvularia 0 1.000 0.662 1.000 0.009 1.000 0.732
≤M 1.033 0.703, 1.518 0.660 0.416, 1.048 0.948 0.595, 1.511 >M 1.091 0.739, 1.612 0.517* 0.310, 0.861 0.928 0.589, 1.462
Fusarium No 1.000 1.000 1.000
Yes 1.011 0.714, 1.431 0.861 0.573, 1.294 0.910 0.578, 1.433
Nigrospora 0 1.000 0.698 1.000 0.323 1.000 0.063
≤M 1.116 0.725, 1.717 0.738 0.436, 1.251 1.291 0.788, 2.116
>M 0.933 0.637, 1.368 0.793 0.511, 1.232 1.535 0.979, 2.407
Periconia 0 1.000 0.755 1.000 0.909 1.000 0.220
≤M 0.751 0.506, 1.115 0.905 0.553, 1.481 1.086 0.703, 1.679
>M 0.971 0.666, 1.415 0.975 0.635, 1.497 0.729 0.470, 1.130
Smuts Q1 1.000 0.819 1.000 0.971 1.000 0.193
Q2 1.010 0.645, 1.582 0.697 0.403, 1.205 1.003 0.582, 1.729 Q3 0.952 0.608, 1.490 0.613 0.348, 1.082 1.324 0.791, 2.216 Q4 0.961 0.563, 1.639 1.035 0.571, 1.877 1.391 0.751, 2.577
Torula 0 1.000 0.604 1.000 0.521 1.000 0.580
≤M 0.885 0.565, 1.387 0.854 0.487, 1.497 1.329 0.806, 2.192
>M 0.918 0.641, 1.316 0.875 0.575, 1.334 1.084 0.719, 1.635 p-value < 0.05 ** p-value < 0.005
Bold-faced showed statistically significant trend.
Q1-Q4: First to forth quartile.
No /0: Specific fungal spores did not present.
Yes: Specific fungal spores presented.
≤M: Fungal spore concentrations were below median.
>M: Fungal spore concentrations were above median.
doi:10.6342/NTU20160286732
Figure 1 Temporal trend of the most prevalent fungal spores monthly average concentrations in 2015
doi:10.6342/NTU20160286733
ure 2 Temporal trend of total fungal spore concentrations and monthly average of emergency asthma visits in NTUH in 2015
doi:10.6342/NTU20160286734
Figure 3 Temporal variation of monthly average of emergency visits for asthma among different age groups in NTUH in 2015