國立臺灣大學公共衛生學院流行病學與預防醫學研究所 碩士論文
Institute of Epidemiology and Preventive Medicine College of Public Health
National Taiwan University Master Thesis
臺灣老年族群結核病危險因子分析
Risk Factors of Tuberculosis in Elderly Population in Taiwan
陳鳳君
Feng-Chun Chen
指導教授:林先和 博士 Advisor: Hsien-Ho Lin, Sc.D.
中華民國 108 年 1 月
January 2019
摘要
背景
結核病是在全球導致生病及死亡的主要傳染病之一,雖然近年來結核病的發生率 逐年下降,但仍需要更多努力來進一步控制疫情。在台灣,老年族群的結核病發 生率至少是其他年齡層的三倍以上,為了進一步了解老年族群有高發生率的原 因,我們進行了一個針對台灣老年族群的結核病危險因子分析,探討已知危險因 子所造成的結核病風險以及尋找老年族群的新結核病危險因子,了解危險因子對 於台灣老年族群結核病疫情造成的影響。
方法
研究族群是臺灣2001、2005 及 2009 年國民健康訪問調查中大於 65 歲的參與
者,使用結核病通報系統來定義新發生的結核病個案,納入的危險因子變項包括 人口學、健康狀態、健康行為變項以及針對老年族群的特殊變項。我們計算暴露
在不同危險因子時的發生率並使用Cox 比例風險模式進行存活分析了解危險因子
對於老年族群活動性結核發病所造成的風險。此外,我們還計算了危險因子的族 群可歸因分率來觀察危險因子對於臺灣整體族群的實際影響。所有分析皆使用研
究族群考慮抽樣方法的權重值,並使用SAS 9.4 進行分析。
結果
經過了平均 5.85 年的追蹤,在 4,657 個參與者中有 67 個活動性結核病發病且有 1,236 個參與者在追蹤期間死亡。平均的結核病發生率為每十萬人年 227 (95%CI:
179-288) 個病例。大於 85 歲、男性、BMI 偏低以及有肺部疾病共病症的老人擁
有較高的活動性結核病發病風險,肺部疾病共病症的族群可歸因分率為16.4%。
但在研究結果中沒有發現新的老年族群結核病危險因子擁有統計上顯著結果。
結論
本研究結果顯示肺部疾病共病症與BMI 偏低的老年人擁有顯著較高的結核病風
險,雖然沒有辦法找到新的老年族群結核病危險因子,但老年族群在結核病疫情 的重要性不可忽視且仍需要未來的研究進一步探討。
關鍵詞:結核病、危險因子、老年族群、世代追蹤研究、肺部疾病
Abstract
Introduction
Tuberculosis (TB) is one of the leading infectious causes of mortality and morbidity in the world. Although the incidence rate has been decreasing slowly these years, there is still need efforts to prevent the disease. In Taiwan, the incidence of TB in the elderly is at least three times higher than in other age groups. To further understand the high incidence rate in the elderly, we conduct a risk factors analysis for the elderly
population in Taiwan. We aim to indicate the real risk caused by well-known risk factors for TB among elders and identify novel elderly specific risk factors in Taiwan.
Methods
The study population was elderly participants from Taiwan’s 2001, 2005 and 2009 National Health Interview Survey (NHIS). Information for incident active TB cases was collected from the National TB registry dataset. Risk factors under consideration
included demographic, health status, health behavior variables, and elderly specific variables. Incidence rates were calculated to show TB epidemic under exposure of different risk factors. Cox regression models were conducted to estimate hazard ratios for risk factors of TB and to find novel risk factors specific to the elderly. Population attributable fraction was calculated to show the impact of risk factors in Taiwan. All
estimates accounted for study design were weighted.
Results
After average 5.85 years of follow-up, 67 TB cases occurred and 1,236 (26.5%) participants died among 4,657 participants. The incidence rate of TB during research period was 227 (95%CI: 179-288) per 100,000 person-year. Elderly with features of older age, male, low body mass index (BMI) or past history of lung disease had a significant association with active TB. If the distribution of lung disease was in a
counterfactual situation, 16.4% of total cases could be prevented. Two novel risk factors show a positive result of increasing TB risk but without statistical significance.
Conclusion
Elderly population with past history of lung disease and low BMI status have
significantly higher risk of active TB. Through findings in the study, the real effect of novel risk factors cannot be ascertained. The association between novel risk factors and active TB should be further explored through future research.
Key words: Tuberculosis, risk factors, elderly population, cohort study design, lung disease
Content
摘要 ... i
Abstract ... iii
Content ... v
Chapter 1 Introduction ... 1
1.1 Tuberculosis epidemiology ... 1
1.2 Potential role of risk factors for Tuberculosis among elderly ... 3
1.3 Knowledge gap and study aim ... 4
Chapter 2 Materials and Methods ... 5
2.1 Study population and follow up ... 5
2.2 Measurement of risk factors ... 6
2.3 Measurements of active TB ... 7
2.4 Statistical analysis ... 7
2.4.1 incidence rate and survival analysis ... 7
2.4.2 Population attributable fraction (PAF) ... 8
2.4.3 Elderly specific risk factors analysis ... 9
Chapter 3 Results ... 11
3.1 Baseline characteristic ... 11
3.2 Incidence rate and follow-up result ... 11
3.3 Survival analysis ... 12
3.4 Population attributable fraction (PAF) ... 12
3.5 Elderly specific risk factors analysis ... 13
Chapter 4 Discussion ... 14
4.1 Summary ... 14
4.2 Previous studies of risk factors ... 14
4.3 Strengths and limitations ... 17
4.4 Implications ... 17
4.5 Conclusion ... 18
References ... 36
List of Figures
Figure 1. TB incidence rate and standardized incidence rate (adjusted to the 2005
Taiwan population) in Taiwan (2005-2017) ... 19
Figure 2. Age-specific TB incidence rate in Taiwan (2005-2018) ... 20
Figure 3. Percentage of elderly TB cases in Taiwan (2005-2016)... 21
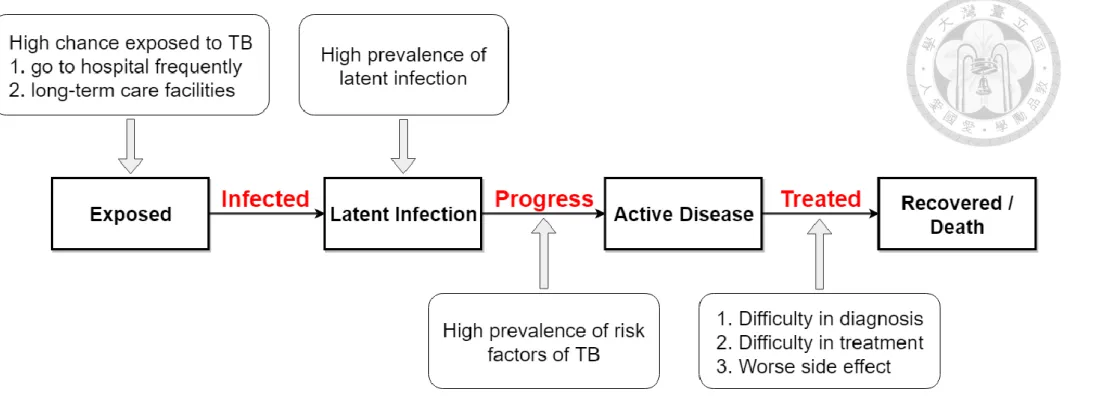
Figure 4. Natural history of TB and risk factors in elderly population ... 22
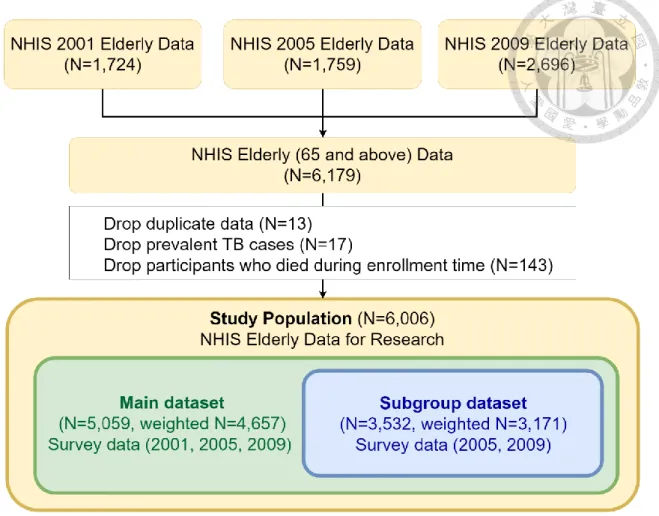
Figure 5. Flow chart of study population exclusion process and the sample size ... 23
List of Tables
Table 1. ICD-9 code and inclusion criteria for comorbidities in National Health
Insurance ... 24 Table 2. Baseline descriptive characteristic of study population ... 25 Table 3. the number of TB cases and incidence rate (95% CI) distribution of variables 27 Table 4. Univariate and multivariate Cox regression models for association between risk factors (variables) and risk of TB in main dataset ... 29 Table 5. Analysis of multivariate Cox regression models for association between risk
factors (variables) and risk of TB in main dataset ... 31 Table 6. Univariate Cox regression models for association between risk factors
(variables) and risk of TB in subgroup dataset ... 32 Table 7. Adjusted hazard ratio of multivariate Cox regression models in subgroup
dataset ... 35
Chapter 1 Introduction 1.1 Tuberculosis epidemiology
Tuberculosis (TB) is one of the leading infectious causes of mortality and morbidity in the world. Globally, 10.0 (range: 9.0-11.1) million people fell ill with active TB, and around 1.3 million died from the disease in 2017[1]. It is estimated that about 1.7 billion people, 23% of the world's population, have latent TB infection (LTBI) and possibly progress to active TB in their lifetime [1]. Although the incidence rate of TB has been decreasing slowly these years, how to maintain or even accelerate the declining trend for reaching the goal of End TB strategy remains a global challenge.
In Taiwan, we are facing a similar challenge. The incidence rate of TB in Taiwan estimated by Taiwan Centers for Disease Control (Taiwan CDC) shows a steady but slow decreasing trend (Figure 1, Blue line). Elderly population those who aged 65 and above has an especially high incidence rate of TB. The risk of developing TB in elders was at least three times higher than other age groups (Figure 2). Based on the related reports of TB from the government, more than half of the new TB cases are elderly people and the proportion is still rising in Taiwan (Figure 3). From previous discussions, it can be seen that the TB epidemic in elderly population may be a major contributor to
the incidence of total TB cases in Taiwan. It is necessary to better understand the reasons for high incidence rate of active TB in elders.
Additionally, the change in age structure may also have a huge impact on the TB epidemic. Due to the innovation of medicine, the fertility rate is decreasing and the life expectancy is getting longer. The elderly population becomes a major part of the total population. The major contributor of age structure changing is population aging which had received considerable critical attention these years. The number of people aged 60 and over is estimated to increase to over two thousand million and the percentage of the elderly will become 21.5% of the total worldwide population in 2050 [2]. In Taiwan, the proportion of the population over 65 years old keeps increasing since 2001, from 8.65%
in Jan 2001 to 14.13% in May 2018. Nowadays, Taiwan is an aged society (the
proportion of people aged 65 years and over is 14% or higher) and expected to become a super-aged society (the proportion of people aged 65 years and over is over 20%) in eight years. Figure 1 shows the incidence rate (blue line) and the standardized incidence rates (green line) which were age-adjusted to the 2005 Taiwan population. The
standardized incidence rate shows relatively fast drop than observation. It means that if the age structure did not change through the time, the incidence rate of active TB would
be much lower. The difference between incidence rate and standardized incidence rate might demonstrate the impact of population aging on TB epidemics these years.
1.2 Potential role of risk factors for Tuberculosis among elderly
To controlling the TB epidemic, we need to know the reasons of high TB incidence in the elderly. Figure 4 shows that in different stages of TB natural history, which factors or features that may cause a higher risk in the elderly population. The risk factors for TB have been studied for many years. Many factors, such as diabetes, malnutrition, tobacco smoking and the harmful use of alcohol, have been proved by research that could increase the risk of developing TB [3-8]. However, the real effect of risk factors could be different between elderly population and younger population. In previous research of TB risk factors, the majority of the studies focused on all population, only very few of them focused on aged people. Research from the U.S. has studied the risk factors for TB by using US population data from the government. They calculated the incidence rate ratio of variables in different age groups. The result showed that elders had a higher risk of TB especially for men, American Indians/Alaska Natives, those in long-term care facilities and foreign-born [9]. Additionally, a research team in Hong Kong studied risk factors of TB based on an elderly cohort of patients from elderly service centers in Hong Kong [10-12]. They found that smoking, passive smoking, diabetes, and glycemic
control had related to the risk of TB in elderly population.
1.3 Knowledge gap and study aim
The disparity in incidence rate between elders and other age groups is greater than the difference of LTBI prevalence between older adults and younger population. The high prevalence of LTBI could not completely explain the high incidence rate in the elderly.
It is still not been proven that elders have higher progression rate of reactivation TB.
Thus, if we need to find the reason of high incidence in elderly, we can conduct research related to risk factors of TB, especially in elderly population. In addition, due to the differences between study populations, such as different countries, culture, race, and lifestyle, the result cannot infer to other countries. To better understand the real situation in our country, we need information from residents in Taiwan to conduct research related to risk factors of TB for the elderly population.
The aim of this study is to understand the TB risk caused by risk factors in the elderly population in Taiwan and to find novel risk factors which are potentially affected the TB epidemic in elders.
Chapter 2 Materials and Methods 2.1 Study population and follow up
The study population was elderly participants (aged 65 and over) from Taiwan’s National Health Interview Survey (NHIS) conducted in 2001, 2005 and 2009.
Individuals in the NHIS were multistage stratified systematic sampling from the total population of Taiwan and the contents of the personal questionnaire had all-over aspects of health-related factors.
We linked the NHIS database to the National Health Insurance (NHI) database to obtain medical information of our study population. Therefore, participants without permission for NHI claim data were excluded. Additionally, the NHIS database was also linked to the TB notification dataset and vital registry dataset to identify incident cases of active TB and deaths during follow-up.
6,179 records of elderly participants were included from three rounds of the NHIS. We excluded participants without permission for NHI claim data and eliminated duplicate data of participants. we also excluded 17 prevalent TB cases and 143 deaths during enrollment time. Participants who had missing information in survey data were excluded in the analysis, too. In the end, 5,059 participants were followed up in this study (see Figure 5 for study flow chart). To achieve the nationally representative, all
data in this study were accounted for study design by weight. After weighting, there are 4,657 participants in the study population.
The start of follow-up time was defined as the last date of the exclusion time interval for prevalent TB (30 April 2002, 30 November 2005, and 31 May 2010) and followed until participants died, progressed to active TB or the end date of follow-up (31 December 2013).
2.2 Measurement of risk factors
The information about risk factors for the study population is collected from the NHIS and NHI database. We enrolled variables which are related to demographic information, medical history and simple lifestyle factors. These variables included age, sex, body mass index (BMI), education, marital status, lung disease, diabetes, chronic kidney disease, alcohol use, smoke, betel use, employment, personal income and visits of medical centers.
BMI is defined by information of height and weight from the survey. Comorbidities, such as diabetes, lung disease, and chronic kidney, were defined by the information from the NHIS and the NHI database. We use two kinds of definition of comorbidities:
1) answers of questionnaires (having the disease and is taught by health care providers/practitioners), 2) answers of questionnaires or medical record of disease
(inclusion criteria see Table 1). Lung disease included chronic bronchitis, emphysema, asthma, bronchiectasis and chronic obstructive pulmonary disease (COPD).
Alcohol use, smoke, and betel use were divided into two groups, never and ever use.
visits of medical centers were calculated by medical records from the NHI database and the time interval was two years before the enrollment date of the survey.
2.3 Measurements of active TB
The outcome variable was active TB. TB belongs to the third category of notifiable infectious disease in Taiwan. Under the law, all suspected or confirmed TB cases have to be notified to National TB Registry in one week. Through the no-notification-no- reimbursement policy and the notification-fee policy, the completeness of TB
notification reporting was improved [13]. In 2011, the notification rate of TB in Taiwan is up to 96.3% [14]. In this study, active TB was defined as having smear-positive or culture positive test result based on the information from Taiwan CDC TB notification data.
2.4 Statistical analysis
2.4.1 incidence rate and survival analysis
The incidence rate and its 95% confidence interval (CI) were calculated to show the
observation number of TB incidence under different exposure to risk factors.
We used the Cox proportional hazards model to consider the follow-up time and conducted the univariate and multivariable analyses of risk factors associated with active TB. The crude hazard ratio of all variable was calculated. Then variables with a significant result (p-value < 0.15) would be included in multivariate Cox regression models to identify the real effect of risk factors by controlling the confounders. The univariate and multivariate Cox regression analyses were done twice with the different definition of variables:
1) the number of survival time was rounded to the nearest integer and the definition of comorbidities only included information from the NHIS (having the disease and is taught by health care providers/practitioners).
2) the number of survival time was not rounded to the nearest integer and the definition of comorbidities included information from the NHIS and medical records from the NHI.
All estimates were weighted and all analyses were done by SAS 9.4.
2.4.2 Population attributable fraction (PAF)
In order to indicate the real impact of the risk factors, the PAF was calculated. Under the assumption of PAF, we could understand if the exposure of risk factors is under
counterfactual condition then how many percentages of disease cases will not occur.
The PAF of risk factors with the significant result in multivariate Cox regression would be calculated by using the formula below:
PAF = 𝑃(𝐸) × (𝑅𝑅 − 1) 1 + 𝑃(𝐸) × (𝑅𝑅 − 1)
P(E) is the prevalence of risk factors in all study population. RR is the relative risk of risk factors. Here, we use the hazard ratio to replace it, but the result will not be changed.
2.4.3 Elderly specific risk factors analysis
In the 2005 and 2009 NHIS, the survey was added new questions which are specific for the elderly population. In order to find novel risk factors of TB in elders. We generated a subgroup dataset from the study population. This dataset only included 3,532 elderly participants in 2005 and 2009 NHIS (weighted n=3,171), but the information of participants was more. Potential risk factors which were considered in this study included life-communication, perceived health status, perceived changes in intake associated with dental health, perceived malnutrition, fall, Activity of Daily Livings
(ADLs), Instrumental Activities of Daily Livings (IADLs), mobility, long-term care facility, other care systems, hire caregivers, and depression (defined by The Center for
Epidemiologic Studies Depression Scale (CES-D)). Univariate and Multivariate Cox
regression models were conducted to find the association between these potential risk factors and active TB in elderly.
Chapter 3 Results 3.1 Baseline characteristic
After consideration of sampling weights, there are 4,657 participants in our study population. The baseline descriptive characteristic of the study population was shown in Table 2.The mean age is 73.4 years (SD:6.05) and about half of the participants were male (53.6%). Due to the features of elderly participants, majority of study population was with lower education level and unemployed which was caused by retirement. The proportions of comorbidities have a difference between two kinds of definition, especially in lung disease. The prevalence of lung disease defined by NHIS and NHI information was 30.2%, around 5 times higher than defined by NHIS information.
3.2 Incidence rate and follow-up result
During average 5.85 years of follow-up, 67 TB cases occurred and 1,236 participants died. The higher percentage of death is due to the old age of the study population.
The incidence rate of study population is 227 (95% CI: 179-288) per 100,000 person- year. As we can see in Table 3, older male and participants with lung disease have a high incidence rate. The incidence rate of male in elderly was 367 per 100,000 person-year (95% CI: 305-441) and the incidence rate of elders with lung disease was 363 per 100,000 person-year (95% CI: 275-480). The incidence rate in different NHIS survey
year 2001, 2005, 2009 are 183, 285, 72, respectively.
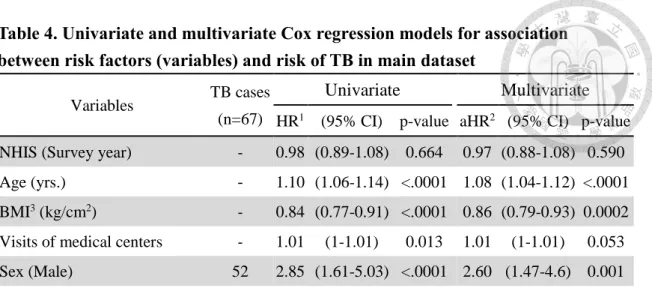
3.3 Survival analysis
Table 4 shows the results of survival analysis. After adjusting for other risk factors which had p-value lower than 0.15 in univariate analysis, well-known risk factors had significantly increased the risk of active TB in elderly population. As can be seen in Table 5, the adjusted hazard ratio (aHR) was 3.07 (95% CI: 1.67-5.66) comparing older men to older women; when elderly turned one year older, the hazard of active TB increased 8% (aHR: 1.08, 95%CI: 1.04-1.12); the higher BMI reduced the risk of developing TB (aHR: 0.86, 95%CI: 0.79-0.93). Additionally, elderly with lung disease had significant results when we considered the information in the NHI; the aHR of active TB for lung disease was 1.60 (95%CI: 0.97-2.66) (Table 5).
3.4 Population attributable fraction (PAF)
Several risk factors had a significant result in multivariate Cox regression. Only the PAF of lung disease was calculated. Since the assumption of PAF is the variable can become a counterfactual condition, lots of variables which includes survey year, sex, and age are unchangeable. Besides, according to the result of BMI, the counterfactual condition is all population becomes obese. The setting is not realistic under the public health conception. We only calculate the PAF of lung disease. The PAF of lung disease
is 16.4% (95%CI: -1.0%, 36.8%), which means that if there is no lung disease patient, 16.4% of total cases will not occur.
3.5 Elderly specific risk factors analysis
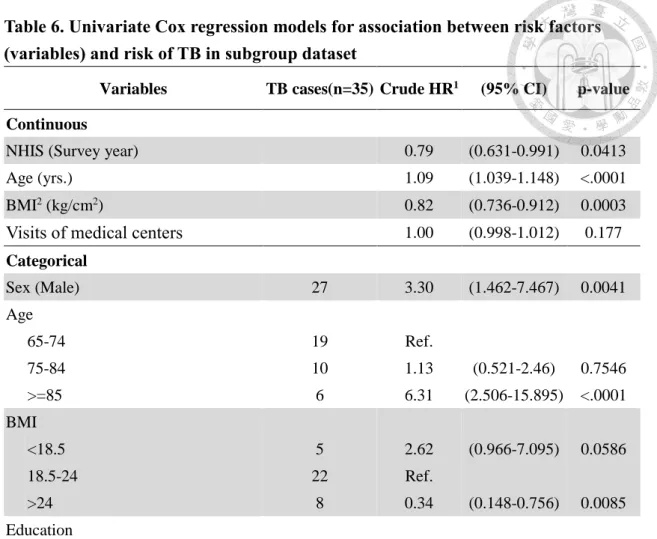
In the result of univariate Cox regression models for elderly-specific risk factors (Table 6), intake affected by teeth health and Hire Caregiver had associated with active TB.
The crude hazard ratios were 2.012 and 3.373, respectively. After adjusting for confounders (age, BMI, sex, Lung disease, NHIS survey year and smoke), novel risk factors did not have significant results. The adjusted hazard ratio for intake affected by teeth health was 1.62 and the adjusted hazard ratio for hiring caregiver was 2.43 (Table 7). Despite the results were not significant, the risk raised by novel risk factors still needs more studies to discovered. The nonsignificant result might be caused by the small sample size and fewer events (TB cases= 35) of this study.
Chapter 4 Discussion 4.1 Summary
To understand the high incidence of developing TB in the elderly, we analyzed the association between risk factors and active disease. We observed the distribution of risk factors in older people in Taiwan and calculated the incidence rates with different risk factors. The incidence rate of TB in the elderly population in Taiwan is 227 (95%CI:
179-288) per 100,000 person-year during the research period. We conducted survival analysis for well-known risk factors to understand the risk of active TB in aged
population and calculated the PAF to realize the impact in the total population. Age, sex, BMI and lung disease had significant associations with active TB in the elderly
population. The result of PAF shows that if the distribution of lung disease was in the
counterfactual situation, 16.4% of total cases could be prevented. Although no novel risk factors show significant association with TB, the positive effect of variables could be further discussed in future research.
4.2 Previous studies of risk factors
Several studies suggest that the relative risks of risk factors are different in different age groups. Many proven risk factors have a lower relative risk (RR) for elders compared with RR for younger people [7, 15]. Probably, as a result of the relatively low RRs and
the limitation of small sample size in this study, we could not find the significant result for risk factors in the study population. Evidence to the contrary is that there are also several proven risk factors, like sex and BMI, did not show relatively low RR in elderly in previous research [16, 17]. In the result of these risk factors, we could find the significant result in our study. Though the RRs of some risk factors are relatively low in the elderly population, the estimates of ratios cannot completely present the real risk of disease. The absolute risk difference could be huge in the elderly population. Therefore, the impact of risk factors still cannot be ignored. Apart from the different impact of risk factors on age groups, the importance of risk factors also needs to be discussed. The importance of risk factors not only includes the relative risk caused by the factor, but also the prevalence of these risk factors in the total population. The population attributable fraction shows the importance of risk factors.
In the previous studies, we found that the congregate settings such as long-term care facilities have been seen as a risk factor for TB [18]. Research in the US shows that the elderly who lived in long-term care facilities had a risk 2.3 times higher risk compared with those not living in long-term care facilities [9]. Despite that in our study, limited by the small sample size, people who lived in long-term care facilities did not report active
TB cases during follow-up, this risk factor cannot be ignored. As the long-term care policy was implemented in Taiwan, the impact of living in long term care facilities on TB risk seems to become more visible.
The adjusted hazard ratio of smoking is 0.66 (95% CI: 0.39-1.14) in our study. The result is different from previous research. Many studies had found that smoking could cause higher risk of TB. We included both lung disease and smoking in the multivariate Cox regression analysis. The association of lung disease and smoking might cause the bias of the result. Furthermore, research shows a lower relative risk in elderly
population. There might be healthy worker effect in the study population [19, 20]. We also found similar results in previous research. A study related to passive smoking and risk of TB shows that adjusted HR decreased with increasing age [21].
The trend of incidence rate in different survey year was inconsistent with observation.
In global and Taiwan’s report, incidence rate of TB keeps decreasing every year[1, 22- 24]. However, participants in NHIS 2005 has highest estimates of incidence rate in our result. Possible reasons might be the increasing baseline age of participants in different survey year. A further analysis and discussion are needed to explain this situation.
4.3 Strengths and limitations
The strength of our study is the representative of the study population. Because the survey is sampled from the total population, the statistical result of the study population could show the real condition of our target population, the population in Taiwan.
Compared with the incidence rate reported by Taiwan CDC, the incidence rate in this study is consistent with the real number. Some limitations exist in the study. The smaller number of events reduced the statistical significance of the result. In addition, variables are defined by the respondents’ self-recognition which could cause information bias and many missing of data. In order to include all elderly participants, some variables with a high percentage of data missing were not considered in the research. For example, we did not analyze the association between cognition related indicator – MMSE and active TB.
4.4 Implications
Researchers in China suggested that TB vaccination would have higher population-level impact (reduction of incidence and mortality rate) when delivered to elderly population than delivered to adolescents [25] in the result of modeling research. Through research related to TB risk factors, we can find the high-risk population in elders and increase effectiveness of policy implemented for active TB prevention.
4.5 Conclusion
In the trend of population aging, in order to further control the epidemic situation of TB, it is necessary to reduce the incidence of the elderly population. Through this study, we can further understand the importance of different risk factors. Apart from unchangeable determinants, such as age and sex, past history of lung disease and abnormal BMI have a significant impact on the risk of active TB in elders. In addition, due to the limits of the sample size, we cannot ascertain the real effect of novel risk factors. The association between novel risk factors and active TB should be further explored through future research. As society progression, more useful tools or methods will be developed for diagnosis or treatment. We hope through this study more research could put efforts in elders and care more about elderly in TB epidemiology.
Figures
Figure 1. TB incidence rate and standardized incidence rate (adjusted to the 2005 Taiwan population) in Taiwan (2005-2017) (Adapted from Taiwan CDC data[22-24])
72.5
67.4
63.2 62
57.8 57.2
54.5 53
49.4 48.4
45.7 43.9
41.4 65.5
60.1 57.8
52.3 50.4
46.9 45
41 38
0 10 20 30 40 50 60 70 80
2005 2006 2007 2008 2009 2010 2011 2012 2013 2014 2015 2016 2017
Cases per 105 population
Tuberculosis incidence rate in Taiwan (2005-2017)
incidence rate
standardized incidence rate
Figure 2. Age-specific TB incidence rate in Taiwan (2005-2018) (Adapted from Taiwan CDC data[26])
0 50 100 150 200 250 300 350 400
10-14 15-19 20-24 25-29 30-34 35-39 40-44 45-49 50-54 55-59 60-64 ≥ 65
Age-specific TB incidence rate in Taiwan (2005-2018)
2005 2006 2007 2008 2009 2010 2011 2012 2013 2014 2015 2016 2017
2005 2006 2007 2008 2009 2010 2011 2012 2013 2014 2015 2016 2017 2018
10-14 4.7 4.8 3.8 4.5 3.8 3.5 4.1 3.2 2.7 2.2 2.0 2.0 1.5 1.7
15-19 23.9 24.0 21.4 19.2 22.3 18.6 18.4 15.5 15.2 15.8 12.4 10.1 9.4 8.0 20-24 32.7 30.8 28.3 29.0 22.5 23.5 23.1 19.8 19.2 15.3 14.0 13.5 12.2 10.3 25-29 32.3 26.9 25.5 28.1 22.9 24.5 21.1 20.5 17.1 16.2 15.9 12.3 12.5 10.5 30-34 35.3 29.6 27.3 25.9 22.2 21.5 22.4 19.3 19.4 19.0 15.5 15.6 13.3 12.2 35-39 36.5 34.3 30.8 31.5 27.7 24.6 24.8 24.3 22.7 20.0 17.2 15.6 15.8 13.4 40-44 46.1 43.7 39.8 38.2 31.7 33.3 29.7 29.1 27.8 24.2 21.1 17.9 18.9 15.3 45-49 56.0 52.1 48.5 44.5 42.1 39.6 39.4 37.2 34.0 32.0 28.9 26.8 24.2 20.8 50-54 71.1 68.0 58.7 56.6 52.6 51.9 49.1 48.5 41.4 42.4 38.4 37.4 34.9 31.1 55-59 90.3 83.7 79.5 70.4 67.0 63.5 60.9 60.2 52.7 52.2 48.5 47.9 45.0 37.1 60-64 142.6 120.1 109.0 100.0 87.9 86.0 75.1 77.0 65.0 67.9 66.7 61.9 54.6 49.1
≥ 65 373.0 338.5 314.9 306.4 284.7 279.3 258.8 246.1 227.2 215.8 199.6 187.0 169.3 150.3
Figure 3. Percentage of elderly TB cases in Taiwan (2005-2016) (Adapted from Taiwan CDC data[27])
51.0% 51.0%
51.6%
52.2%
53.1% 52.9%
52.3% 52.1%
53.0% 53.5%
54.7%
56.2%
48%
49%
50%
51%
52%
53%
54%
55%
56%
57%
2005 2006 2007 2008 2009 2010 2011 2012 2013 2014 2015 2016
Percentage of elderly TB cases in Taiwan
Figure 4. Natural history of TB and risk factors in elderly population
Figure 5. Flow chart of study population exclusion process and the sample size All participants without permission for NHI claim data were excluded. The 2001 NHIS did not have elderly specific questionnaires. Elderly participants enrolled from 2001 NHIS were extracted from total participants by age. Main dataset and subgroup dataset only contained participants without missing information in the survey.
Tables
Table 1. ICD-9 code and inclusion criteria for comorbidities in National Health Insurance
Comorbidities ICD-9 code inclusion criteria
Diabetes 250 outpatient records ≥ 3 or inpatient
records ≥ 1 before the survey Lung disease 491, 492, 493, 494, 496 outpatient records ≥ 2 or inpatient
records ≥ 1 before the survey Chronic kidney disease 585
Table 2. Baseline descriptive characteristic of study population
Characteristic Mean (std.) / N (%)
(Total = 4,657)
Age (yrs.) 73.4 (6.05)
Body Mass Index (BMI) (kg/cm2) 23.9 (3.41)
Visits of medical centers 15.7 (34.02)
Sex
Male 2,495 (53.6%)
Female 2,162 (46.4%)
Education
Less than elementary school 1,343 (28.8%)
elementary school 1,914 (41.1%)
Junior high school 517 (11.1%)
Senior high school and above 882 (19.0%)
Marital status
Never married 82 (1.8%)
Married or cohabiting 3,129 (67.2%)
Widowed, divorced, separated, or others 1,445 (31.0%)
Lung disease NHIS 318 (6.84%)
NHIS & NHI 1,406 (30.2%)
Diabetes NHIS 832 (17.87%)
NHIS & NHI 1,095 (23.5%)
Chronic Kidney Disease NHIS 377 (8.09%)
NHIS & NHI 440 (9.5%)
Alcohol use 1,396 (30.0%)
Smoke 1,438 (30.9%)
Betel use 370 (8.0%)
Employed 684 (14.7%)
Personal income
Less than 5,000 1,845 (39.6%)
5,000-15,000 1,637 (35.2%)
More than 15,000 1,175 (25.2%)
Characteristic N (%) (Total = 4,657) NHIS (Survey year)
2001 1,192 (25.6%)
2005 1,425 (30.6%)
2009 2,040 (43.8%)
Note. The result is under consideration of sampling weight. Comorbidities (lung disease, diabetes, and chronic kidney disease) had two definitions. 1) answers of questionnaires (having the disease and is taught by health care providers/practitioners).
2) answers of questionnaires or medical record of disease from NHI database.
Table 3. the number of TB cases and incidence rate (95% CI) distribution of variables
Variables TB case Incidence rate1 (95% CI)
Total 67 227 (179-288)
Sex
Male 52 367 (305-441)
Female 15 101 (79-129)
Education
Illiterate or elementary school 16 98 (71-137)
Junior high school 27 210 (170-261)
Senior high school 8 172 (87-341)
College and above 16 384 (291-506)
Marital status
Never married 1 194 (23-1603)
Married or cohabiting 48 202 (171-239)
Widowed, divorced, separated, or other 18 156 (113-214) Lung disease
No 60 160 (134-191)
Yes 7 363 (275-480)
Diabetes
No 58 185 (158-217)
Yes 9 226 (152-337)
Chronic Kidney Disease
No 61 187 (161-218)
Yes 6 280 (136-574)
Alcohol use
Never 48 185 (157-217)
Ever 20 219 (153-313)
Smoke
Never 45 179 (151-211)
Ever 22 249 (180-344)
Betel use
Never 61 185 (159-215)
Ever 7 384 (203-726)
Variables TB case Incidence rate1 (95% CI) Employment
Employed 55 180 (154-211)
Unemployed 13 290 (194-436)
Personal income
Less than 5,000 27 177 (145-217)
5,000-15,000 19 111 (76-162)
More than 15,000 22 354 (272-460)
NHIS (survey year)
2001 36 183 (146-229)
2005 23 285 (230-353)
2009 8 72 (44-119)
Note. The result is under consideration of sampling weight.
1Incidence rate, the unit of incidence rate is per 100,000 person-year
Table 4. Univariate and multivariate Cox regression models for association between risk factors (variables) and risk of TB in main dataset
Variables TB cases (n=67)
Univariate Multivariate HR1 (95% CI) p-value aHR2 (95% CI) p-value NHIS (Survey year) - 0.98 (0.89-1.08) 0.664 0.97 (0.88-1.08) 0.590 Age (yrs.) - 1.10 (1.06-1.14) <.0001 1.08 (1.04-1.12) <.0001 BMI3 (kg/cm2) - 0.84 (0.77-0.91) <.0001 0.86 (0.79-0.93) 0.0002 Visits of medical centers - 1.01 (1-1.01) 0.013 1.01 (1-1.01) 0.053 Sex (Male) 52 2.85 (1.61-5.03) <.0001 2.60 (1.47-4.6) 0.001
Age
65-74 36 Ref.
75-84 23 1.73 (1.02-2.92) 0.042
>=85 8 5.47 (2.54-11.81) <.0001 BMI
<18.5 7 1.75 (0.79-3.85) 0.168
18.5-24 47 Ref.
>24 13 0.28 (0.15-0.53) <.0001
Education
less than elementary school 16 0.73 (0.36-1.46) 0.374 elementary school 27 0.84 (0.45-1.56) 0.577 Junior high school 8 0.91 (0.39-2.11) 0.829
Senior high school and above 16 Ref.
Marital status
Never married 1 Ref.
Married or cohabiting 48 1.19 (0.14-10.02) 0.875
Others4 18 1.14 (0.13-9.88) 0.908
Lung disease 7 1.36 (0.63-2.93) 0.429
Diabetes 9 0.81 (0.4-1.63) 0.549
Chronic Kidney Disease 6 1.35 (0.6-3.04) 0.468 Alcohol use 20 1.24 (0.73-2.11) 0.424
Smoke 22 1.17 (0.7-1.94) 0.556
Betel use 7 1.57 (0.7-3.52) 0.277
Employed 13 1.27 (0.69-2.35) 0.441
Variables TB cases (n=67)
Univariate Multivariate HR1 (95% CI) p-value aHR2 (95% CI) p-value Personal income
Less than 5,000 27 0.73 (0.42-1.29) 0.285 5,000-15,000 19 0.77 (0.42-1.43) 0.413 More than 15,000 22 Ref.
Note. The result is under consideration of sampling weight. The numbers of survival time were rounded to the nearest integer. The definition of comorbidities only included information from the NHIS.
1 Hazard Ratio
2 Adjusted Hazard Ratio
3 Body Mass Index (kg/cm2)
4 Widowed, divorced, separated, or other
Table 5. Analysis of multivariate Cox regression models for association between risk factors (variables) and risk of TB in main dataset
Variable Multivariate
Adjusted HR 95% CI p-value
NHIS survey year 0.96 (0.87-1.07) 0.470
Sex (Male) 3.07 (1.67-5.66) <.001
Age 1.08 (1.04-1.12) <.001
BMI1 0.86 (0.79-0.93) <.001
Lung Disease 1.60 (0.97-2.66) 0.067
Smoke 0.66 (0.39-1.14) 0.140
Note. The result is under consideration of sampling weight. The definition of comorbidities included information from the NHIS and NHI.
1 Body Mass Index (kg/cm2)
Table 6. Univariate Cox regression models for association between risk factors (variables) and risk of TB in subgroup dataset
Variables TB cases(n=35) Crude HR1 (95% CI) p-value Continuous
NHIS (Survey year) 0.79 (0.631-0.991) 0.0413
Age (yrs.) 1.09 (1.039-1.148) <.0001
BMI2 (kg/cm2) 0.82 (0.736-0.912) 0.0003
Visits of medical centers 1.00 (0.998-1.012) 0.177
Categorical
Sex (Male) 27 3.30 (1.462-7.467) 0.0041
Age
65-74 19 Ref.
75-84 10 1.13 (0.521-2.46) 0.7546
>=85 6 6.31 (2.506-15.895) <.0001
BMI
<18.5 5 2.62 (0.966-7.095) 0.0586
18.5-24 22 Ref.
>24 8 0.34 (0.148-0.756) 0.0085
Education
less than elementary school 8 0.78 (0.281-2.157) 0.6301
elementary school 18 1.08 (0.449-2.593) 0.8642
Junior high school 2 0.56 (0.125-2.496) 0.4453
Senior high school and above 7 Ref.
Marital status
Never married 1 Ref.
Married or cohabiting 26 0.80 (0.093-6.829) 0.8361
Widowed, divorced, separated, or
other 8 0.62 (0.068-5.747) 0.6766
Lung disease 2 2.44 (1.252-4.745) 0.0088
Diabetes 5 0.99 (0.45-2.191) 0.9856
Chronic Kidney Disease 2 0.73 (0.199-2.686) 0.6374
Alcohol use 8 0.62 (0.277-1.402) 0.253
Smoke 14 1.74 (0.883-3.424) 0.1096
Betel use 4 1.32 (0.437-3.977) 0.6242
Employed 29 1.00 (0.418-2.394) 1
Variables TB cases(n=35) Crude HR (95% CI) p-value Personal income
Less than 5,000 12 0.74 (0.327-1.688) 0.4772
5,000-15,000 12 0.75 (0.332-1.697) 0.4901
More than 15,000 11 Ref.
Perceived health status
Bad 6 Ref.
General 20 0.81 (0.285-2.328) 0.701
Good 9 1.55 (0.602-3.972) 0.3657
Perceived changes in intake associated
with dental health 24 2.01 (0.975-4.154) 0.0585
Perception of malnutrition 3 1.83 (0.565-5.903) 0.3146
Fall 5 0.78 (0.299-2.053) 0.6191
Disability in ADLs3
No limitation (0) 33 Ref.
Mild limitation (1~6) 1 0.73 (0.137-3.864) 0.7094
Moderate-to-severe limitation
(7~18) 0 0.87 (0.044-17.068) 0.9264
Disability in IADLs4
No limitation (0) 27 Ref.
Mild limitation (1~6) 8 1.34 (0.598-3.016) 0.4757
Moderate-to-severe limitation
(7~18) 0 0.27 (0.014-5.298) 0.388
Disability in Mobility
No limitation (0) 17 Ref.
Mild limitation (1~8) 17 1.37 (0.699-2.692) 0.3585
Moderate-to-severe limitation
(9~24) 1 0.44 (0.05-3.857) 0.4567
Hire caregiver 2 3.37 (0.852-13.361) 0.0834
Depression (CES-D5) 2 0.93 (0.254-3.418) 0.9157
Life communication with others
0~2 15 Ref.
3~4 13 0.83 (0.395-1.748) 0.6256
5~9 7 0.82 (0.332-2.046) 0.6762
Note. The result is under consideration of sampling weight. The definition of comorbidities included information from the NHIS and NHI.
1Hazard Ratio
2Body Mass Index (kg/cm2)
3Activity of Daily Livings
4Instrumental Activities of Daily Livings
5The Center for Epidemiologic Studies Depression Scale
Table 7. Adjusted hazard ratio of multivariate Cox regression models in subgroup dataset
Variable Univariate Multivariate
HRa 95% CIb p-value aHRc 95% CI p-value NHIS survey year 0.79 (0.63-0.99) 0.041 0.79 (0.63-1) 0.046 Sex (Male) 3.30 (1.46-7.47) 0.004 3.09 (1.36-7.04) 0.007 Age 1.09 (1.04-1.15) <.001 1.05 (1-1.11) 0.048 BMId 0.82 (0.74-0.91) <.001 0.85 (0.76-0.94) 0.002 Lung Disease 2.44 (1.25-4.74) 0.009 2.08 (1.05-4.1) 0.036 Smoke 1.74 (0.88-3.42) 0.110 0.91 (0.43-1.94) 0.813 Intake affected by
teeth health 2.01 (0.98-4.15) 0.059 1.62 (0.78-3.38) 0.196 Hire Caregiver 3.37 (0.85-13.36) 0.083 2.43 (0.59-10.07) 0.221 Note. Variables with p-value < 0.15 in univariate analysis were included. The definition of comorbidities included information from the NHIS and NHI.
a Hazard Ratio
b Confidence Interval
c adjusted Hazard Ratio
References
1. World Health Organization, Global tuberculosis report 2018. 2018.
2. Scobie, J., et al., Global AgeWatch Index 2015: insight report. 2015: HelpAge International.
3. Lonnroth, K., et al., Alcohol use as a risk factor for tuberculosis - a systematic review. BMC Public Health, 2008. 8: p. 289.
4. Rehm, J., et al., The association between alcohol use, alcohol use disorders and tuberculosis (TB). A systematic review. BMC Public Health, 2009. 9: p. 450.
5. Lonnroth, K., G. Roglic, and A.D. Harries, Improving tuberculosis prevention and care through addressing the global diabetes epidemic: from evidence to policy and practice. Lancet Diabetes Endocrinol, 2014. 2(9): p. 730-9.
6. Lee, P.H., et al., Tuberculosis and diabetes in low and moderate tuberculosis incidence countries. Int J Tuberc Lung Dis, 2018. 22(1): p. 7-16.
7. Lin, H.H., et al., Association between tobacco smoking and active tuberculosis in Taiwan: prospective cohort study. Am J Respir Crit Care Med, 2009. 180(5):
p. 475-80.
8. Gupta, K.B., et al., Tuberculosis and nutrition. Lung India, 2009. 26(1): p. 9-16.
9. Hochberg, N.S. and C.R. Horsburgh, Jr., Prevention of tuberculosis in older adults in the United States: obstacles and opportunities. Clin Infect Dis, 2013.
56(9): p. 1240-7.
10. Leung, C.C., et al., Smoking and tuberculosis among the elderly in Hong Kong.
Am J Respir Crit Care Med, 2004. 170(9): p. 1027-33.
11. Leung, C., et al., Diabetic Control and Risk of Tuberculosis: A Cohort Study.
Vol. 167. 2008. 1486-94.
12. Leung, C.C., et al., Passive smoking and tuberculosis. Arch Intern Med, 2010.
170(3): p. 287-92.
13. Chiang, C.Y., et al., The impact of national health insurance on the notification of tuberculosis in Taiwan. Int J Tuberc Lung Dis, 2002. 6(11): p. 974-9.
14. Lo, H.Y., et al., Completeness and timeliness of tuberculosis notification in Taiwan. BMC Public Health, 2011. 11: p. 915.
15. Lee, P.H., et al., Glycemic Control and the Risk of Tuberculosis: A Cohort Study.
PLoS Med, 2016. 13(8): p. e1002072.
16. Horton, K.C., et al., Sex Differences in Tuberculosis Burden and Notifications in Low- and Middle-Income Countries: A Systematic Review and Meta-analysis.
PLoS Med, 2016. 13(9): p. e1002119.
17. Lin, H.H., et al., Association of Obesity, Diabetes, and Risk of Tuberculosis: Two Population-Based Cohorts. Clin Infect Dis, 2018. 66(5): p. 699-705.
18. Pratt, R.H., et al., Tuberculosis in older adults in the United States, 1993-2008. J Am Geriatr Soc, 2011. 59(5): p. 851-7.
19. Monson, R.R., Observations on the healthy worker effect. J Occup Med, 1986.
28(6): p. 425-33.
20. Pearce, N., H. Checkoway, and D. Kriebel, Bias in occupational epidemiology studies. Occup Environ Med, 2007. 64(8): p. 562-8.
21. Lin, H.-H., et al., Exposure to Secondhand Smoke and Risk of Tuberculosis:
Prospective Cohort Study. PLOS ONE, 2013. 8(10): p. e77333.
22. Taiwan Centers of Disease Control. CDC Monitor. 2019; Available from:
https://daily.cdc.gov.tw/stoptb/CareMagChart.aspx.
23. Chan, T.-C., et al. Taiwan Infectious Disease Map. 2019; Available from:
http://ide.geohealth.tw/.
24. Taiwan Centers of Disease Control. Taiwan National Infectious Disease Statistics System. 2019; Available from: http://nidss.cdc.gov.tw/en/.
25. Harris, R.C., et al., Age-targeted tuberculosis vaccination in China and implications for vaccine development: a modelling study. The Lancet Global Health, 2019. 7(2): p. e209-e218.
26. Taiwan Centers for Disease Control. Taiwan National Infectious Disease Statistics System. 2019; Available from: http://nidss.cdc.gov.tw/en/.
27. Taiwan Centers for Disease Control. Statistics of Communicable Diseases and Surveillance Report. 2019; Available from: http://www.cdc.gov.tw/english/.
![Figure 1. TB incidence rate and standardized incidence rate (adjusted to the 2005 Taiwan population) in Taiwan (2005-2017) (Adapted from Taiwan CDC data[22-24])](https://thumb-ap.123doks.com/thumbv2/9libinfo/9608385.633963/29.1262.89.1144.133.654/figure-incidence-standardized-incidence-adjusted-taiwan-population-adapted.webp)
![Figure 2. Age-specific TB incidence rate in Taiwan (2005-2018) (Adapted from Taiwan CDC data[26])](https://thumb-ap.123doks.com/thumbv2/9libinfo/9608385.633963/30.1262.85.947.147.607/figure-age-specific-incidence-rate-taiwan-adapted-taiwan.webp)
![Figure 3. Percentage of elderly TB cases in Taiwan (2005-2016) (Adapted from Taiwan CDC data[27])](https://thumb-ap.123doks.com/thumbv2/9libinfo/9608385.633963/31.1262.89.959.129.558/figure-percentage-elderly-cases-taiwan-adapted-taiwan-cdc.webp)