行政院國家科學委員會專題研究計畫 成果報告
自我運動追蹤術:應用於磁振造影血流速測定及高解析度 心臟造影術(II)
研究成果報告(精簡版)
計 畫 類 別 : 個別型
計 畫 編 號 : NSC 96-2320-B-011-001-
執 行 期 間 : 96 年 08 月 01 日至 97 年 07 月 31 日 執 行 單 位 : 國立臺灣科技大學電機工程系
計 畫 主 持 人 : 黃騰毅 共 同 主 持 人 : 劉益瑞
計畫參與人員: 碩士班研究生-兼任助理人員:唐育尉 碩士班研究生-兼任助理人員:王禹舜 碩士班研究生-兼任助理人員:陳俊文 碩士班研究生-兼任助理人員:林恩立 碩士班研究生-兼任助理人員:蔡宜錄
報 告 附 件 : 出席國際會議研究心得報告及發表論文
處 理 方 式 : 本計畫涉及專利或其他智慧財產權,2 年後可公開查詢
中 華 民 國 97 年 10 月 29 日
行政院國家科學委員會專題研究計畫成果報告
自我運動追蹤術:應用於磁振造影血流速測定及高解析度心臟造影術 計畫編號: NSC-96-2320-B-011-001
執行期限:96 年 8 月 1 日至 97 年 7 月 31 日 主持人:黃騰毅 台灣科技大學 電機工程系
一、中文摘要
我們的研究目的在利用全新的投影式編碼法以及螺旋槳式編碼法,應用在運動的追蹤上。
利用磁振造影術所收取到的 k 空間資料,運算得知因心跳所造成的血流速波動或是因呼吸 所引起的器官位移。使用這項資訊,將相同運動狀況的資料重組成一張影像,便有機會得 到一張無運動假影的高解析度影像。運用這項技術,將可省去臨床上準備心電圖或呼吸帶 的麻煩,更可利用自由呼吸的造影術,使用更多的取像時間來獲取高解析度高信雜比的影 像。應用在動物模型的磁振影像相關研究也能夠降低假影,提高實驗的可靠度。相關研究 已在一年半的進行中,有了顯著的成果,包含投影式編碼法的完成以及螺旋槳式編碼法初 步結果。相關研究已刊登在國際磁振造影學會年會,也正撰寫投稿至國際期刊。另外,計 畫中原定利用本人暑假期間,前往美國波士頓進行國際合作,也獲得貴會補助,然而美國 合作研究者 Dr. Brigitte Poncelet,喜獲新生兒,於短期間需在家育兒,於是本人的旅行計畫 並沒有進行。並將該補助款項繳回貴會。但是這並沒有影響本人於哈佛醫學院之間的合作 關係,我們依然透過電子郵件的方式,進行脈衝序列程式的交換以及測試。並委請該合作 者之同事進行相關資料收集。
關鍵詞:運動追蹤,心肌 Introduction
For clinical cardiac MR imaging, patients are generally required to hold their breath during the scan to minimize respiratory motion-related artifacts. However, some patients cannot hold their breath due to illness or limited breath capacity. To solve this problem, several methods have been developed including gating from the signal of respiratory belt or navigator echoes. Recently, Larson et al. reported a novel self-gating technique that continuously extracts the respiratory trace from low-resolution images acquired by radial scanning with each heart beat [1]. Similarly to radial scanning, the PROPELLER encoding method [2] can reconstruct a low-resolution image from every blade due to k-space center oversampling. In this study, we investigated the feasibility
of extracting respiratory-trace from the blades acquired by PROPELLER encoding for the application of free-breathing high resolution cardiac imaging.
Material and Methods
To achieve self-gating cardiac imaging, we modified the k-space trajectory of the Turbo-Field-Echo sequence to PROEPLLER trajectory. The sequence code was modified under the Philips Pulse Programming Enviroment(PPE) with Visual C++ and Acqsim simulator. Fig.
3-1a shows the simulation of the user interface for PROPELLER encoding. While the
“PROPELLER_enable” changes to “yes”, the option “PROPELLER_angle” appears. The users can then determine the rotation angle of the adjacent blades. Fig. 3-1b shows the simulation of PROPELLER TFE sequence. As we can see, the gradient waveform (X-axis and Z-axis) changes according to dynamic scans due to the in-plane rotation along the Y-axis.
(a)
(b)
(a)user interface of the PROPELLER sequence (b)The simulation of Turbo Field Echo (TFE) pulse sequence with PROPELLER encoding. This simulation uses the simulator (ACQSIM) of
A PROPELLER-encoded ECG-triggered Turbo-Field Echo (TFE) sequence with T2 magnetization preparation (T2-prep) [3] was implemented on a 3T whole-body MR system (Achieva 3T, Philips) for T2-weighted myocardial imaging. Three subjects participated in this study. For each subject, a set of one hundred PROPELLER blades were collected using the following parameters: FOV: 340mm, TR/TE:4ms/2.3ms, flip angle: 10 degrees, TET2-prep:50ms, end-systolic ECG gating, PROPELLER blade size: 30x256, PROPELLER rotation step: 7 degrees. The phase-encoding order for each blade was set to centric-reordering to maximize T2 contrast from the magnetization preparation.
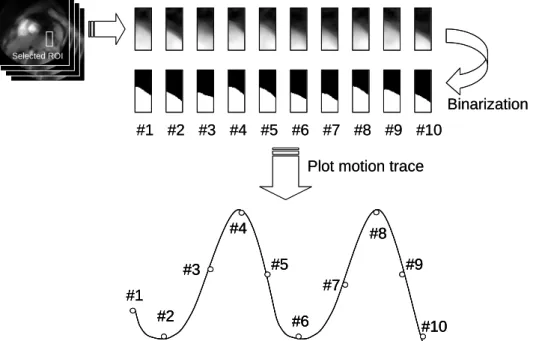
The collected blades were processed with Matlab® (Mathworks, Natick, MA, USA) using a self-gating PROPELLER reconstruction algorithm. In order to extract the respiratory trace, the low resolution blades were first transformed to image domain and then smoothed using a median filter. A ROI was selected over the myocardium and all blade images were cropped using the same ROI (see Figure 1). The correlation analysis was applied between the cropped blades and one selected blade. The series of correlation coefficients (CC) for the full set of 100 blades was used to identify the respiratory phases. Finally, the low resolution blade images with CC values higher than a preset threshold were combined and the PROPELLER reconstruction algorithm was applied to reconstruct a high resolution image.
Results
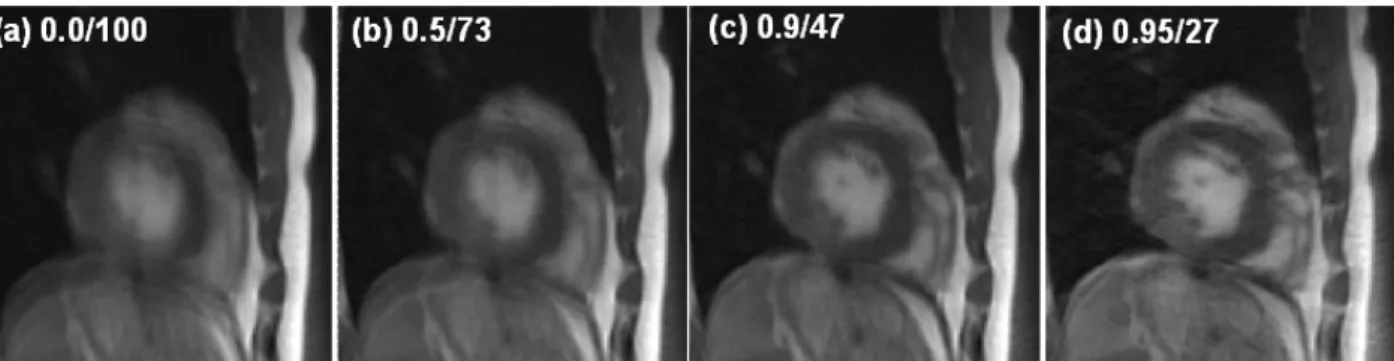
Fig.2 shows the respiratory trace obtained from cross correlation of the PROPELLER blades (see Fig.3) collected in one of the subjects. Notice that the respiratory duration detected from this trace was approximately 5 to 7 heart beats, which roughly matched the respiratory period observed on the subject outside the scanner. Fig.4 shows the reconstructed T2-weighted myocardial images with four different CC thresholds (a:0.0 , b:0.5, c:0.9, d:0.95) and the number of blades with CC values larger than each of the four threshold values (a:100, b:73, c:47,d:27).
The images show blurring instead of ghosting due to the PROPELLER k-space trajectory. Fig.4.a, corresponding to a non respiratory-gated image, shows most blurring. The other images (Fig.4.b-d) appear progressively sharper with increasing CC threshold values. Figure 5 shows selected cardiac images at different phase.
Discussion and Conclusions
In this study, PROPELLER encoding was implemented with a T2-prep TFE sequence to acquire high resolution cardiac images without breath-holding. Using the k-space center over-sampling property of PROPELLER encoding, the heart position can be identified in each low-resolution blade acquired in a heart beat. Thus, a high resolution image can be reconstructed from the blades
selected with almost the same heart position. The scan efficiency depends on the CC threshold.
From our results, the reconstructed image showed less blurring with half of the blades selected for PROPELLER reconstruction. An even sharper reconstructed image can be obtained with less scan efficiency (ex. Fig.3(d) :27%). Further enhancement of the scan efficiency may be achieved by image domain registration if the myocardium movement can be assumed “in-plane” [2]. In our study, free-breathing high resolution T2-weighted myocardium imaging was achieved with the proposed self-gating method. The method can be applied to myocardial BOLD investigations for which signal averaging is desired to enhance detection of small T2-related signal changes during vasodilatory stimulation. Using our method, the myocardial blades collected at rest and during vasodilatory challenge can be retrospectively selected, yielding registered myocardial images for BOLD signal analysis. In clinical application of myocardial viability imaging with delayed enhancement, patients have to hold their breath repeatedly with each high resolution slice acquisition. The respiratory self-gating method could greatly facilitate such routine exam for the patient. By comparison to the streak artifacts characteristic of radial trajectories, the phase-encoding of each PROPELLER blade is essentially a Cartesian trajectory, yielding low resolution blade images without aliasing artifacts. Furthermore, most imaging method applicable to Cartesian encoding can be applied to each blade (e.g. partial Fourier and SENSE). However, contrary to the directionally uniform sampling of radial scans, the PROPELLER blades are prone to achievable precision from the low spatial resolution in the phase-encoding direction, thus limiting the precision of the detected respiratory trace. Nonetheless, our study demonstrated that the respiratory phases could be clearly identified from the estimated traces and the reconstructed images did not show prominent blurring. The PROPELLER encoding has thus the potential to offer a robust method for free-breathing cardiac imaging.
Reference
[1] Larson AC et al, MRM (2005) 53(1):159. [2] Pipe JG ,MRM(1999) 42(5):963. [3] Huang TY et al., 13th ISMRM (2005), p.521.
Binarization
#3 #4 #5 #6 #7 #8 #9 #10
#1 #2
#3
#4
#9
#5
#6
#7
#8
#10
#1
#2
Plot motion trace
Selected ROI
Binarization
#3 #4 #5 #6 #7 #8 #9 #10
#1 #2
#3
#4
#9
#5
#6
#7
#8
#10
#1
#2
#3
#4
#9
#5
#6
#7
#8
#10
#1
#2
Plot motion trace
Selected ROI Selected ROI
Fig. 1 The respiratory self-gating method and the rearranging of the acquired k-space data.
Fig.2 Respiratory trace extracted from cross- correlation of blade images cropped over the heart.
Fig.3. Series of low resolution blade images acquired during successive heart beats. Notice that the heart movement can be clearly identified and the respiratory trace can be extracted.
0 10 20 30 40 50 60 70 80 90 100
0.1 0.2 0.3 0.4 0.5 0.6 0.7 0.8 0.9 1
Blade number
Correlation coeficient
Fig.4. Series of propeller images reconstructed with different CC thresholds (a:0.0 , b:0.5, c:0.9, d:0.95) and corresponding number of blades with cc values higher than the specific threshold (a:100, b:73, c:47,d:27).
(b)
(a) (b)(b) (c) (d)
(a)
(a) (c)(c) (d)(d)
Fig. 5 The selected images using PROPELLER encoding and the self-gating methods raised in this study. Image (a) and (b) are the end-diastole images. Image (c) and (d) are the end-diastole images.
國科會
補助出席國際會議報告
Annual Meeting of ISMRM 2008
“國際醫用磁共振學會第十六屆年會”
會議報告
黃騰毅副教授 台科大電機系 九十七年六月十二日
行政院國家科學委員會出席國際會議補助報告
國際醫用磁共振學會第十六屆年會
2008/5/3~2008/5/9, Toronto, Canada 黃騰毅副教授 台科大電機系
一、參加會議經過
本人於 5 月 2 日從桃園中正機場出發,搭乘國泰航空公司前往香港再轉機至 德國柏林。本人與相關研究伙伴(包括台大、清華、中山、逢甲等大學伙伴)一同 租用在會場附近的公寓大樓,該大樓生活設施包含廚房客廳等,讓本人得以自行 開伙準備餐點,以節省生活開銷。本次與會人士,台灣方面有超過五十名教授、
醫師、研究員、學生等參與。本人在此次會議與研究伙伴們共發表十一篇論文。
二、與會心得
會議於多倫多之 Convention Center 舉行, Scientific Meetings 總共約有一千 場之 oral presentations 。在大堂課中,這次特地邀請了 CP echo 中的 Carr 來發 表演講。然而,不幸的是 Carr 本人在會議之前數月因故過世,而因此由其女兒 代表介紹他的生平。Carr 是 MRI 發展的先驅,他建立了 MR 許多早期的理論 Carr echo 更是 MRI 學者必定要了解的事情。未能目睹大師風采實在遺憾。但大會準 備了許多回顧資料,讓我們了解在過去那個電腦不發達的年代,MRI 的學者是 如何進行他的研究,而發展出的理論竟爾如此地影響後人的研究。
另外,在大堂課中,MR elastography 技術的進展,無疑是眾人的焦點。MR elastography 利用外加的機械波打入人體中,再利用 MRI 對於物體位移十分敏感
的原理,進而推算出人體器官組織彈性係數。這無疑是 MR 診斷技術的一大突 破。因為人們對腫瘤的描述—“硬塊” ,明確地告訴我們腫瘤的彈性跟正常組織 有所不同。而肝 “硬化”的具體表現也是肝藏的彈性改變。MRE 無疑在這個應用 上開了一扇窗。在過去,MRE 技術僅出現在實驗室的研究,但是根據 Dr. Ehman 的演說,目前用在肝腫瘤以及肝硬化的診斷已經被證明有極高的可行性。肝病號 稱是台灣的國病,也因此與會同仁都對這項技術躍躍欲試,也希望能夠將這項技 術帶回台灣。
本人的研究專長在於穩定態磁振造影、PROPELLER 編碼技術、EPI 的影像 修正以及介入性 MRI 的相關脈衝序列。而在穩定態磁振造影術方面,這次會議 有一個重點在於 multiple acquisition SSFP 的影像,如何進行有效的重建。而另外 一有趣的應用則在於利用 SSFP 建立磁轉移對比影像,然而由於計算過程太過繁 複且假設過多,本人並不看好這項技術。在 PROPELLER 編碼技術上,則呈現本 人團隊所發展的 long axis PROPELLER 以及 short axis PROPELLER 互相競爭的 局面。對手陣營(Stanford 大學)重覆了不少本人在過去所發展的相關技術,並應 用在 short-axis PROPELLER 上,而本人所屬團隊也提出新的方法,能夠讓 PROPELLER EPI 提供更好的影像品質。而在 EPI 影像品質修正上,一如過去有 許多論文在探討,較引起本人注意的是利用 optimization 的方式,使用 reverse gradient 影像的差異做為 cost function 來做最小化的動作,以降低影像失真。而 在介入性 MRI 中,感覺高能聚焦超音波的功能日漸成熟,與 MRI 的搭配更顯得 有未來性,本人將持續在這個領域研究。
三、考察參觀活動
由於之前已經在多倫多開過會議,所以這次並沒有進行參觀考察活動。
四、建議
這次本人連同台科大電子林益如教授、中山資工柯正雯教授、逢甲自控劉益瑞教 授、台大電機鍾孝文教授、清華大學王福年教授、台大醫學院吳文超教授所組成 超過 30 人的團隊,發表了超過 20 篇論文,內容包含各個領域,也因此大大提高 本團隊的研究能見度。也因此,在國際間已引起注意。建議國科會能就跨校大型 研究群參與國際會議給予積極的補助。
五、攜回資料名稱及內容
ISMRM 2008 Proceeding CD-ROM 一片、ISMRM 2008 Course Syllabus CD-ROM 一片、以及廠商提供產品訊息等等。
六、附錄
本人此次發表的論文條列如下:
1. T-C. Chao, Y-J. Liu, T-Y. Huang, H-W. Chung, and C-Y. S. Chen
“Multi-Slice High Resolution Cerebellum Diffusion Tensor Imaging Using Pre-IR Inner Volume Excitation” , International Society for Magnetic Resonance in Medicine, Toronto, Canada, 2008
2. P-H. Wu, T-Y. Huang, M-L. Wu, H-S. Liu, H-W. Chung, and C-Y. Chen
"Improvements in sweep scans for frequency adjustments in SSFP fMRI using coarse sampling with cubic spline interpolation" , International Society for Magnetic Resonance in Medicine, Toronto, Canada, 2008
3. P-H. Wu, T-Y. Huang, M-L. Wu, H-S. Liu, H-W. Chung, and C-Y. Chen
“Transition-band SSFP fMRI with Increased Spatial Coverage:
Slice-dependent Frequency Adjustments in a Bilateral Motor
Activation Experiment” , International Society for Magnetic Resonance in Medicine, Toronto, Canada, 2008
4. Yin-Cheng Huang, Hsiao-Wen Chung, Teng-Yi Huang “TIDE bSSFP As A Fat-suppression Preparation” , International Society for Magnetic Resonance in Medicine, Toronto, Canada, 2008
5. P-H. Tsai, T-Y. Huang, H-W. Chung, and G-S. Huang “Regional difference of diverse zones in human menisci investigated by quantitative T2 measurements” , International Society for Magnetic Resonance in Medicine, Toronto, Canada, 2008
6. Shang-Yueh Tsai, Yi-Ru Lin, Teng-Yi Huang, Stefan Posse, and Fa-Hsuan Lin
“Proton-Echo-Planar-Spectroscopic-Imaging (PEPSI) acquired using radial trajectory (rPEPSI)” , International Society for Magnetic Resonance in Medicine, Toronto, Canada, 2008
7. Hsu-Hsia Peng , Teng-Yi Huang , Hsiao-Wen Chung , Chih-Ching Wu ,Wen-Shiang Chen, Wen-Yih Isaac Tseng “Monitoring of HIFU Treatment Effectiveness by MR Imaging: Advantage of the Magnetization Transfer Ratio over the Thermal Dose as Evidenced by Overheating Experiments” , International Society for Magnetic Resonance in Medicine, Toronto, Canada, 2008
8. Tzu-Chao Chuang, Teng-Yi Huang, Fu-Nien Wang, Hsiao-Wen Chung
“Advantages of long-axis PROPELLER EPI via k-space weighting:
comparison of point spread function with short-axis PROPELLER EPI” , International Society for Magnetic Resonance in Medicine, Toronto, Canada, 2008
9. Tzu-Chao Chuang, Fu-Nien Wang, Teng-Yi Huang, C-C. Wu, and Hsiao-Wen
Chung “View-sharing PROPELLER with pixel-based optimal blade selection (POBS) for dynamic contrast-enhanced MRI” , International Society for Magnetic Resonance in Medicine, Toronto, Canada, 2008
10. Fu-Nien Wang, Tzu-Chao Chuang, Teng-Yi Huang “PROPELLER EPI Using Asymmetric Blades: A Preliminary Study on Point Spread Function” , International Society for Magnetic Resonance in Medicine, Toronto, Canada, 2008
11. Yu-Shun Wang, Teng-Yi Huang, Chih-Ching Wu, Hsu-Hsia Peng, Wen-Shiang Chen, Wen-Yih Isaac Tseng "Auto-Tracking Self-Reference Temperature Mapping during HIFU Transmission: ex-vivo experiments and motion simulations" 16th meeting of International Society for Magnetic Resonance in Medicine, Toronto, Canada, 2008.
七、論文本文:
礙於篇輻,本人僅附上數篇做為代表。
Auto-Tracking Self-Reference Temperature Mapping during HIFU Transmission: ex-vivo experiments and motion simulations
Y-S. Wang1, T-Y. Huang1, C-C. Wu2,3, H-H. Peng4, W-S. Chen3,5, and W-Y. I. Tseng6
1Department of Electrical Engineering, National Taiwan University of Science and Technology, Taipei, Taiwan, 2Department of Mechanical Engineering, National Taiwan University, Taipei, Taiwan, 3Division of Medical Engineering Research, National Health Research Institutes, Taipei, Taiwan, 4Department of Electrical Engineering, National Taiwan University, Taipei, Taiwan, 5Department of Physical Medicine and Rehabilitation, National Taiwan University Hospital, Taipei,
Taiwan, 6Center for Optoelectronic Biomedicine, Medical College of National Taiwan University, Taipei, Taiwan
Introduction
MR temperature mapping by the proton resonance frequency shift (PRF shift) [1] is a real-time monitoring tool for thermotherapy techniques, such as high intensity focused ultrasound (HIFU) [2]. For the conventional PRF-shift MR thermometry, the temperature change is obtained by subtracting the phase of the pre-heating stage (i.e. reference phase image) from the phase obtained in real-time. However, this method may fail to calculate the correct temperature change if patient moves (e.g. respiratory motion) or the system frequency drifts [3]. An alternative way, referenceless temperature mapping [3], is to estimate the background phase by 2D polynomial fitting instead of referencing to the initial phase. However, this method requires pre-definition of ROI for fitting algorithm and may fail when the patient move too much. In order to solve this problem, an auto-tracking self-reference (ATSR) mapping method was proposed to detect the heated region and define the fitting region automatically. And it was applied on a porcine liver experiment to demonstrate its feasibility.
Material and Methods
The experiment was performed on a 3T MR system (Trio 3T, Siemens). Pulsed-wave HIFU pulses with 83 Watt power were performed on porcine liver tissue, immersed in 25°C degassed water. Magnitude and phase images were acquired by the gradient-echo sequence (TR/TE:29/7.53 ms, flip angle:20°, FOV:160x120 mm2, matrix size:128x96, slice thickness:3 mm, transmitter coil: body coil, receiver coil: abdominal coil, measurements:120, and the temporal resolution ~1.85 sec). The acquired images were transferred to a personal computer for data processing with Matlab® system (Mathworks, Natick, MA, USA) for auto-tracking self-reference mapping algorithm. To simulate the motion-induced artifact, the image series were randomly shifted -10~+10 pixels (random number: normal distribution with mean of 0 pixels and standard deviation of 5 pixels, i.e. 12.5 mm).
The auto-tracking self-reference (ATSR) mapping method included three steps: 1) high-pass filtering the unwrapped phase image [4] to reveal phase-changed region, 2) eliminating noise and redundant areas, 3) estimating the initial background phase and then calculating relative temperature change. To apply high pass filter, the phase image smoothed by 2D median filter was subtracted from the original phase image. Using high-pass filtered phase as a reference, pixels with spatially rapid phase change can be identified. The detected pixels can be around either noisy region, or heated region. By evaluating the local 2D standard deviation, the noisy regions can be removed. After revealing the heated region, the initial background phase was estimated by 2D polynomial fitting and thus the self-reference temperature map was obtained. The whole process was fully automatic. Neither ROI selection nor user interactions with the algorithm were needed.
Results
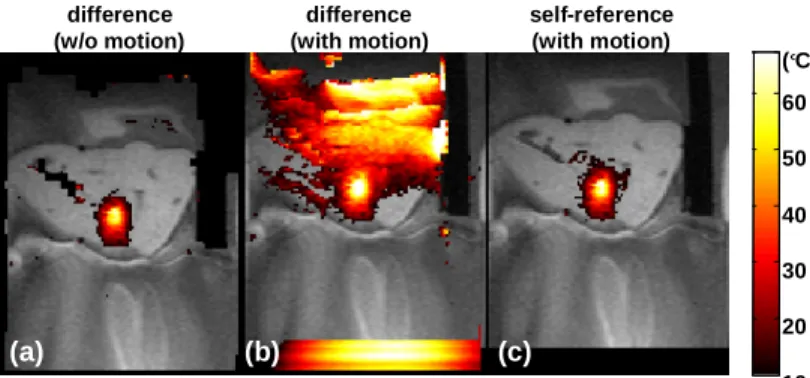
Figure 1 shows the temperature map obtained by difference method and ATSR method. Referencing to the map without simulated motion (see fig. 1a), we can notice that the temperature mapping processed by ATSR method (see fig. 1c) looks fairly similar. And simulated motion resulted incorrect temperature mapping by the original difference method (see fig. 1b). More quantitatively, the relative temperature curves of heated-spot estimated by three different processing methods, phase difference without simulated motion (blue line, curve #1), phase difference with simulated motion (green dash line, curve #2), and the ATSR method (red line, curve #3) are shown in Figure 2. Notice that with temperature curve estimated by ATSR is close to the curve estimated by the original phase difference without simulated motion.
Discussion and Conclusions
In this study, 2D polynomial fitting was based on higher order polynomial on the smooth phase-changed and noise-reduced background, whereas higher order polynomial often induced more frequent oscillation. To get better fitting result, the polynomial fitting region should contain area without temperature change to avoid discontinuity of the background phase. Curve #3 obtained by ATSR method shows quantitatively close to curve #1. However, relative temperature less than 10°C was not able to be tracked by our method due to the tiny phase change induced by PRF-shift. Further investigation has to be done to solve this problem. By the motion simulation, the benefit of using ATSR method was shown. The original phase difference method requires referencing to the initial phase image and the movement of the pixels results incorrect subtraction and hence inaccurate temperature estimation. The ATSR method estimates the background phase with self-reference and thus can overcome the motion problem. In conclusion, auto-tracking self-reference temperature mapping method, which can reduce error caused by tissue motion, can be a more reliable and robust tool to real-time monitoring the thermotherapy.
References
[1] Bruno Quesson et al, JMRI (2000) 12:525-533. [2] G.T. Clement, Ultrasonics (2004) 42:1087-1093. [3] Viola Rieke et al, MRM (2004) 51:1223-1231. [4] Wei Xu et al, IEEE Trans. on Geoscience and Remote Sensing (1999) 37:124-134.
Figure 1 Relative temperature maps. (a): difference method without simulated motion. (b): difference method with simulated motion. (c): ATSR method with simulated motion. Note that the ATSR method produced better temperature map while the tissue moved.
Figure 2 Relative temperature curves obtained with different methods (blue: phase difference without simulated motion, green:
phase difference with simulated motion, red: the ATSR method).
With simulated motion, ATSR performed much better than the phase difference method.
10 20 30 40 50 60 70 80 90 100 110 120
-30 -20 -10 0 10 20 30 40 50 60
measurements
relative temperature(
C) °
difference (w/o motion) difference (with motion) self-reference (with motion)
10 20 30 40 50 60 (° C) difference
(w/o motion)
difference (with motion)
self-reference (with motion)
(a) (b) (c)
Advantages of long-axis PROPELLER EPI via k-space weighting: comparison of point spread function with short-axis PROPELLER EPI
T-C. Chuang1, T-Y. Huang2, F-N. Wang3, and H-W. Chung1
1Electrical Engineering, National Taiwan University, Taipei, Taiwan, Taiwan, 2Electrical Engineering, National Taiwan University of Science and Technology, Taipei, Taiwan, 3Biomedical Engineering and Environmental Sciences, National Tsing Hua University, Hsinchu, Taiwan
Introduction
PROPELLER EPI has been introduced [1] to substantially decrease the susceptibility-related geometric distortion along phase-encoding direction in single-shot EPI, which is severer at high fields. However, artifacts due to strong field inhomogeneities may still appear in the form of image blurring. Recently, another type of PROPELLER EPI technique [2] using the short side, rather than the traditionally long side, of blades as EPI readout direction was proposed to show that the blurring effect can be dramatically reduced due to largely shortened echo spacing.
Nevertheless, the results shown in [2] did not consider the k-space weighting scheme which has been used for de-blurring [1, 3] by emphasizing the contribution of data near the spin-echo where less off-resonance phase error was accumulated. In this simulation study, we demonstrated that long-axis PROPELLER (LAP) EPI and short-axis PROPELLER (SAP) EPI can benefit differently from the weighting window due to distinct sampling trajectories.
Materials and Methods
The k-space weighting scheme was performed only for data points acquired by multiple blades in the process of PROPELLER reconstruction after phase correction, spatial registration, and regridding were done. Here a windowing function exponentially decaying from the center [3] was applied along the phase-encoding direction as w( )n =exp(−λ⋅n), where n indicates the number of k-lines away from the center line in each blade. A larger λ tends to rely much more on the data at fewer phase-encoding steps, which were less prone to the off-resonance errors. Note that constant weighting was applied along readout direction due to rapid sampling. Examples of the k-space weighting schemes (λ = 0.1) were demonstrated in Fig.1a (LAP-EPI) and Fig.1b (SAP-EPI).
To investigate the reduction of blurring that can be brought by the k-space weighting scheme, point spread functions (PSF) of LAP-EPI and SAP-EPI were simulated under constant off-resonance frequency (γΔB0) of 10~40 Hz over the entire field of view (FOV). Twenty-six blades in size of 256(readout)×32(phase) and 32×256 were generated respectively to mimic raw data of LAP-EPI and SAP-EPI. A T2* of 40 ms was considered while T2 relaxation was neglected. The echo spacing of 1 ms and 0.25 ms (i.e. constant readout bandwidth), resulting in a spatial displacement of 3% and 0.75% FOV along phase-encoding in single-shot EPI, were set for 256 and 32 readout lengths according to routine parameters on clinical scanners. Zero-padding was performed on the k-space to achieve 10 times resolution in image domain. In addition to PSF, Shepp-Logan phantom was also sampled in the same way and reconstructed by different weighting schemes (λ = 0 and 0.5) to demonstrate the reduction of image blurring.
Results
Figure 2a compared the enlarged cross-sectional views of normalized PSF of LAP-EPI using four k-space weighting schemes (λ = 0, 0.1, 0.2, and 0.5) at 30 Hz off-resonance. It can be easily observed that a larger λ, which places less weighting on the k-lines far away from center, significantly lowers the magnitude of side lobes. Therefore, the strong image blurring in the Shepp-Logan phantom reconstructed with the uniform weighting (Fig.2b), i.e., λ = 0, was largely eliminated in Fig.2c when λ = 0.5. However, little difference was found between PSFs of SAP-EPI with different weighting functions (Fig.3a) at 30 Hz off-resonance. The image quality of SAP-EPI in Figs.3b (λ = 0) and 3c (λ = 0.5) was visually similar and both had less blurring than Fig.2a. However, Fig.2c, the LAP-EPI image reconstructed with a sharper weighting function, exhibits even better sharpness in close similarity to the original Shepp-Logan phantom than the SAP-EPIs shown in Figs.3b and 3c. Similar phenomena were found in PSF at different off-resonance fields (not shown).
Discussion
Results in this study revealed that the k-space weighting scheme dramatically improved sharpness on LAP-EPI. Little influence was found for SAP-EPI, where data suffering less from off- resonance distribute densely in the central k-space with its sampling trajectory [2]. For any grid point covered by multiple blades, SAP-EPI combines data contributed by different shots carrying comparable off-resonance errors, making the k-space weighting always close to a simple arithmetic averaging. In LAP-EPI, data of good quality spread over entire the k-space and become dominant during the combination of blades through the use of the k-space weighting scheme. As a result, LAP-EPI using a proper weighting function has potentials to obtain images without blurring (Fig.2c) at the cost of SNR [3]. These important properties can be utilized for further optimization of image quality in PROPELLER-EPI.
References: 1. Wang FN et al., MRM 2005;54:1232-1240. 2. Skare S, et al. MRM 2006;55:1298-1307. 3. Chuang TC et al., ISMRM 2006; abst no. 2955.
Fig.2a PSF profiles of LAP-EPI with different k-space weighting schemes (λ = 0, 0.1, 0.2, and 0.5). b and c were Shepp-Logan phantom images reconstructed by the same set of data at λ of 0 and 0.5 respectively.
Fig.1 k-space weighting schemes for single blade of LAP-EPI (a) and SAP-EPI (b) at a λ of 0.1. Note that the phase encoding direction is vertical in a and horizontal in b.
Fig.3a Simulation results of SAP-EPI in the same way as in Fig.2. Shepp-Logan phantom images reconstructed with different functions were shown in b (λ=0) and c (λ=0.5).
PROPELLER EPI Using Asymmetric Blades: A Preliminary Study on Point Spread Function
F-N. Wang1, T-C. Chuang2, and T-Y. Huang3
1Biomedical Engineering and Environmental Sciences, National Tsing Hua University, Hsinchu, Taiwan, Taiwan, 2Electrical Engineering, National Taiwan University, Taipei, Taiwan, Taiwan, 3Electrical Engineering, National Taiwan University of Science and Technology, Taipei, Taiwan, Taiwan
Purpose
Several methods were proposed to reduce the susceptibility-induced blurring effect of long-axis PROPELLER (LAP) EPI. [1,2] Skare et al.
suggested using an alternative short-axis PROPELLER (SAP) EPI to reduce the geometric distortion by shortening the echo spacing. In order to achieve comparable SNR, which is an advantage of LAP by reducing TE, half Fourier blades was implemented in SAP method. In this study, we applied analogous concept to LAP by using asymmetric numbers of phase encoding (PE) lines between two sides of k space center. Point spread functions (PSF) of LAP EPI with symmetric and asymmetric blades are investigated to characterize their blurring effect.
Materials and Methods
PSF of symmetric and asymmetric blades are simulated first. Full 128x128 k space points are combined by blades with 32 PE lines using either original symmetric layout (Fig.1a) or an asymmetric design with 12 PE lines shifted to another side (Fig.1b). 14 blades are simulated with inter-blade rotational angle as 26 degree. The echo spacing of the EPI readout is set as 1ms, and T2* is assumed to 40ms. A substantial off-resonance frequency presumed to 35 Hz to generate a 4.5 pixel displacement along PE direction of each blade. In the following in vivo experiment on a 3T MRI scanner (Siemens Allegra), blades of full k space (i.e. a 128x128 matrix) are acquired on a volunteer using Spin Echo EPI with the same rotation angle as previous simulation, and TE/TR are set to 65/1500ms. Both symmetric and asymmetric 128x32 blades are extracted from identical full k space blades. LAP EPI images are then combined with an exponential weighting constant of 0.1. [2] The differences of two schemes are illustrated by subtracting the combined images.
Results
In Fig2, PSFs are showed, where the PSF of asymmetric blade is noted with lower side peaks than original symmetric blade method under the simulated off resonance. A combined LAP EPI image with asymmetric blades is showed in Fig3a. Difference ratio map is also showed in Fig.3b, where the intensity showing how much proportion is reduced in asymmetric blades combined image. Note that the difference proportion at interfaces around tissues with high intensities, such as brain tissues and eyeballs, is negative at high intensity side while positive at low intensity side.
Therefore, sharper step functions on tissue interfaces of asymmetric blades combined image, as a result of more focused PSF, well demonstrate the de-blurring effect.
Discussion and Conclusion
By simulation of PSF and combing in vivo data, we find that asymmetric blades could reduce image blurring considerably in LAP EPI. It is supposed fewer data with off-resonance induced phases are included when combining asymmetric blades in k space. In addition, one may consider the SNR could be downgraded since fewer central k space lines are acquired in each blade. By shifting PE lines to another side, the TE of EPI can be shortened. For example, a shift of 12 lines under the assumptions of our simulations can roughly reduce TE with 24 ms for spin echo EPI or 12 ms for gradient echo EPI. Therefore, SNR could be compensated or optimized with shift PE lines. This technique could possibly be advantageous for implementing LAP on large matrix size or imaging short T2* tissues using gradient echo EPI blades with very short TE.
References
1. Wang FN, et al., MRM ,2005 54:1432-40. 2.Chuang TC, et al. ISMRM, 2006. 3.Skare S et al., MRM 2006 55:1298-207.
Fig.1 Density maps of original PROPELLER with symmetric blades (1a) and asymmetric blades (1b). The intensity denotes the number of overlapped blades on each point of k space.
Fig.2 Point Spread Functions of LAP EPI under off-resonance frequency is showed. Note that the PSF of asymmetric blades combined image has much lower side peaks.
Fig.3 A combined LAP brain image using asymmetric blades is showed in 3a. Image using symmetric blades is subtract by image using asymmetric blade with the same number of PE lines and then divided by original intensity to show the difference ratio in 3b. Note the negative ratios at high intensity side and positive ratios at low intensity side imply a sharper step function when using asymmetric blades.
a b a b
View-sharing PROPELLER with pixel-based optimal blade selection (POBS) for dynamic contrast-enhanced MRI
T-C. Chuang1, F-N. Wang2, T-Y. Huang3, C-C. Wu4, and H-W. Chung1
1Electrical Engineering, National Taiwan University, Taipei, Taiwan, Taiwan, 2Biomedical Engineering and Environmental Sciences, National Tsing Hua University, Hsinchu, Taiwan, 3Electrical Engineering, National Taiwan University of Science and Technology, Taipei, Taiwan, 4Mechanical Engineering, National Taiwan
University, Taipei, Taiwan
Introduction
View-sharing techniques [1] have been proposed to increase the frame rate for dynamic imaging. View-sharing PROPELLER (VS-Prop) [2,3]
updates the central k-space continuously by using rotating blades, whereas the outer k-space data are provided by adjacent blades acquired at lower frame rates to achieve high effective spatial resolution. Image reconstruction of fine structures contributed more from the high-spatial-frequency components is thus sensitive to the priority decision [2] or neighboring assignment [3] of blades. Since the dynamic signal response can be spatially varying, manipulation of the composing blades in VS-Prop does not have to be identical for different regions. In this study, therefore, we propose a novel method termed pixel-based optimal blade selection (POBS) to minimize reconstruction artifacts due to under-sampled outer k-space data.
Materials and Methods
VS-Prop [3] reconstructs each image frame using a minimal number (Nb) of consecutive blades that cover a circular k-space, while the central polygonal region was filled only by one k-th (1≦k≦Nb) target blade. In other words, given the target blade, there are Nb choices to select the composing blades. In the original VS-Prop method, k is around Nb/2. The basic idea of POBS is to search for one (out of Nb) set of neighboring blades exhibiting the closest image contrast with the target blade, on a pixel-by-pixel basis by least square error estimation, to prevent from artifacts caused by inconsistencies of outer k-space data. The VS-Prop image with k = Nb/2 was used as the initial estimates of signal intensity. After the first optimal set of blades was determined, each pixel was refreshed by the new value to yield the second estimates of signal intensity, with which the selection of blades was repeated to find a new optimal set of blade composition for each of the pixels. This process was iterated until convergence.
Computer simulation was performed by generating a series of 24 full-sampled dynamic Shepp-Logan phantom images (one shown in Fig.1).
Two circular regions of interest (ROIs) with diameters of 7.0% and 4.4% FOV (Figs.1 and 2a) were added to simulate signal enhancements (signal increase/decrease as a step function). Rotating blades in size of 256*52 (Nb=8) were then obtained to generate VS-Prop images using the original method (k=5 for all pixels) and POBS. Dynamic contrast-enhanced MRI (DCE-MRI) on rabbits was also performed on a 3T scanner (Siemens Trio, Erlangen, Germany) using the turbo-FLASH sequence (TI/TE=74/1.5ms, FOV 140 mm, matrix 128*26, 100 frames with ECG gating, 112 ms per slice, 3 slices) to image the pre- and post-contrast dynamics with bolus injection of 2ml Gd-DTPA (0.1 mmol/kg).
Results
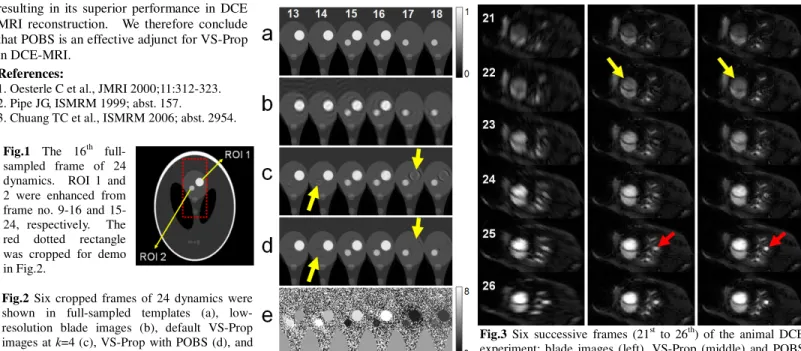
Figure 2 demonstrated six consecutive frames (13th to 18th) in cropped views from the 24 dynamics for the original full-sampled images (Fig.2a), low-resolution blade images (Fig.2b), VS-Prop images at k=5 (Fig.2c), VS-Prop with POBS after three iterations (Fig.2d), and maps of POBS target index (k, Fig.2e), respectively. Errors in POBS VS-Prop were less than 15%, with reduction of artifacts visually perceivable (yellow arrows in Fig.2d vs. Fig.2c). Figure 3 showed results of animal experiments in six dynamic frames (21-26 of 100) for the low-resolution blade images (left), VS-Prop images (middle), and VS-Prop images with POBS (right). With POBS, not only the dark band artifact in the left ventricle disappeared (yellow arrows), but the blood vessels also showed improved conspicuity (red arrows).
Discussion
VS-Prop exhibits strong potential in DCE-MRI with increased temporal resolution (by a factor of 5 in this study). In the example of rabbits, the acquisition time of 112ms for 128*26 allows 3~4 slices to cover the heart within a <500ms cardiac cycle, hence also provides advantages in spatial coverage. With POBS, reconstruction artifacts are minimized. In Fig.2e, it can be found that the k-values at or near ROI1 in the 17th frame are mostly one, which means that the data points were provided by VS-Prop reconstruction using the 17th blade (target) and the 18th-24th blades (neighboring). Consequently, artifacts were largely suppressed since the template for all composing blades is the same (i.e., no enhancement in ROI1). Similarly, k-values for ROI1 in the 16th frame are mostly 8 (16th blade as target and 9th-15th blades as neighboring, all enhanced in ROI1), resulting in its superior performance in DCE
MRI reconstruction. We therefore conclude that POBS is an effective adjunct for VS-Prop in DCE-MRI.
References:
1. Oesterle C et al., JMRI 2000;11:312-323.
2. Pipe JG, ISMRM 1999; abst. 157.
3. Chuang TC et al., ISMRM 2006; abst. 2954.
Fig.1 The 16th full- sampled frame of 24 dynamics. ROI 1 and 2 were enhanced from frame no. 9-16 and 15- 24, respectively. The red dotted rectangle was cropped for demo in Fig.2.
Fig.2 Six cropped frames of 24 dynamics were shown in full-sampled templates (a), low- resolution blade images (b), default VS-Prop images at k=4 (c), VS-Prop with POBS (d), and the map of target index k (e).
Fig.3 Six successive frames (21st to 26th) of the animal DCE experiment: blade images (left), VS-Prop (middle) and POBS VS-Prop (right).
Multi-Slice High Resolution Cerebellum Diffusion Tensor Imaging Using Pre-IR Inner Volume Excitation
T-C. Chao1, Y-J. Liu2, T-Y. Huang3, H-W. Chung1, and C-Y. S. Chen4
1Department of Electrical Engineering, National Taiwan University, Taipei, Taiwan, 2Department of Automatic Control Engineering, Feng-Chia University, Taichung, Taiwan, 3Department of Electrical Engineering, National Taiwan University of Science and Technology, Taipei, Taiwan, 4Department of Radiology, Tri-Service General
Hospital, Taipei, Taiwan
Introduction
Diffusion tensor imaging (DTI) is known to exhibit promising potential probing the cerebral white matter integrities [1]. Due to strong sensitivity of DTI to bulk motion, single-shot EPI is commonly used as the readout module for DTI. However, the long echo train in EPI acquisition leads to geometrical distortions in the presence of magnetic susceptibility effects, limiting the achievable spatial resolution.
Reduced field of view (rFOV) imaging accompanied with inner volume excitation or outer volume suppression has been proposed to effectively minimize the geometric distortions in EPI [2-5]. In this work, we propose an alternative inner volume excitation scheme which could achieve multiple slice acquisition with relatively less compromise in SNR loss. High resolution diffusion tensor imaging in the cerebellum was performed to demonstrate the unique advantages of the proposed technique.
Material and Methods
The pulse sequence diagram as shown in Fig.1 was performed for multi-slice rFOV imaging. A non-selective inversion hard pulse was utilized followed by the excitation. A 7-lobe selective refocusing pulse with optimized slice selection profile was applied along the phase encoding direction. EPI acquisition was adopted for sampling the image data. In addition, two crusher gradients clipping the selective refocusing pulse were added to minimize contaminations from imperfect refocusing and from outside of the FOV. Consequently, the contribution to the echo signal would solely come out from the cross section intersected by the excitation and refocusing pulses. For the multiple-slice scheme, each excitation sequence is equally separated in time within one repetition duration (TR).
Volunteer experiments were performed on a 3.0 T Philips Achieva system. A six-direction DTI sequence was adopted with fourteen continuous slices selected along the sagittal orientation covering the cerebellum. The acquisition matrix was 256x84 with slice thickness 3 mm, leading to a resolution of 0.84x0.84x3 mm3. TE was 74 ms with TR set to 7500ms. The b value for DTI was 700 s/mm2. Partial Fourier reconstruction of the factor 0.6 was also applied to shorten the acquisition length. Sixteen averages were acquired to increase SNR.
Since the magnetization inside the volume of interest is irradiated by all the inversion and echo pulses throughout the entire sequence, the effects of all RF pulses on signal evolution have to be evaluated to achieve uniform signal intensity among all slices without prominent signal loss. Assessment of the evolution of magnetization in different slices was investigated using computer simulation with identical parameters as used in the experiment design. The T1 value was set to 1100ms as reported in the literature for white matter.
Results
The longitudinal magnetizations of different slices before being excited, which determines the signal intensity, are plotted in Fig.2(a) versus the number of excitations. Results from Fig.2(a) suggest that SNR becomes similar throughout all slices immediately following the second excitation, suggesting good signal uniformity. Fig.2(b) shows the signal recovery results after experiencing the excitation and refocusing pulses, where is seen that nearly 84% of the magnetization can be restored for TR greater than about 4500ms, thus maintaining sufficiently high SNR even under the effects of the sequential inversion pulses.
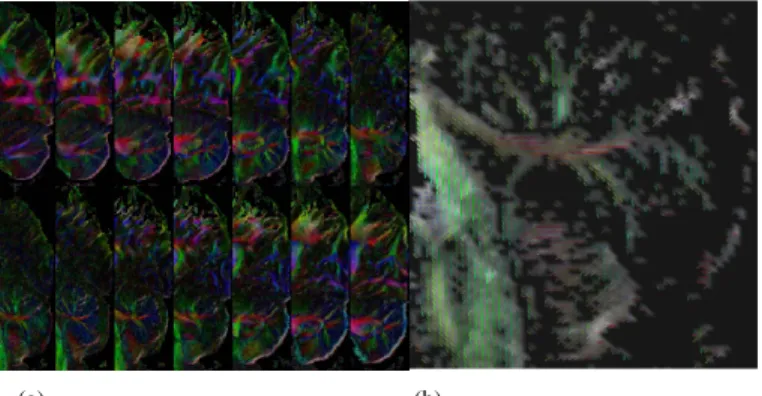
The color FA maps of the sagittal slices of the cerebellum are presented in Fig.3(a). The RGB color scheme indicates the three directions of right-left (anatomical anterior-posterior), top-down (anatomical superior-inferior), and through-plane (anatomical medial-lateral), respectively. The whisker plot (color stick along the principal direction with FA > 0.25) overlaid on the FA map of the cerebellum is also demonstrated in Fig.3(b) for the ninth slice.
Discussion
The sequential inversion pulses accompanied with T1 relaxation affects the signal in the volume of interest as expected. Nevertheless, the simulation results show that the SNR throughout all slices becomes consistent after the second excitation. In addition, the longitudinal magnetization after image data acquisition is shown to recover to 84% of the thermal equilibrium level available for the next excitation.
Therefore, this excitation scheme could achieve rFOV imaging with relative less compromise in SNR loss.
The geometric distortion in EPI sequences is known to be a severe limiting factor in the presence of magnetic field inhomogeneity. Our work suggests that inner volume excitation for DTI could effectively shorten the acquisition duration for regional imaging without using parallel acceleration, thus alleviating possible parallel imaging-related unfolding artifacts [6]. Alternatively, our rFOV scheme is compatible with parallel imaging in nature, hence providing ample room for further reduction in EPI geometric distortions. Compared with full FOV imaging, the rFOV method is advantageous in that the reduced shimming volume for this technique facilitates easier regional shimming for better field homogeneity than its full-FOV counterpart, where whole-brain volume shimming has to be performed.
References
1. Patel, S.A., et al., J Magn Reson Imaging, 2007. 26(3): p. 552-6.
2. Mansfield, P., et al, Journal of Physics E, 1988. 21 p. 275-2.
3. Feinberg, D.A., et al., Radiology, 1985. 156(3): p. 743-7.
4. Jeong, E.K., et al., Magn Reson Med, 2005. 54(6): p. 1575-9.
5. Wang, J.J., et al., Magn Reson Med, 2004. 51(4): p. 853-7.
6. Chou, M.C., et al., AJNR Am J Neuroradiol, 2007. 28(6): p. 1099-101.
(a) (b)
Fig 3. (a) Color-coded FA maps obtained for the cerebellum. (b) The color coded whisker plot magnified to represent the detail orientation of fiber bundles in cerebellum for the ninth slice.
Fig 1. Pulse sequence diagram of pre-IR rFOV excitation scheme. The refocus pulse was slice-selective along the phase encoding direction
Fig 2. (a) The magnetization evolution of each slice at each excitation. (b) The recovery of longitudinal magnetization is plotted versus TR containing 14 sets of excitation/refocusing pulses.
Fig. 1 Sweep scans at 1- (a), 5- (b), and 10- (c) degree increments of the SSFP angle.
Dashed lines stand for the off-resonance frequencies corresponding to the maximum signal intensity.
Improvements in sweep scans for frequency adjustments in SSFP fMRI using coarse sampling with cubic spline interpolation
P-H. Wu1, T-Y. Huang2, M-L. Wu3, H-S. Liu1,4, H-W. Chung1,5, and C-Y. Chen4
1Electrical Engineering, National Taiwan University, Taipei, Taiwan, Taiwan, 2Electrical Engineering, National Taiwan University of Science and Technology, Taipei,
Taiwan, 3Radiology, Brigham and Women's Hospital, Harvard Medical School, Boston, MA, United States, 4Radiology, Tri-Service General Hospital, Taipei, Taiwan, Taiwan, 5Radiology, Tri-Service General Hospital, Taipei, Taiwant, Taiwan
Introduction
Steady-state free-precession (SSFP) method has been shown to exhibit strong potential for distortion-free fMRI at high spatial resolution [1].
One major challenge of transition-band SSFP fMRI is the narrow functional frequency band, leading to native sensitivity to spatial and temporal field instability, even with careful shimming [1, 2]. Previous studies have proposed methods to overcome temporal field instability [3, 4]. Spatial field inhomogeneity, on the other hand, has also been addressed in a regional manner by a slice-dependent frequency adjustment method [5]. However, in the original design of the slice-dependent frequency adjustment method, fine increment in the SSFP angle is needed for the sweep scan, which prolongs the scan time.
In this study, we proposed a modified processing method based on cubic spline fitting to substantially shorten the scan time of the sweep scan
with frequency adjustment values estimated with sufficient accuracy. Transition-band SSFP fMRI experiments were performed to demonstrate its effectiveness.
Methods
The software for processing the sweep scan data was developed using the Matlab software. To verify the effectiveness of this method, the sweep scan was first performed with 1 degree of increment per frame in the SSFP angles from -180 to 180 degrees (total 361 frames, 206 sec per slice). Mean signal intensity for each image frame was then plotted as a function of the SSFP angle. Simulated data for coarser increments (5 degree increments, 73 frames; 10 degree increments, 37 frames) were generated from the same set of data. The three data sets were smoothly interpolated with the use of the cubic spline fitting technique [6]. Regional off-resonances corresponding to the amounts of frequency adjustment were then determined by finding the peaks of the fitted curves, with results compared among different SSFP angular increments. The calculation of signal intensity was done on pre-selected region of interest (i.e., occipital lobe), where shimming was optimized in this study.
Imaging was performed on a 3.0T Philips Achieva system using an 8-channel head coil. Shimming was targeted to the occipital lobe for visual stimulation SSFP fMRI experiments. The image parameters were 220 mm FOV, 64 by 64 matrix size, 4 mm slice thickness, 4° flip angle and TR/TE = 8/4 ms. IIR-filtered frequecy stabilization was applied to compensate for temporal frequency drifts. Two sets of SSFP fMRI images were acquired to compare conditions without and with slice frequency adjustment. The stimulus was a 5 Hz flashing checkerboard visual stimulus in 3-on/4-off blocks. Analysis was performed using SPM5 software. The sweep scans were performed with 10-degree SSFP angle increments from -180 to 180 degrees (total 37 frames, 24 sec per slice, TR/TE/flip angle: 8ms/4ms/4°), inserted before fMRI experiments and positioned exactly the same as in SSFP fMRI, such that frequency adjustments for each slice could be determined after cubic spline interpolation.
Results
Figure 1 shows three sets of the sweep scan. The circles represent the original samples, and the solid lines represent the interpolated result of cubic spine fitting. The dotted lines point out the maxminum value of the fitting curve, corresponding to the off-resonance in unit of degrees of the SSFP angle. Fig.1(a) is the original data, showing sufficiently smooth profile suitable for cubic spline interpolation at coarser samplings. Figs.1(b) and 1(c) are the sweep scans with 5- and 10-degree increments, respectively. The off-resonance in SSFP angles are found to be 21°/21°/20° (7.29/7.29/6.94 Hz) for step1/step5/step10, respectively. The minor difference of 0.35 Hz between the finest step 1 and the coarsest step 10 is around the level of system fluctuations (~0.5 Hz) found in our system, which is hence well acceptable.
Fig.2(a) and 2(b) show the activation maps without and with slice-dependent frequency adjustments at 10-degree SSFP increments, respectively. With slice frequency adjustments following cubic spline interpolation, more activated voxels could be observed in Fig.2(b) compared with the activation maps shown in Fig.2(a), demonstrating effectiveness of slice frequency adjustements by using sweep scan with 10-degree increments per frame.
Discussion and Conclusion
Results from our study show that with cubic spline interpolation for the sweep scans, appropriate frequency adjustment value for each slice can be found with good accuracy with 10-time reduction in the number of samples. The shortening of the sweep scan is advantageous in increasing the reliability of sweep scan in the presence of system instability and physiological fluctuations. The proposed technique thus has potential for efficiently improving transition-band SSFP fMRI experiments.
References
[1] Miller, K.L., et al. MRM. 2003. 50(4): p. 675. [2] Miller, K.L., et al. MRM. 2006. 55: p. 161. [3] Lee, J., et al., MRM. 2006. 55(5): p. 1197.
[4] Wu, M.L., et al., MRM. 2007. 57(2): p. 369. [5] M-L Wu., et.al. in ISMRM. 2007. [6] Paliwal, V., et al., MRM. 2004. 52(4): p. 704.
Fig. 2 SSFP fMRI activation maps without (a) and with (b) frequency adjustment using coarse 10-degree increment in the sweep scans.