Concentration dependence of carrier localization in InN epilayers
G. W. Shu, P. F. Wu, M. H. Lo, and J. L. Shena兲
Physics Department, Chung Yuan Christian University, Chung-Li, Taiwan 32023, Republic of China T. Y. Lin
Institute of Optoelectronic Sciences, National Taiwan Ocean University, Keelung, Taiwan 20224, Republic of China
H. J. Chang and Y. F. Chen
Physics Department, National Taiwan University, Taipei, Taiwan 106, Republic of China C. F. Shih
Electrical Engineering Department, National Cheng Kung University, Tainan, Taiwan 70101, Republic of China
C. A. Chang and N. C. Chen
Optoelectronic Engineering Institute, Chang Gung University, Guei-Shan, Taiwan 33302, Republic of China 共Received 27 April 2006; accepted 8 August 2006; published online 27 September 2006兲
The authors studied the concentration dependence of carrier localization in InN epilayers using time-resolved photoluminescence共PL兲. Based on the emission-energy dependence of the PL decays and the PL quenching in thermalization, the localization energy of carriers in InN is found to increase with carrier concentration. The dependence of carrier concentration on the localization energy of carriers in InN can be explained by a model based on the transition between free electrons in the conduction band and localized holes in the deeper tail states. They suggest that carrier localization originates from the potential fluctuations of randomly located impurities. © 2006 American Institute of Physics. 关DOI:10.1063/1.2357545兴
InN has recently attracted extensive attention due to its potential applications in semiconductor devices such as light-emitting diodes, lasers, and high efficiency solar cells. As of yet, many intrinsic electronic properties of InN, such as the energy band gap, the electron effective mass, and nonpara-bolicity of the conduction band, have not been fully understood.1–6 The photoluminescence 共PL兲 of degenerate InN has recently been studied and the PL structures have been analyzed by recombination processes of the free-to-bound, free-to-tail, and band-to-band transitions.5,6 The PL spectra in InN have been found to exhibit the carrier local-ization because the energy relaxation time of photoexcited carriers is much shorter than the radiative lifetime.5The ori-gin of the localized states has been associated with the spatial fluctuations of random impurity potential5,6 or metallic in-dium inclusions.7The intrinsic material properties of InN are well known to be very sensitive to the presence of impurities, i.e., carrier concentration. Therefore, it is desirable to inves-tigate the concentration-dependent carrier localization in InN, which will not only improve the understanding of the material properties of InN but also provide information on the design of InN-based devices. In this study, we investigate the concentration dependence of carrier localization in InN. We suggest that carrier localization in InN originates from the potential fluctuations of randomly located ionized impurities.
The samples investigated were grown on sapphire sub-strates by metal organic vapor phase epitaxy. A low-temperature 20 nm GaN nucleation layer was firstly depos-ited at 500 ° C, followed by a 2m GaN layer grown at
1000 ° C. The substrate was then cooled to 600 ° C to grow the InN. Trimethyl indium 共TMI兲 and NH3 were used as sources and N2 was used as the carrier gas at flow rates of 400, 18 000, and 18 000 SCCM共SCCM denotes cubic cen-timeter per minute at STP兲 for TMI, NH3, and N2, respec-tively. The pressure during growth was kept constant at 200 mbars. An InN layer with a thickness of 150 nm was grown on the GaN layer. Various electron concentrations were obtained by varying the temperature of rapid thermal annealing共RTA兲 in an O2environment. RTA was performed with an annealing time of 30 s and a ramp rate of 30 ° C / s at temperatures of 200, 300, 400, and 500 ° C for samples D, C, B, and A, respectively 共sample E was untreated兲. The InN samples A, B, C, D, and E with carrier concentrations of 2.4, 3.3, 9.0⫻1018, 1.4, and 1.6⫻1019cm−3, respectively, were obtained from the Hall effect measurements at room tem-perature. The PL measurements were performed using a pulsed laser operating at a wavelength of 635 nm as the ex-citation source. The pulsed laser produces light pulses with 50 ps duration and a repetition rate of 1 MHz. The lumines-cence was detected with an extended InGsAs detector or a high-speed photomultiplier tube. PL decay signals were mea-sured using the technique of time-correlated single-photon counting. The overall temporal response function of the sys-tem is 250 ps.
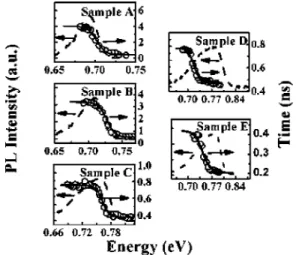
The dashed lines in Fig. 1 display the 10 K PL of five InN samples with different free carrier concentrations. The energy of the PL increases monotonically as the electron concentration increases. The blueshift of the PL peak is caused by the Burstein-Moss effect originating from the shift of the Fermi level above the bottom of the conduction band as the electron concentration increases.8Figure 2 displays the PL decay profiles of InN monitored at the peak position with a兲Author to whom correspondence should be addressed; electronic mail:
APPLIED PHYSICS LETTERS 89, 131913共2006兲
0003-6951/2006/89共13兲/131913/3/$23.00 89, 131913-1 © 2006 American Institute of Physics Downloaded 19 Oct 2008 to 140.116.208.51. Redistribution subject to AIP license or copyright; see http://apl.aip.org/apl/copyright.jsp
different carrier concentrations. Each PL transient profile in Fig. 2 can be fitted by the function I共t兲=I0exp共−t/兲, where
is the decay lifetime. A carrier lifetime as long as 3.7 ns was observed for sample A. This value is the longest lifetime measured to date for InN.9
The open circles in Fig. 1 show the emission-energy de-pendence of lifetime with five different carrier concentra-tions. The decrease of the lifetimes with increasing emission energy is characteristic of a localization effect.10 Localized carriers can transfer from higher energy sites to lower energy sites through a relaxation. The decay rate of localized carri-ers is expressed as the radiative recombination rate plus the transfer rate to lower energy sites. Thus, the observed life-time decreases as the emission energy increases. The combi-nation of recombicombi-nation and transfer has been modeled by assuming that the density of localized tail states is propor-tional to exp共−E/E0兲, where E0 describes the amount of spreading in the density of states.11,12 The relationship be-tween lifetime and PL energy E is described by the function12
= rad
1 + exp关共E − Eme兲/E0兴, 共1兲
whererad is the radiative lifetime, Eme is an energy where the decay time equals the transfer time, and E0is the local-ization energy.given by Eq.共1兲 is plotted as the solid lines in Fig. 1. Good fits to experimental data confirm the exis-tence of carrier localization in InN. The open circles in Fig. 3 plot E0 with five different carrier concentrations. E0 de-creases monotonically with a decrease of carrier concentra-tion; this behavior will be discussed later.
The PL intensity of InN as a function of temperature was measured and the open circles in Fig. 4 show the experimen-tal results for five different carrier concentrations. The PL intensities decrease monotonically with temperature. An at-tempt to fit the Arrhenius plots of the PL emission using the dependence of A共T兲=A0/关1+C exp共−EA/ kT兲兴 was unsuc-cessful 共see the dashed lines in Fig. 4兲. However, the temperature-dependent PL intensities can be well fitted by two nonradiative recombination channels using the function13
FIG. 1. PL spectra of five InN samples with different free carrier concen-trations共dashed lines兲. The open circles display the emission-energy depen-dence of lifetime. The solid lines display the calculatedusing Eq.共1兲.
FIG. 2. PL decay profiles of five InN samples with different free carrier concentrations.
FIG. 3. 共Color online兲 Localization energy E0obtained from Eq.共1兲 共open circles兲 and the activation energy E2obtained from Eq.共2兲 共open triangles兲 as functions of carrier concentration. The solid line plots the calculated localization energy according to a model that considers the potential fluc-tuations of impurities.
FIG. 4. 共Color online兲 Arrhenius plot of the integrated PL intensity of five InN samples with different carrier concentrations共open circles兲. The solid lines are the fitted curves using Eq.共2兲.
131913-2 Shu et al. Appl. Phys. Lett. 89, 131913共2006兲
I共T兲 = I共0兲
1 + A1exp共− E1/kT兲 + A2exp共− E2/kT兲
, 共2兲
where I共0兲 is the PL intensity at low temperature, the coef-ficients A1 and A2 measure the strengths of both quenching mechanisms, and E1and E2 are the thermal activation ener-gies in the high- and low-temperature regions, respectively. The solid lines in Fig. 4 show the fitted results, which agree closely with the experimental data. In the fits, E1 extracted from the high-temperature region共above 100 K兲 has an ac-tivation energy of⬃30 meV, which is almost independent of the carrier concentration. We suggest that E1is caused by the nonradiative channel through defects or dislocations in InN. On the other hand, the open triangles of Fig. 3 plot activation energy E2 that was extracted from the low-temperature re-gion共10–100 K兲, revealing that E2increases with the carrier concentration. The carriers in the thermalization process may become delocalized from the localized states, leading to the decrease of PL intensity accordingly. The concentration-dependent E2, which is close to the value of E0, thus repre-sents the localization energy of the localized carriers.
Two possible mechanisms have been suggested to ex-plain the origin of the carrier localization in InN: the random impurity potential5,6and the metallic indium inclusions.7To determine whether the carrier localization in InN originates from the latter mechanism, the composition of the InN samples was examined by making the energy dispersive x-ray measurements. InN with a lower carrier concentration contains a greater atomic percentage of indium than that with higher carrier concentration. If carrier localization arises from the metallic indium inclusions, then the InN with the lower carrier concentration should exhibit strengthened lo-calization. However, the localization energy in InN decreases as the carrier concentration decreases, as shown in Fig. 3, indicating that the mechanism based on the metallic indium inclusions was not responsible for the carrier localization here. We therefore suggest that the carrier localization in InN is associated with the potential fluctuation of the randomly located impurities. Based on this model, the localization en-ergy can be estimated at different carrier concentrations. In heavily doped semiconductors, the inhomogeneous impurity distribution may produce a density-of-states tail by electron-impurity interactions. The localized states in such a bail tail can be treated as acceptor-type centers, distributed above the top of the valence band. If the randomness of ionic impuri-ties produces potential fluctuations, then the root-mean-square共rms兲 potential energy fluctuation is given by14
Vrms=共e2/兲关2共N+D+ NA−兲Rs兴1/2, 共3兲 where is the dielectric constant, ND+ and NA−is the concen-tration of ionized donors and acceptors, respectively, Rs is the screening length, and ND++ NA−⬵n is the free electron con-centration. In the case of a degenerate semiconductor, the screening length Rs is given by the Thomas-Fermi approximation:6,14 Rs⬵ aB 2 共naB 3兲−1/6, 共4兲 where aB= 4e2 q2 m*
is the effective Bohr radius and m*is the hole effective mass. Combining the Eqs.共3兲 and 共4兲 and using m*= 0.3m
0共Ref. 6兲
yield the following expression: Vrms= 0.785
⫻10−10n5/12共eV兲. According to the analysis of Arnaudov et
al., the localization energy at low temperature is given by the potential fluctuation of the valence band tails:6 Eloc ⬃21/2V
rms. Therefore, the localization energy in InN scales as the n5/12power of the carrier concentration. The solid line in Fig. 3 presents the calculated localization energy versus carrier concentration, which agrees closely with the experi-mental results.
In summary, the concentration-dependent localization energy of carriers is obtained from the emission-energy de-pendence of the PL decays and the PL quenching in thermal-ization. The localization energy increases with the carrier concentration. A model based on the transition between free electrons in the conduction band and localized holes in the deeper tail states is used to explain the concentration depen-dence of localization energy in InN.
This project was supported in part by the National Science Council of Taiwan under Grant Nos. NSC 94-2112-M-033-013 and NSC 94-2745-M-033-001-URD.
1J. Wu, W. Walukiewicz, K. M. Yu, J. W. Ager III, E. E. Haller, Hai Lu, William J. Schaff, Yoshiki Saito, and Yasushi Nanishi, Appl. Phys. Lett.
80, 3967共2002兲.
2V. Yu. Davydov, A. A. Klochikhin, R. P. Seisyan, V. V. Emtsev, S. V. Ivanov, F. Bechstedt, J. Furthmüller, H. Harima, A. V. Mudryi, J. Aderhold, O. Semchinova, and J. Graul, Phys. Status Solidi B 229, R1 共2002兲.
3A. G. Bhuiyan, A. Hashimoto, and A. Yamamoto, J. Appl. Phys. 94, 2779 共2003兲.
4K. S. A. Butcher and T. L. Tansley, Superlattices Microstruct. 38, 1 共2005兲.
5A. A. Klochikhin, V. Yu. Davydov, V. V. Emtsev, A. V. Sakharov, V. A. Kapitonov, B. A. Andreev, Hai Lu, and William J. Schaff, Phys. Rev. B
71, 195207共2005兲.
6B. Arnaudov, T. Paskova, P. P. Paskov, B. Magnusson, E. Valcheva, B. Monemar, H. Lu, W. J. Schaff, H. Amano, and I. Akasaki, Phys. Rev. B
69, 115216共2004兲.
7R. Intartaglia, B. Maleyre, S. Ruffenach, O. Briot, T. Taliercio, and B. Gil, Appl. Phys. Lett. 86, 142104共2005兲.
8J. Wu, W. Walukiewicz, S. X. Li, R. Armitage, J. C. Ho, E. R. Weber, E. E. Haller, Hai Lu, William J. Schaff, A. Barcz, and R. Jakiela, Appl. Phys. Lett. 84, 2805共2004兲.
9F. Chen, A. N. Cartwright, H. Lu, and William J. Schaff, J. Cryst. Growth 269, 10共2004兲.
10T. Passow, K. Leonardi, H. Heinke, D. Hommel, D. Litvinov, A. Rosenauer, D. Gerthsen, D. Litvinov, A. Rosenauer, D. Gerthsen, J. Seufert, G. Bacher, and A. Forchel, J. Appl. Phys. 92, 6546共2002兲. 11E. Cohen and M. D. Sturge, Phys. Rev. B 25, 3828共1982兲.
12M. Strassburg, M. Dworzak, H. Born, R. Heitz, A. Hoffmann, M. Barteis, K. Lischka, D. Schikora, and J. Christen, Appl. Phys. Lett. 80, 473 共2002兲.
13M. Leroux, N. Grandjean, B. Beaumont, G. Nataf, F. Semond, J. Massies, and P. Gibart, J. Appl. Phys. 86, 3721共1999兲.
14J. D. Sheng, Y. Makita, K. Ploog, and H. J. Queisser, J. Appl. Phys. 53, 999共1982兲.
131913-3 Shu et al. Appl. Phys. Lett. 89, 131913共2006兲