Synthesis, Characterization and Analysis of the Acrylamide- and Glycidamide-
Glutathione Conjugates
Yu-Syuan Luo
a, Tai-Ying Long
b, Li-Ching Shen
c, Shou-Ling Huang
d, Su-Yin Chiang
e, Kuen-Yuh Wu
a*a
Institute of Occupational Medicine and Industrial Hygiene, College of Public Health,
National Taiwan University, Taipei 10050, Taiwan
b
Institute of Environmental Health, College of Public Health, National Taiwan
University, Taipei 10050, Taiwan
c
Department of Applied Chemistry, College of Science, National Chiao Tung
University, Hsinchu 30010, Taiwan
d
Instrumentation Center, National Taiwan University, Taipei 10050, Taiwan
e
School of Chinese Medicine, China Medical University, Taichung 404, Taiwan
*Corresponding author: Kuen-Yuh Wu
Institute of Occupational Medicine and Industrial Hygiene, College of Public Health, National Taiwan University, Rm. 721, No.17, Xuzhou Rd., Zhongzheng Dist., Taipei
City 10055, Taiwan.
Tel: +886 2 3366 8091 Fax: +886 2 3366 8267
Email: [email protected]
Graphical abstract
Abstract
Acrylamide (AA) is reported present in high-temperature-processed food and
classified as a possible human carcinogen. In vivo metabolic activation of AA by CYP
2E1 to glycidamide (GA) may play an important role on AA carcinogenicity. AA and
GA can be detoxified by glutathione-S-transferase to form AA and isomeric GA
glutathione conjugates (AA-, GA2- and GA3-GSH, respectively), which can be
further metabolized to mercapturic acids (MAs). Although many studies analyzed
MAs in urine of rodents and humans, few studies have characterized and analyzed the
GSH conjugates. The objectives of this study were to synthesize, purify, and
characterize AA-GSH, GA2-GSH, GA3-GSH, (
13C
3)-AA-GSH, (
13C
3)-GA2-GSH, and
(
13C
3)-GA3-GSH to develop an isotope-dilution liquid chromatography tandem mass
spectrometry (LC-MS/MS) method to analyze AA- and GA-GSHs in blood of rats
treated with AA. After purification and characterization of these conjugates, the LC-
MS/MS method was developed and validated. This method reveals a limit of
detection (S/N = 3) at 0.017 and a limit of quantitation (S/N=10) at 0.05 ng/mL of
serum for AA-GSH, 0.075 and 0.25 ng/mL for GA2-GSH, and 0.15 and 0.5 ng/mL
for GA3-GSH. Analyzed with this method, AA-GSH, GA2-GSH and GA3-GSH were
1651.1 ± 374.5, 18.4 ± 6.3 and 75.3 ± 31.3 ng/mL in blood of male rats at 2 hr after
treatment with 5 mg/kg bw of AA by ip injection. These results showed that the LC-
MS/MS method was successfully developed to analyze AA-GSH, GA2-GSH and GA3-GSH with satisfying sensitivity of AA and GA which were conjugated by glutathione in vivo.
Highlights
● Synthesized and characterized AA- and GA-GSH conjugates.
● Developed a robust LC-ESI-MS/MS method to analyze AA- and GA-GSH
conjugates.
● Successfully determined the AA-GSH, GA2-GSH and GA3-GSH in rat blood.
● Analysis of GSH conjugates provides direct evidence on AA and GA detoxication.
Keywords: Acrylamide; Glycidamide; Glutathione conjugates; LC-ESI-MS/MS
ABBREVIATIONS
AA, acrylamide; AAMA, N-acetyl-S-(2-carbamoylethyl)-cysteine; COSY,
Correlation spectroscopy; EH, epoxide hydrolase; GA, glycidamide; GAMA, N-
acetyl-S-(2-hydroxy-2-carbamoylethyl)-cysteine; GSH, glutathione; GST,
glutathione-S-transferase; HESI, heated electro spray ionization; HMBC,
Heteronuclear multiple-bond correlation spectroscopy; HSQC, Heteronuclear single-
quantum correlation spectroscopy; LOD, limit of detection; LOQ, limit of quantification; MAs, mercapturic acids.
H
2N O
H
2N O
O H
2N
O
OH OH
P450 2E1 H
2O
+GSH +GSH
AA GA GY
H
2N S HN
NH O COOH
O HOOC NH
2O a
b c e d
f g h
i 3 j
2 1
AA-GSH
S HN
NH COOH O
HOOC NH
2O a
b c e d
f g h
i j
HO H
2N
O 2 1 3
GA2-GSH
H
2N S HN
NH O COOH
O HOOC NH
2O a
b c e d
f g h
i 3 j
1 2 OH
GA3-GSH
Scheme 1. AA metabolism in vivo. AA is metabolized to GA by P450 2E1. AA and GA can react with GSH to form AA-GSH, and GA2-GSH and GA3-GSH, respectively.
1. Introduction
Acrylamide (AA) is a widely-used chemical in industries, and in products used for
water treatment, oil drilling, papermaking and mineral processing. AA is neurotoxic
to humans and rodents, and classified as a probable carcinogen to human by
International Agency of Research on Cancer. AA is also present in high-temperature-
processed foods from the reaction between asparagine and reducing sugars, so-called
“the Maillard browning reaction”. AA is also present in tobacco smoking. Average daily intake of AA to the general public was estimated in the range of 0.30.8 μg/kg/day by World Health Organization, and 0.311.1 μg/kg/day for adults, 0.431.4 μg/kg/day for adolescents, and 0.72.05 μg/kg/day for children in Europe.
The potential health effects have been of great concerns due to daily intakes of AA
through food consumption.
Upon absorption, AA can be metabolically activated by cytochrome P450 2E1 (CYP2E1) to glycidamide (GA), which is critical to AA genotoxicity. GA can be spontaneously or enzymatically hydrolyzed to glyceramide. Both AA and GA can also be detoxified through enzymatic (by glutathione-S-transferase, GSTs) or non- enzymatic pathways to form AA- and GA-glutathione conjugates (AA-GSH, GA2- GSH and GA3-GSH), respectively. The AA- and GA-GSH would be further metabolized by γ-glutamyl-transpeptidase, dipeptidases, and N-acetyltransferase to N- acetyl-S-(2-carbamoylethyl)-cysteine (AAMA) and N-acetyl-S-(2-hydroxy-2- carbamoylethyl)-cysteine (GAMA) and excreted through urine. These mercapturic acids have been well studied to serve as biomarkers for current AA exposures and to
imply AA metabolism in vivo .
Analysis of the AA- and GA-glutathione conjugates will further provide direct
evidences of detoxication of AA and GA in vivo and can serve biomarkers to study
interspecies differences in AA detoxication. Therefore, the objective of this study was to synthesize, purify, and characterize the AA- and GA-GSH and to develop an isotope-dilution-LC-MS/MS method to analyze these conjugates in blood of rats treated with AA. This is the first study to simultaneously quantify AA- and GA-GSH in order to clarify the kinetics of AA detoxication in rats.
2. Materials and Methods 2.1 Chemicals.
AA (99.9%, 25 g) was purchased from Alfa Aesar (Ward Hill, MA). GA ( ≧ 96.0%, 100 mg), L-glutathione (Reduced, ≧ 98.0%, 1 g), sodium hydrogen carbonate (99.7%, 1 kg) and formic acid ( ≧ 98.0%, 500 mL) were purchased from Sigma- Aldrich (St. Louis, MO). (
13C
3)-AA (chemical purity: 99.0%; isotope purity: 98.0%) was from Sigma-Aldrich (St. Louis, MO) and (
13C
3)-GA (chemical purity: 97.0%;
isotope purity: 98.0%) from Toronto Research Chemicals (North York, Canada).
Acetonitrile ( ≧ 99.9%, 4 L) was supplied by Merck (Darmstadt, Germany). De- ionized water was prepared by the Milli-Q system (Billerica, MA).
2.1.1 Synthesis, purification and characterization of AA-GSH adduct
AA (35 mM, 2.5 mg in 1.0 mL of H
2O) and GSH (35 mM, 10.8 mg in 1.0 mL of
for 24 h. AA-GSH was purified by using a semi-preparative C18 column (5 μm, 10 x 250 mm, Phenomenex Co., Torrance, CA) with an isocratic elution consisting of 0.1%
formic acid in H
2O (v/v); detection was performed with a HPLC-UV detector ( 210 nm, Jasco UV-975, Easten, MD). The mobile phase was delivered at a flow rate of 2 mL/min by a binary LC pump (Jasco PU-980). The fraction containing AA-GSH was collected with a fraction collector (CHF121SA, Toyo Seisakusho Kaisha, Ltd, Japan), pooled, and dried under vacuum. The residue was dissolved in formic acid/ H
2O (0.1%, v/v) and characterized with a triple quadruple tandem mass spectrometer (Thermo TSQ, Ringoes, NJ) by infusion at a flow rate of 10 μL/min. The MS/MS was operated with a HESI source under positive ion mode. Fragmentation of AA-GSH is
shown in Fig. 1a.
Parts of the purified standards were dissolved in deuterium oxide and further characterized with
1H NMR (Bruker AVIII 500MHz FT-NMR, Instrumentation Center, NTU). The NMR spectrum shows that δ [ppm] = 2.062.10 (m, 2H, c-H), 2.432.51 (m, 2H, d-H), 2.50 (t, J = 6.8 Hz, 2H, 2-H), 2.702.78 (m, 2H, 3-H), 2.82 (dd, J
j’, j”= 14.0 Hz, J
j’, f= 9.0 Hz, 1H, j’-H), 3.00 (dd, J
j’, j”=14.0 Hz, J
j”, f= 5.0 Hz, 1H, j”-H ), 3.72 (t, J = 6.2 Hz, 1H, b-H), 3.87 (s, 2H, h-H), 4.50 (dd, J
f, j’= 8.5 Hz, J
f, j”= 5.0 Hz, 1H, f-H ).
(
13C
3)-AA-GSH was synthesized by following the identical procedures of AA-
GSH synthesis, from the reaction of (
13C
3)-AA with GSH. The MS/MS spectrum of purified (
13C
3)-AA-GSH showed the same fragmentation pattern as AA-GSH. The precursor ion was m/z 382 ([M+H]
+). The product ions were m/z 253, m/z 307 and m/z 107.
2.1.2 Synthesis, purification and characterization of GA2-GSH and GA3-GSH adduct
GA (17.4 mg, 200 mM in H
2O, 1 mL) and GSH (61.5 mg, 200 mM in H
2O, 1 mL) were added into 8 mL NaHCO
3(aq)buffer (50 mM, pH = 9) and stirred at 45
oC for 24 h. GA2-GSH and GA3-GSH were isolated from the product mixture by using the identical HPLC settings as for the purification of AA-GSH. Isocratic elution (0.1% formic acid, (v/v, %) was employed for the separation. The fraction with the peaks at retention times (t
R) of 22 and 28 min were collected and dried under vacuum.
Diastereomers of GA3-GSH were further purified as model compounds for
characterization with NMR.
MS/MS analysis was operated under the identical conditions with those used to
characterize AA-GSH. Fragmentations of GA2-GSH and GA3-GSH are presented in
Fig. 1b and Fig. 1c correspondingly.
Fig. 1(a) Product ion spectrum of AA-GSH. MS/MS spectrum was obtained
under positive ion mode. The precursor ion ([M+H]
+) of AA-GSH is m/z 379;
fragment ions include m/z 250 by loss of γ-glutamyl moiety, m/z 304 by loss of glycine moiety and m/z 274 by loss of 3-sulfanylpropanamide (m/z 104). (b) Product ion spectrum of GA2-GSH. The precursor ion ([M+H]
+) of GA2-GSH is m/z 395, and fragment ions include m/z 266 by loss of γ-glutamyl moiety, m/z 320 by loss of glycine moiety and m/z 248 by loss of hydroxyl and γ-glutamyl moiety. (c) Product ion spectrum of GA3-GSH. The precursor ion ([M+H]
+) of GA3-GSH is m/z 395, and fragment ions include m/z 266 by loss of γ-glutamyl moiety, m/z 320 by loss of glycine moiety and m/z 249 by loss of hydroxyl and γ- glutamyl moiety.
The purified GA2-GSH and GA3-GSH were dissolved in deuterium oxide and
further characterized by 1H NMR, 13C NMR, HSQC, HMBC and H,H-COSY
(Bruker AVIII 500MHz FT-NMR, Instrumentation Center, NTU). The NMR data for
GA2-GSH were as follows:
1H NMR (500 MHz, D
2O): δ [ppm] = 2.072.10 (m, 2H,
c-H), 2.442.49 (m, 2H, d-H), 2.873.11 (m, 2H, j-H), 3.493.51 (m, 1H, 2-H),
3.703.78 (m, 2H, 3-H), 3.80 (s, 2H, h-H), 4.524.55 (m, 1H, f-H).
13C NMR (500
MHz, D
2O): δ [ppm] = 26.1 (CH
2-c), 31.3 (CH
2-d), 32.5; 32.7 (CH
2-j), 42.4 (CH
2-h),
50.0; 50.2 (CH-2), 53.0; 53.2 (CH-f), 54.0 (CH-b), 61.5(CH
2-3), 172.00 (C-g), 173.83
(C-a), 174.77 (C-i), 174.85; 174.89 (C-e), 175.6; 175.8 (C-1).
The NMR data for GA3-GSH were as follows:
1H NMR (500 MHz, D
2O): δ [ppm]
= 2.062.10 (m, 2H, c-H), 2.402.50 (m, 2H, d-H), 2.80 (dd, J
3’, 3’’= 14.3Hz; J
3’, 2= 6.7 Hz, 1H, 3’-H), 2.96 (dd, J
3’’, 3’= 14.1Hz; J
3’’, 2= 3.8Hz, 1H, 3’’-H) , 2.85 (dd, J
j’, j’’= 14.3Hz; J
j’, f= 8.9Hz, 1H, j’-H), 3.05 (dd, J
j’’, j’= 14.1Hz; J
j’’,f= 4.9Hz, 1H, j’’-H), 3.72 (t, J = 6.3Hz, 1H, b-H), 3.86 (s, 2H, h-H), 4.30 (dd, J
2, 3’= 6.5Hz; J
2,3’’= 3.8Hz, 1H, 2-H), 4.52 (dd, J
f, j’’= 4.9Hz; J
f, j’= 8.7Hz, 1H, f-H).
13C NMR (500 MHz, D
2O): δ [ppm] = 26.0 (CH
2-c), 31.2 (CH
2-d), 33.5 (CH
2-j), 35.8 (CH
2-3), 41.8 (CH
2-h), 53.1 (CH-f), 53.9 (CH-b), 70.3 (CH-2), 172.5 (C-g), 173.7 (C-a), 173.9 (C-i), 174.8 (C-e),
177.8 (C-1).
(
13C
3)-GA2-GSH & (
13C
3)-GA3-GSH: The isotope-substituted standard were
synthesized from the reaction between (
13C
3)-GA and GSH, and purified with the identical HPLC conditions used to purify AA-GSH. The MS spectra of the isotope- substituted standards also show the same fragmentation patterns with GA-GSHs. The precursor ion was m/z 398 ([M+H]
+) and the product ions were m/z 323, m/z 269, and m/z 251for (
13C
3)-GA2-GSH (Fig. S2); m/z 323, m/z 269, and m/z 252 for (
13C
3)-GA3-
GSH (Fig. S3), respectively.
2.2 Quantitative analysis of GSH adducts 2.2.1 Sample preparation
The Oasis MCX cartridge ( 3 mL, 60 mg, 30 μm particle size) was used in solid-
phase extraction to clean blood samples. The cartridges were activated with 3 mL of
methanol and conditioned with 3 mL of H
2O. Serum samples (105 μL) were spiked with 1.05 ng of the corresponding (
13C
3)-substituted compounds, mixed rigorously, diluted with H
2O to 1 mL, and acidified with 10 μL FA. The sample (1mL) was loaded on the cartridge, washed with H
2O (3 mL), and eluted with 2.5 % NH
4OH
(aq)(6 mL). The eluted sample was dried by using a Speed Vac and reconstituted in H
2O (70
μL), and filtered with a PVDF filter (0.22 μm) prior to injection for MS analysis.
2.2.2 LC-ESI-MS/MS
The HPLC system consisted of a hypercarb C18 HPLC column (3 μm, 50 x 2.1 mm, Thermo Scientific), a quaternary LC pump (Accela micropump, Thermo Fisher Scientific), and an auto-sampler (Accela, Thermo Fisher Scientific). The gradient mobile phases consisted of solution A (0.05 % formic acid in acetonitrile) and solution B (0.05 % formic acid in H
2O). After sample pretreatment as described in 2.2.1, 10 μL of the sample was injected into LC-MS/MS. The gradient program was
described as the following time sequence [Time (A %)]: 0 min (0) 3 min (0) 4 min (10) 10 min (15) 10.1 min (100) 13 min (100) 13.1 min (0) 18.0 min (0).
A triple quadruple mass spectrometry (TSQ Quantum Access, Thermo Fisher
Scientific, Ringoes, NJ) with an electrospray ionization interface was used for sample
analysis. A spray voltage was set at 3.5 kV, sheath gas and auxiliary gas flow rate at
40 and 40 arbitrary units, a capillary temperature at 300
oC, and an HESI temperature
at 300
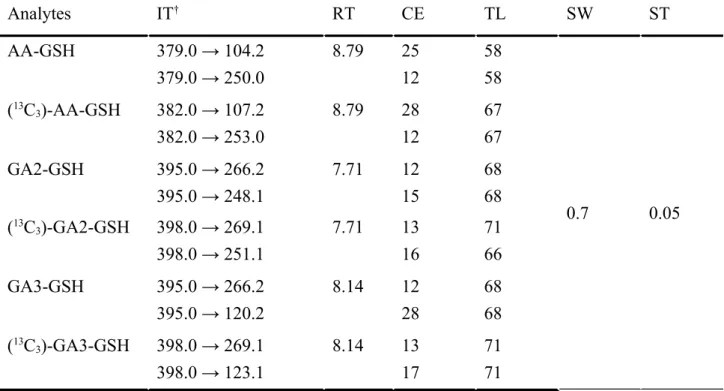
oC were set for MS analysis. The GSH conjugates were quantified by using multiple reaction monitoring (MRM) under positive ion mode, and the optimized MRM parameters were m/z 379.0 → 250.0 for AA-GSH and m/z 382.0 → 253.0 for (
13C
3)-AA-GSH , m/z 395.0 → 266.2 for GA2-GSH and GA3-GSH conjugates, and m/z 398.0 → 269.1 for (
13C
3)-GA2-GSH and (
13C
3)- GA3-GSH conjugates. The mass
parameters are summarized in Table 2.
2.2.3 Method validation
Calibration curves were achieved by repeatedly analysis of AA-GSH, GA2-GSH and GA3-GSH standard solutions prepared in water and rat serum. The concentration ranges were 12000 and 2500 ng/mL for AA-GSH, and 1, 5, 10, 25, 50, 100 and 150 ng/mL for GA2-GSH and GA3-GSH. Standard solutions were spiked with 1.05 ng of each internal standard. The matrix effect (ME
%), recovery (RE %) and process efficiency (PE %) were calculated according to Matuszewski et al. Quality control samples (QCs) were prepared with three different levels (1, 50, 1000 ng/mL for AA-GSH, and 1, 10, 100 ng/mL for GA2- and GA3-
GSH) to evaluate the inter- and intra-day accuracy and precision of this method.
2.2.4 Animal study
All procedures involved in the animal study were approved by the Institutional
Animal Care and Use Committee of National Taiwan University. Male Sprague-
Dawley rats of 78 weeks were obtained from BioLasco (Taiwan), and maintained on
the 12:12 h light / dark cycle with food and water ad libitum. Animals were divided into control (n = 5) and exposed (n = 5) groups, and acclimatized for one week prior to the treatment. For the exposed group, rats were treated with 5 mg/kg AA through single ip injection (body weight: 352.6 ± 16.0 g, n = 5). The blood was collected from tail veins at 2 h after treatment for analysis of the GSH conjugates. The collected blood samples were centrifuged (3000 rpm, 10 min) at 4
oC. The serum was collected, spiked with internal standard (1.05 ng each), and stored at -20
oC for the future
analysis.
3. Results and Discussion
Glutathione conjugation is usually considered as a detoxication mechanism and plays an important role in toxicity expression of a chemical. The AA detoxication was either studied by using indirect analysis of the GSH depletion in erythrocytes or liver and brain of rats treated with AA
,, or urinary MA in rodents or humans. These studies implied that AA spontaneously and enzymatically conjugated with GSH to form GSH-conjugates. Watzek et al. and Pernice et al. had measured AA-GSH to elucidate the detoxication of AA. If GA-GSH can be measured, it would help to further illustrate GA detoxication.
3.1 Synthesis, Purification and Characterization of the AA- and GA-GSH adduct.
this study, the MS/MS and NMR spectra of AA-GSH are consistent with their previous results. (
13C
3)-AA-GSH was also characterized with MS/MS and showed identical fragmentation pattern with deviation of three mass unit.
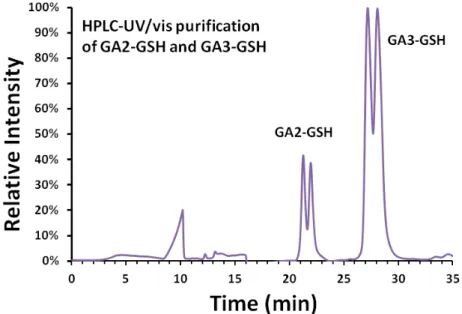
Fig. 2. HPLC chromatogram for purification of GA-GSH adducts with UV/Vis at 210 nm. GA3-GSH is preferred as the major product due to the steric hindrance effect of the amide group. The corresponding split peaks in the HPLC chromatogram were confirmed as the diastereomers of GA3-GSH by using NMR characterization.
GA-GSH was purified from the reaction mixture with HPLC (Fig. 2). GA3-
GSH was the major product (~3.8 folds greater than GA2-GSH) due to the steric
hindrance effect of GA. Because the conjugation of GSH to GA introduced a chiral
center at C-2 for GA2-GSH and GA3-GSH, the HPLC chromatogram showed split
peaks, suggesting two diastereomers for each GSH conjugates. Urinary GAMA2 or GAMA3 analyzed with LC-MS/MS also revealed split peaks, which are consistent with our observations. Diastereomers of GA3-GSH were isolated as model compounds to investigate the chirality of GSH-conjugates. Compared with the duplication of carbon signal in diasteremers GA2-GSH, singlet of the chiral carbon was observed in purified diastereomer (Fig. S4, Supporting Information). The coupling constants (J) of diastereomers were similar; however, the chemical shifts were different in C-h and C-i, which mostly resulted from the space proximity with
the hydroxyl group (Table.1).
According to the MS/MS spectra of GA2-GSH and GA3-GSH, the product ions of m/z 320 and 266 accounted for the anticipated fragmentation of GSH moiety. The distinction between the GSH conjugates were the product ion of m/z 248 for GA2- GSH and m/z 249 for GA3-GSH, both of which resulted from the loss of hydroxyl and γ-glutamyl moiety. The difference probably originated from the position of the hydroxyl group. However, the MS/MS spectra provided insufficient information to fully characterize the position of the hydroxyl group. Hence, GA2-GSH and GA3- GSH were further characterized with HSQC, HMBC and H, H-COSY to differentiate their structures in details.
GA2-GSH and GA3-GSH were formed from the S
N2 reaction between GA and
GSH. Because the chief alteration only occurred nearby the thiol group, the chemical shifts of GSH would stay intact throughout the reaction. The confirmed chemical shifts of GSH could help us to characterize the structures of GA2-GSH and GA3-
GSH.
The
1H NMR spectrum (Fig. S5) of GSH showed singlet at 3.92 ppm was
assigned to h-H, and the
13C NMR signals at 41.5 ppm was assigned to C-h based on
the HSQC spectrum (Fig. S6). The quaternary carbon signal at 173.6 ppm was then
assigned to C-i based on its coupling with h-H (
2J
CH) in the HMBC spectrum of GSH
(Fig. S7). We assigned the most downfield chemical shift at 4.52 ppm in
1H NMR as f
-H since it was neighboring with two amide groups. The methylene proton signals at
2.88 and 2.92 ppm subsequently assigned as j’,j”-H by its coupling with f-H in the
H,H-COSY spectra (Fig. S8). Therefore, the assignments of C-f (55.6 ppm) and C-j
(25.3 ppm) was ascertained by its correlations with f-H and j-H in HSQC. Finally, the
cross peak of b-H (3.77 ppm) in the HSQC indicated that the methine carbon at 53.8
ppm is C-b. According to the correlation of b-H in the H,H-COSY spectrum, the
proton signals at 2.092.14 ppm, with an integration value of 2 in
1H NMR
spectroscopy, could be assigned as c-H. Therefore, the other proton signals at
2.452.56 ppm correspond with c-H in the H,H-COSY spectrum, indicating that it
belong to d-H. In the HMBC spectrum, h-H (
3J
CH) and j-H (
3J
CH) correlated with 172.4
ppm and d-H (
2J
CH), c-H (
3J
CH), f-H (
2J
CH) correlated with 174.9 ppm, were assigned to C-g and C-e, respectively. The other quaternary carbon at 173.6 ppm was C-a,
according to the correlation with b-H (
2J
CH) and c-H (
3J
CH).
Accordingly, we could simply assign the quaternary carbon C-1 (175.6; 175.8 ppm) of GA2-GSH and the quaternary carbon C-1 (177.8; 177.8 ppm) of GA3-GSH.
In the HSQC spectrum of GA2-GSH (Fig. S9) showed the methine carbon C-2 (50.0;
50.2 ppm) correlated with 2-H (3.49 ppm) and methylene carbon C-3 (61.5 ppm)
correlated with 3-H (3.703.78 ppm). Similarly, the methine carbon C-2 (35.8; 36.0
ppm) correlated with 2-H (2.802.96; 2.872.95 ppm) and methylene carbon C-3
(70.3; 70.5 ppm) correlated with 3-H (4.30; 4.32 ppm) of GA3-GSH were also shown
in the HSQC. Since the j-H correlated with C-2 (
3J
CH) and the separated j’-H and j’’-H
correlated with C-3 (
3J
CH) in the HMBC (Fig. 3a, b), suggesting that these compounds
resulted from the reaction of GSH on the C-2 position and C-3 position of
glycidamide, namely, GA2-GSH and GA3-GSH.
Fig. 3. HMBC spectrum of (a) GA2-GSH and (b) GA3-GSH (500 MHz,
D
2O).
3.2 Method development
To completely separate GA2-GSH and GA3-GSH with chromatography, mobile
phases containing methanol and acetonitrile were compared, and the latter appeared to
achieve sharper peaks and better separation of both conjugates. Formic acid was
added into mobile phases (0.05%, v/v) to enhance signal and to improve separation of
GA2-GSH and GA3-GSH. To optimize the operation parameters of the mass
spectrometer to achieve maximum sensitivity, spray voltage (SV), capillary temperature (CT), auxiliary gas (AG), and sheath gas were evaluated and set at 3500 v, 300
oC, 40 psi, and 40 psi, respectively. At CT greater 300
oC, the thermolysis of
GSH conjugates might occur, and the sensitivity of this method could drop.
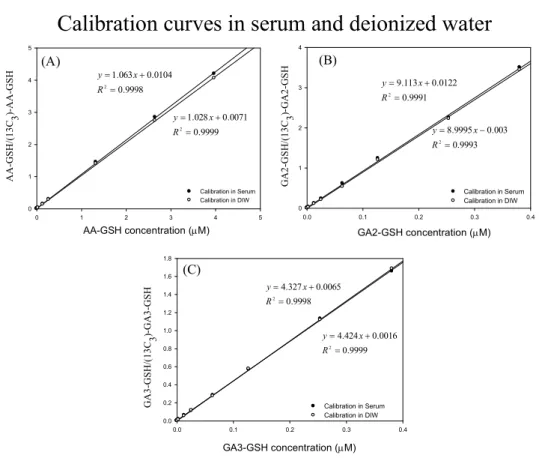
Calibration curves in serum were obtained from triplicate analysis of the calibration standard solutions and fitted with simple linear regression. Linearity (R
2) of the calibration curves were all greater than 0.999. Limit of detection (LOD, S/N = 3) and limit of quantification (LOQ, S/N = 10) were 0.017 and 0.05 ng/mL for AA- GSH, 0.075 and 0.25 ng/mL for GA2-GSH and 0.15 and 0.5 ng/mL for GA3-GSH.
Ion suppression was observed on each analyte at middle and low concentration;
however, the matrix effect was compensated by applying the isotope-substituted internal standard (Fig. 4). The variations of the recoveries were also compensated by using the isotope-substituted internal standard. Inter- and intra-day accuracy and precision (n= 9) were all complied with the recommended guideline of US FDA.
These results demonstrate that our method is successfully developed.
Compared with previous analytical methods of AA-GSH, the current study has
improved the sensitivity of AA-GSH. The LOD of AA-GSH in this study is 111 fold
lower than that in Pernice et al. (0.045 nM to 5 nM), and 5.7 fold lower than that in
Watzek et al (4.7 fmol to 27 fmol). Besides, our study is the first to analyze GA-GSH
conjugates with excellent sensitivities by using LC-ESI-MS/MS. This method would provide advantages to investigate the detoxication of AA in rodents, especially at lower dosage.
AA-GSH concentration (M)
0 1 2 3 4 5
AA-GSH/(13C3)-AA-GSH
0 1 2 3 4 5
Calibration in Serum Calibration in DIW
(A)
0.0 0.1 0.2 0.3 0.4
0 1 2 3 4
Calibration in Serum Calibration in DIW
(B)
Calibration curves in serum and deionized water
0.0 0.1 0.2 0.3 0.4
0.0 0.2 0.4 0.6 0.8 1.0 1.2 1.4 1.6 1.8
Calibration in Serum Calibration in DIW
(C)
9998 . 0
0104 . 0 063 . 1
2
R
x y
9999 . 0
0071 . 0 028 . 1
2
R
x y
9991 . 0
0122 . 0 113 . 9
2
R
x y
9993 . 0
003 . 0 9995 . 8
2
R
x y
9998 . 0
0065 . 0 327 . 4
2
R
x y
9999 . 0
0016 . 0 424 . 4
2
R
x y GA2-GSH/(13C 3)-GA2-GSH
GA3-GSH/(13C3)-GA3-GSH
GA2-GSH concentration (M)
GA3-GSH concentration (M)
Fig. 4. Calibration curves of GSH conjugates in rat serum and deionized water.
Ion suppression effects were eliminated after we applied isotope-dilution quantification. Isotope-substituted standard was added at a level of 10 ng/mL for each GSH conjugate. (A): AA-GSH ; (B): GA2-GSH; (C): GA3-GSH. Labels:
●Standard/Internal Standard area ratio in serum; ○ Standard/Internal Standard area ratio in de-ionized water.
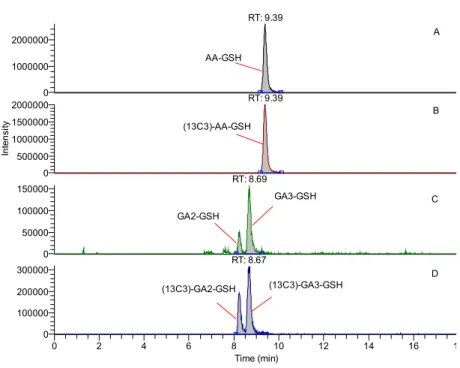
3.3 Determination of AA-GSH, GA2-GSH and GA3-GSH in rat blood
Our newly-developed LC-MS/MS method was sensitive to measure the AA- and GA-GSH in blood of rats treated with 5 mg/kg AA through ip injection (Fig. 5). After 2 h of AA treatment, AA-GSH, GA2-GSH, and GA3-GSH were 1651.1 ± 374.5, 18.4
± 6.3 and 75.3 ± 31.3 ng/mL, respectively. The results demonstrate that our method successfully analyzes the detoxication products of AA and GA in rat blood. The analysis of AA- and GA- GSH conjugates can clarify the species differences in AA detoxication.
RT:0.00 - 18.00
0 2 4 6 8 10 12 14 16 18
Time (min) 0
100000 200000 300000 0 50000 100000 150000 0 500000 1000000 1500000 2000000
Intensity
0 1000000
2000000 A
AA-GSH RT: 9.39
B (13C3)-AA-GSH
RT: 9.39
C GA2-GSH
GA3-GSH RT: 8.69
D (13C3)-GA3-GSH
(13C3)-GA2-GSH RT: 8.67
NL: 2.60E6
TIC F: + c ESI SRM ms2 379.000 [103.850-104.550, 249.650-250.350]
MS Genesis Male-HighDose-R3-T3
NL: 2.00E6
TIC F: + c ESI SRM ms2 382.000 [106.850-107.550, 252.650-253.350]
MS Genesis Male-HighDose-R3-T3
NL: 1.57E5
TIC F: + c ESI SRM ms2 395.000 [119.850-120.550, 247.750-248.450, 265.850-266.550] MS Genesis Male-HighDose-R3-T3
NL: 3.19E5
TIC F: + c ESI SRM ms2 398.000 [122.750-123.450, 250.750-251.450, 268.750-269.450] MS Genesis Male-HighDose-R3-T3
Fig. 5. Representative LC-MS/MS chromatograms in rat blood. GSH conjugates
were detected successfully in rat treated with 5 mg/kg AA. SRM channel: A: AA-
GSH, m/z 379 → 250; B: (
13C
3)-AA-GSH, m/z 382 → 253; C: GA-GSH, m/z 395.0 →
Analysis of AA-GSH was used to investigate the detoxication of AA in vitro.
Pernice at al. studied the effect of sulforaphane (SFN) on the detoxication of AA in Caco-2 cell. SFN was reported to induce GST expression (~1.9 fold) in mouse liver.
Although GST activity decreased after incubation with AA, AA-GSH concentration was about 1,000-fold higher in cells co-incubated with AA and SFN than that in situ chemical synthesis using similar concentration of AA and SFN. This result suggested that formation of AA-GSH was catalyzed by GST. Watzek et al. reported that AA- GSH was generated much earlier than GA (0.5 h to 16 h) for hepatocytes incubated with 2 μM of AA, suggesting that detoxication of AA by GST could be faster than CYP-mediated epoxidation of AA. Aside from the formation of AA-GSH, AAMA also occurred in a concentration and time-dependent manner in rat hepatocytes.
Though rat livers only play a minor role in MAs formation, this evidence demonstrated that primary rat hepatocytes can metabolize AA-GSH to AAMA. Since GSH conjugate appears faster and serves as the direct evidence of primary detoxication, further studies of AA- and GA-GSH toxicokinetics would help to capture AA and GA detoxication in vivo. Therefore, in the present work, an isotope- dilution LC-MS/MS method was developed to accurately quantify AA- and GA-GSH conjugates with excellent sensitivity and specificity.
Mercapturic acids of AA and GA has also been well studied in rodents and
humans. These studies revealed that the majority of AA was metabolized to MAs
(29~71 % in rats, 26~50% in humans), supposedly through GST detoxication. Based
on AA toxicokinetics in SD rat, AA-GSH measured was 27.4% of measured AA at
2h, which proportion was significantly lower than those estimated by using urinary
mercapturic acids The discrepancy between urinary MAs and serum GSH-conjugates
might result from the reactions between AA and GA with free N-acetyl-L cysteine
(NAC) in blood and urine to form AAMA and GAMA, which might lead to
overestimation of detoxification of AA and GA by GST, when measured as MAs. In
addition, the half lives of AAMA and GAMAs are much greater than those of AA and
GA, which could also result in overestimation if urinary AA metabolites were used to
estimate the proportion of detoxification of AA and GA by GST. In order to fully
characterize AA metabolism and detoxification, direct analysis of AA- and GA-GSH
will generate appropriate estimation. In this study, our objective was to synthesize,
characterize, and quantify AA- and GA-GSH. Analysis of AA- and GA-GSH in rats
treated with AA was to validate our newly-developed analytical methods. Indeed, our
results reveal that this method could quantify AA- and GA-GSH in blood samples
with excellent selectivity and sensitivity. AA-, GA2- and GA3-GSH in blood of rats
treated with 5 mg/kg AA were detected with LODs of 0.017, 0.075 and 0.15 ng/mL,
respectively. AA- and GA-GSH were analyzed at 2 hrs after AA treatment, and
interpretation of these results is very limited. Therefore, our future work is to study the toxicokinetics of AA- and GA-GSH so that the role of GST in AA and GA
detoxification will be fully illustrated.
In conclusion, this study has synthesized, purified, and characterized AA- and GA-GSHs, and successfully developed a sensitive LC-MS/MS method to directly analyze these conjugates in blood. By applying this method, AA-GSH, GA2-GSH and GA3-GSH has been analyzed to demonstrate AA and GA detoxication by GSH in AA-treated rats. According to our results, the estimated levels of AA-, GA2- and GA3-GSH in blood of rats treated with 0.05 μg/kg of AA will be greater than our LODs, and should be detectable with our newly-developed method. Such exposure level of AA is comparative to the human daily intakes, making this method applicable in human studies. Further studies in AA detoxication across different species can further reduce uncertainty in species extrapolation of internal dose and improve quality of health risk assessment of AA exposure.
Conflict of interest
The authors declare that there are no conflicts of interest.
Acknowledgements
This study was supported by a grant from National Science Council (grant number,
NSC 101-2314-B-002-115-MY3).
Supplementary data
Product ion scan spectra of isotope-substituted internal standards (Fig. S1S3), the NMR spectra of GSH conjugates (Fig. S4S11) and the results of method validation (Table S1) are available free of charge via the internet.
Reference
[1] IARC, Acrylamide. Monographs on the evaluation of carcinogen risk to humans., International Agency for Research on Cancer, Lyon, France, 1994, pp. 389-433.
[2] E. Tareke, P. Rydberg, P. Karlsson, S. Eriksson, M. Tornqvist, Analysis of acrylamide, a carcinogen formed in heated foodstuffs, J. Agric. Food Chem., 50 (2002) 4998-5006.
[3] C.J. Smith, T.A. Perfetti, M.A. Rumple, A. Rodgman, D.J. Doolittle, "IARC group 2A Carcinogens" reported in cigarette mainstream smoke, Food Chem. Toxicol., 38 (2000) 371-383.
[4] WHO, FAO/WHO Consultation on the health implications of acrylamide in food World Health Organization, Geneva, 2002.
[5] EFSA, Results on acrylamide levels in food from monitoring years 2007-2009 and Exposure assessment, 2011.
[6] E. Settels, U. Bernauer, R. Palavinskas, H.S. Klaffke, U. Gundert-Remy, K.E.
Appel, Human CYP2E1 mediates the formation of glycidamide from acrylamide, Arch. Toxicol., 82 (2008) 717-727.
[7] M. Baum, E. Fauth, S. Fritzen, A. Herrmann, P. Mertes, K. Merz, M. Rudolphi, H.
Zankl, G. Eisenbrand, Acrylamide and glycidamide: genotoxic effects in V79-cells
and human blood, Mutat. Res-Gen. Tox. En., 580 (2005) 61-69.
[8] N. Mei, L.P. McDaniel, V.N. Dobrovolsky, X.Q. Guo, J.G. Shaddock, R.A.
Mittelstaedt, M. Azuma, S.D. Shelton, L.J. McGarrity, D.R. Doerge, R.H. Heflich, The genotoxicity of acrylamide and glycidamide in big blue rats, Toxicol. Sci., 115 (2010) 412-421.
[9] B.I. Ghanayem, K.L. Witt, L. El-Hadri, U. Hoffler, G.E. Kissling, M.D. Shelby, J.B. Bishop, Comparison of germ cell mutagenicity in male CYP2E1-null and wild- type mice treated with acrylamide: evidence supporting a glycidamide-mediated effect, Biol. Reprod., 72 (2005) 157-163.
[10] B. Paulsson, N. Kotova, J. Grawe, A. Henderson, F. Granath, B. Golding, M.
Tornqvist, Induction of micronuclei in mouse and rat by glycidamide, genotoxic metabolite of acrylamide, Mutat. Res-Gen. Tox. En., 535 (2003) 15-24.
[11] D. Segerback, C.J. Calleman, J.L. Schroeder, L.G. Costa, E.M. Faustman, Formation of N-7-(2-carbamoyl-2-hydroxyethyl)guanine in DNA of the mouse and the rat following intraperitoneal administration of [14C]acrylamide, Carcinogenesis, 16 (1995) 1161-1165.
[12] S.C.J. Sumner, J.P. Macneela, T.R. Fennell, Characterization and quantitation of urinary metabolites of [1,2,3-C-13]acrylamide in rats and mice using C-13 nuclear- magnetic-resonance spectroscopy, Chem. Res. Toxicol., 5 (1992) 81-89.
[13] S.C. Sumner, C.C. Williams, R.W. Snyder, W.L. Krol, B. Asgharian, T.R.
Fennell, Acrylamide: a comparison of metabolism and hemoglobin adducts in rodents following dermal, intraperitoneal, oral, or inhalation exposure, Toxicol. Sci., 75 (2003) 260-270.
[14] E.C. Hartmann, M.I. Boettcher, H.M. Bolt, H. Drexler, J. Angerer, N-Acetyl-S-
(1-carbamoyl-2-hydroxy-ethyl)-l-cysteine (iso-GAMA) a further product of human
metabolism of acrylamide: comparison with the simultaneously excreted other
mercaptuic acids, Arch. Toxicol., 83 (2009) 731-734.
[15] E.C. Hartmann, J.M. Latzin, B.K. Schindler, H.M. Koch, J. Angerer, Excretion of 2,3-dihydroxy-propionamide (OH-PA), the hydrolysis product of glycidamide, in human urine after single oral dose of deuterium-labeled acrylamide, Arch. Toxicol., 85 (2011) 601-606.
[16] U. Fuhr, M.I. Boettcher, M. Kinzig-Schippers, A. Weyer, A. Jetter, A. Lazar, D.
Taubert, D. Tomalik-Scharte, P. Pournara, V. Jakob, S. Harlfinger, T. Klaassen, A.
Berkessel, J. Angerer, F. Sorgel, E. Schomig, Toxicokinetics of acrylamide in humans after ingestion of a defined dose in a test meal to improve risk assessment for acrylamide carcinogenicity, Cancer Epidem. Biomar., 15 (2006) 266-271.
[17] T.R. Fennell, S.C.J. Sumner, R.W. Snyder, J. Burgess, M.A. Friedman, Kinetics of elimination of urinary metabolites of acrylamide in humans, Toxicol. Sci., 93 (2006) 256-267.
[18] B.K. Matuszewski, M.L. Constanzer, C.M. Chavez-Eng, Strategies for the assessment of matrix effect in quantitative bioanalytical methods based on HPLC- MS/MS, Anal. Chem., 75 (2003) 3019-3030.
[19] R. Dixit, M. Das, P.K. Seth, H. Mukhtar, Interaction of acrylamide with glutathione in rat erythrocytes, Toxicol. Lett., 23 (1984) 291-298.
[20] R. Dixit, H. Mukhtar, P.K. Seth, C.R.K. Murti, Conjugation of acrylamide with glutathione catalyzed by glutathione-S-transferases of rat-liver and brain, Biochem.
Pharmacol., 30 (1981) 1739-1744.
[21] N. Watzek, D. Scherbl, M. Schug, J.G. Hengstler, M. Baum, M. Habermeyer, E.
Richling, G. Eisenbrand, Toxicokinetics of acrylamide in primary rat hepatocytes:
coupling to glutathione is faster than conversion to glycidamide, Arch. Toxicol., 87 (2013) 1545-1556.
[22] R. Pernice, J. Hauder, P. Koehler, P. Vitaglione, V. Fogliano, V. Somoza, Effect
dependent detoxification of acrylamide in Caco-2 cells, Mol. Nutr. Food Res., 53 (2009) 1540-1550.
[23] Y.F. Huang, K.Y. Wu, S.H. Liou, S.N. Uang, C.C. Chen, W.C. Shih, S.C. Lee, C.C.J. Huang, M.L. Chen, Biological monitoring for occupational acrylamide exposure from acrylamide production workers, Int Arch Occ Env Hea, 84 (2011) 303- 313.
[24] M. Kellert, K. Scholz, S. Wagner, W. Dekant, W. Volkel, Quantitation of mercapturic acids from acrylamide and glycidamide in human urine using a column switching tool with two trap columns and electrospray tandem mass spectrometry, J Chromatogr A, 1131 (2006) 58-66.
[25] K.J. T. Bjellaas , E. Lundanes , L. Kronberg, G. Becher, Determination and quantification of urinary metabolites after dietary exposure to acrylamide, Xenobiotica, 35 (2005) 1003-1018.
[26] Center for Drug Evaluation and Research (U.S.), Center for Veterinary Medicine (U.S.), Guidance for industry bioanalytical method validation, U.S. Dept. of Health and Human Services, Food and Drug Administration Center for Veterinary Medicine, Rockville, MD, 2001, pp. 1 online resource (22 p.).
[27] Y.S. Zhang, P. Talalay, C.G. Cho, G.H. Posner, A major inducer of anticarcinogenic protective enzymes from broccoli - isolation and elucidation of structure, P. Natl. Acad. Sci. USA, 89 (1992) 2399-2403.
[28] A. Meister, M.E. Anderson, Glutathione, Annu. Rev. Biochem., 52 (1983) 711- 760.
[29] D.R. Doerge, N.C. Twaddle, M.I. Boettcher, L.P. McDaniel, J. Angerer, Urinary excretion of acrylamide and metabolites in Fischer 344 rats and B6C3F(1) mice administered a single dose of acrylamide, Toxicol. Lett., 169 (2007) 34-42.
[30] F.I. Berger, J. Feld, D. Bertow, G. Eisenbrand, G. Fricker, N. Gerhardt, K.H.
Merz, E. Richling, M. Baum, Biological effects of acrylamide after daily ingestion of various foods in comparison to water: A study in rats, Mol. Nutr. Food Res., 55 (2011) 387-399.
[31] D.S. Barber, J.R. Hunt, M.F. Ehrich, E.J. Lehning, R.M. LoPachin, Metabolism,
toxicokinetics and hemoglobin adduct formation in rats following subacute and
subchronic acrylamide dosing, Neurotoxicology, 22 (2001) 341-353.
Tables
Table 1. NMR Chemical Shifts and Coupling Constants of GSH and GA-GSH
GSH GA2-GSH
*GA3-GSH, Diastereomer A GA3-GSH, Diastereomer B
Position δ
H(ppm) J (Hz) δ
Cδ
H(ppm) δ
Cδ
H(ppm) J (Hz) δ
Cδ
H(ppm) J (Hz) δ
Ca 173.6 173.8 173.7 173.9
b 3.77
†( t, 1H) 6.4 53.8 3.70-3.78
†( m, 1H) 54.0 3.72
†( t, 1H) 6.3 53.9 3.72
†( t, 1H) 6.3 54.1
c 2.09-2.14 ( m, 2H) 26.0 2.07-2.10 ( m, 2H) 26.1 2.06-2.10 ( m, 2H) 26.0 2.08-2.12 ( m, 2H) 26.1
d 2.45-2.56 ( m, 2H) 31.2 2.44-2.49 ( m, 2H) 31.3 2.40-2.50 ( m, 2H) 31.2 2.43-2.53 ( m, 2H) 31.4
e 174.9 174.8;174.9 174.8 174.9
f 4.52
†( dd, 1H) 5.4, 6.9 55.6 4.52-4.55
†( m, 1H) 53.0;53.2 4.52
†( dd, 1H) 4.9, 8.7 53.1 4.57
†( dd, 1H) 5.1, 8.8 53.3
g 172.4 172.0 172.5 172.0
h 3.92 ( s, 2H) 41.5 3.80 ( s, 2H) 42.4 3.86 ( s, 2H) 41.8 3.76 ( s, 2H) 43.0
i 173.6 174.8 173.9 175.6
j’ 2.88 ( dd, 1H) 14.2,6.9
25.3 2.87-3.11 ( m, 2H)
32.5;32.7 2.85 ( dd, 1H) 14.3, 8.9
33.5 2.89 ( dd, 1H) 14.1, 8.8
j’’ 2.92 ( dd, 1H) 14.2,5.4 3.05 ( dd, 1H) 14.1, 4.9 3.07 ( dd, 1H) 14.1, 4.9 33.8
3 3.70-3.78 ( m, 2H) 61.5 2.80 ( dd, 1H) 14.3, 6.7 35.8 2.87 ( dd, 1H) 14.1,6.2 36.0
3’ 2.96 ( dd, 1H) 14.1, 3.8 2.95 ( dd, 1H) 14.1, 4.1
2 3.49-3.51
†( m, 1H) 50.0;50.2 4.30
†( dd, 1H) 6.5, 3.8 70.3 4.32 ( dd, 1H) 6.2, 4.2 70.5
1 175.6;175.8 177.8 177.8
Assigning numbers are according to Scheme 1 and are confirmed by COSY, HSQC, HMBC and DEPT experiments.
*
Racemic compound.
†Chiral center. GSH, GA2-GSH and GA3-GSH was characterized in D
2O by 500 MHz NMR.
Table 2. LC-MS/MS parameters used to quantify AA-and GA-GSH
Analytes IT
†RT CE TL SW ST
AA-GSH 379.0 → 104.2
379.0 → 250.0
8.79 25
12
58 58
0.7 0.05
(
13C
3)-AA-GSH 382.0 → 107.2 382.0 → 253.0
8.79 28
12
67 67
GA2-GSH 395.0 → 266.2
395.0 → 248.1
7.71 12
15
68 68 (
13C
3)-GA2-GSH 398.0 → 269.1
398.0 → 251.1
7.71 13
16
71 66
GA3-GSH 395.0 → 266.2
395.0 → 120.2
8.14 12
28
68 68 (
13C
3)-GA3-GSH 398.0 → 269.1
398.0 → 123.1
8.14 13
17
71 71
†