九十七年度 成功大學補助優秀新進教師學術研究計畫 以合成音樂刺激進行人類音樂感知模型建構
期末報告
計畫編號:D97-3600
計畫主持人:資訊工程學系 梁勝富
計畫參與人員:曹育祥、劉啟生、張婉琳、陳偉宏
中 華 民 國 98 年 02 月 28 日
以合成音樂刺激進行人類音樂感知模型建構 計畫編號:D97-3600
主持人:資訊工程學系 梁勝富
計畫參與人員:曹育祥、劉啟生、張婉琳、陳偉宏
Abstract—Music provides a tool to study numerous aspects of neuroscience from motion-skill to emotion since listening to and producing music involves many brain functions. The musician’s brain is also regarded as an ideal model to investigate plasticity of the human brain. In this study, an EEG-based neural network is proposed to assess neuroplasticity induced by musical training. A musical chord perception experiment is designed to acquire and compare the behavioral and neural responses of musicians and non-musicians. The ERPs elicited by the consonant and dissonant chords are combined together as the features of the model. The principle component analysis (PCA) is used to reduce feature dimensions and the dimension-reduced features are input to a feedforward neural network to recognize the brain potentials belong to a musician or a non-musician. The accuracy can reach 97% in average for leave-one-out cross validation of six subjects in this experiment. It demonstrates the feasibility of assessing effects of musical training by ERP signals elicited by musical chord perception.
I.INTRODUCTION
USIC is the art of thinking in sounds and it has fascinated neuroscientists for more than 30 years [1]. It is suggested that music provides a tool to study numerous aspects of neuroscience from motion-skill to emotion since listening to and producing music involves many brain functions such as complex auditory pattern-processing mechanisms, attention, memory storage and retrieval, motor programming, sensory–motor integration, etc [2].
When listening to music, the auditory information passes through different processing stages such as auditory features extraction, auditory Gestalten formation until a musical percept becomes conscious [3]. It relies on relations between elements, rather than on absolute values of elements such as a tune, which is defined by the arrangement of the intervals between the pitches [4].
Consonance of chords is one of the most typical features of relative pitch intervals in the experience of music [5]. At the peripheral level, consonance can be defined as the absence of roughness due to the bandwidth limitation of cochlear basilar membrane [6]. According to the analysis results of electroencephalographic (EEG) signals of subjects with musical training, it was reported that chord stimuli with different musical consonant levels will elicit different event related potential (ERP) patterns. The P2 and N2 components are most negative for minor second (most dissonant) and least negative (or most positive) for perfect fifth (most consonant) [7]. It is interested to investigate if they are due to the experience-driven neuroplasticity [8][9] of musical training and to develop a model to recognize this neuroplasticity based on the EEG which is a noninvasive and convenient modality to observe brain activities
compared with the other neuroimaging methods.
In this study, we first design a musical chord perception experiment to acquire and compare the behavioral and neural responses of musicians and non-musicians. Differing from most of the ERP or BCI studies to classify cognitive state or intention of subjects, or the stimuli subjects perceive by the averaging or single-trail analysis of EEG signals [10]-[16], we combine the ERPs elicited by the consonant and dissonant chords together as the features of a neural network to estimate that the subject is a musician or a non-musician. The principle component analysis is utilized to reduce the feature dimensions and the leave-one-out cross validation is performed to evaluate the generalization of the proposed model.
II.EXPERIMENTAL SETUP
A. Experimental Environment
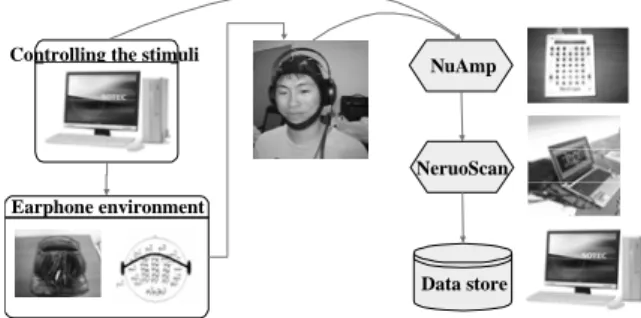
We constructed a human auditory perception experimental environment as shown in Figure 1. It consists of two major parts:
(a) the music listening environment and (b) the physiological acquisition system. It can provide controllable and realistic music/sound stimuli to the subjects. The intensity of the auditory stimuli was kept consistent by measured with a sound level meter. The lighting condition was also be fixed. The 40-channel physiological signal acquisition system collected the subjects’
physiological data. The research measured 30-channel electroencephalogram (EEG) signals. All physiological signals were amplified and filtered via NeuroScan NuAmps and the music stimuli were also recorded simultaneously. An electrode cap was mounted on the subject’s head for signal acquisitions and the EEG electrodes were placed based on the 10-20 International System of Electrode Placement standards.
NuAmp
NeruoScan
Data store Controlling the stimuli
Earphone environment
Fig. 1. The block diagram of human music-perception experimental environment with the EEG-based physiological measurement system.
B. Stimuli
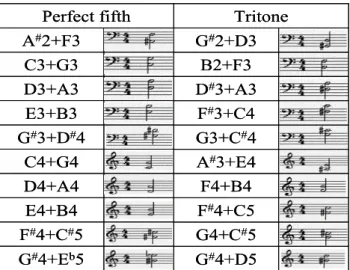
As shown in Fig. 2(a), two types of pitch intervals called perfect fifth (7 semitones, consonant intervals) and tritone (6
M
semitones, dissonant intervals) generated by summing two sinusoidal tones were presented as the stimuli. Each type of pitch intervals contains 10 dyads with the equal-tempered chromatic scale (A4=440 Hz) in the range G#2 (104 Hz) to E5 (659 Hz). Each sound stimulus sustained 350 ms with 100-ms falling time and the intensity level was controlled as 60 dB.
G#4+Eb5 F#4+C#5 E4+B4 D4+A4 C4+G4 G#3+D#4
E3+B3 D3+A3 C3+G3 A#2+F3
Perfect fifth
G#4+Eb5 F#4+C#5 E4+B4 D4+A4 C4+G4 G#3+D#4
E3+B3 D3+A3 C3+G3 A#2+F3
Perfect fifth
G#4+D5 G4+C#5 F#4+C5 F4+B4 A#3+E4 G3+C#4 F#3+C4 D#3+A3 B2+F3 G#2+D3
Tritone
G#4+D5 G4+C#5 F#4+C5 F4+B4 A#3+E4 G3+C#4 F#3+C4 D#3+A3 B2+F3 G#2+D3
Tritone
Fig. 2 Two types of pitch intervals called perfect fifth (7 semitones) and tritone (6 semitones) were presented as the stimuli. Each type of pitch intervals contains 10 dyads with the equal-tempered chromatic scale (A4=440 Hz) in the range G#2 (104 Hz) to E5 (659 Hz).
C. Subjects
Six subjects, three musicians and three non-musicians (20-22 years of age) with normal hearing participated in the experiments. The 3 musicians majored in piano (2/3) and Chinese flute (1/3) had played their major instruments for 14-19 years and practiced 7-28 hours per week. Non-musicians did not play any instruments and had no formal musical training.
D. Data Collection
Scalp EEG was amplified by Neuroscan NuAmp and filtered on-line with a bandpass filter (DC to 100 Hz, 6-dB/octave attenuation). Data was continuously recorded in DC mode at a sampling rate of 1000 Hz from 32 electrodes mounted in an elastic cap and referenced to the nose tip, in accordance with the 10-20 international system. Impedance at each scalp electrode was reduced to 5KΩ or below. Electrode positions were located by the 3D digitizer (Polhemus Fastrak digitizer). The digitized EEG data were further filtered with a bandpass filter of 0.5-30 Hz to eliminate slow drifts as well as muscular artifacts. The filtered data were down-sampled to 250 Hz for the simplicity of data processing. Subsequently the epochs were rejected when EEG amplitude exceeded 100 µV.
E. Experiments
Subjects sat on a comfortable chair and wore the earphone for stimuli delivering. They were informed to listen to 2 consonant and 2 dissonant pitch intervals at the beginning. Then the behavior test was performed. Participants had to response to each stimulus through a button press: consonant intervals using the index finger and dissonant intervals using the middle finger, respectively. One session contained 20 stimuli (the 20 dyads in
Fig. 2) that appeared randomly and subjects were asked to respond as fast as possible. There were two sessions in the behavior test and no immediate correction was done throughout the entire experiment. The performance of the behavior test for the six subjects was presented in Table I. It can found that the musicians can perform very high and consistent accuracy compared with the non-musicians.
After behavior test, the auditory event-related potential (AEP) recording was performed. After participants wore EEG cap, they were asked to judge consonant or dissonant intervals immediately without behavioral response. Each of the consonant and dissonant intervals (140 stimuli) was randomly presented in a 15-min session. Two sessions were carried out with 5-min pause. The stimulus sequences contain 140 trials (7 trials/dyad, 7x10 trials/type) for each session and the inter-stimulus interval (ISI) between the stimuli ranged from 2 to 4 seconds. Subjects’
eyes were closed throughout the EEG recoding.
Table I The performance of behavior test for the six subjects.
1.00 1.00
Musician 2
0.90 1.00
Musician 3
0.45 0.55
Non-musician 1
0.70 0.35
Non-musician 2
0.60 0.60
Non-musician 3
0.95 1.00
Musician 1
Tritone Perfect fifth
1.00 1.00
Musician 2
0.90 1.00
Musician 3
0.45 0.55
Non-musician 1
0.70 0.35
Non-musician 2
0.60 0.60
Non-musician 3
0.95 1.00
Musician 1
Tritone Perfect fifth
III.ANALYSIS OF EEGSIGNALS
A. Auditory Event-Related Potentials
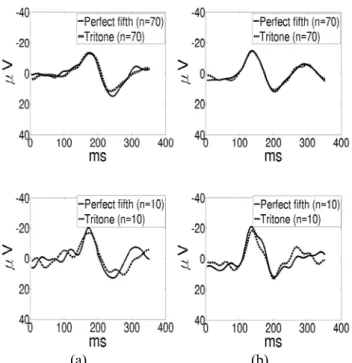
Auditory event-related potentials (AEP) elicited by the presentation of perfect fifth/tritone at Cz channel for the musicians (Musician 3) and non-musician (Non-musician 1) are shown in Figs. 3 (a) and (b), respectively. The AEP components, N1 (90-150 ms), P2 (180-250 ms), and N2 (290-380 ms) can be observed. The first rows of Figs. 3(a) and (b) are obtained by selecting 7 clean trials for each dyad and grouping the trails according to their conditions (70 trials for perfect fifth/tritone), it can be found that musicians had a stronger positive P2 and a stronger negative N2 when perfect fifth was presented than tritone, but not for non-musician. The AEPs of musicians and non-musicians by selecting only 1 trial for each dyad and grouping the trials according to their conditions (10 dyads for perfect fifth/tritone), these trends are also kept although the AEPs look more blurred as shown in the second rows of Figs. 3 (a) and (b). In this study, we will merge one 10-dyad perfect fifth AEP and one 10-dyad tritone AEP of musicians or non-musicians (88+88=176 samples) to be a data vector to be classified.
(a) (b)
Fig. 3 ERPs elicited by the presentation of perfect fifth and tritone at Cz channel for (a) a musician (Musician 3) and (b) a non-musician (Non-musician 1).
.
B. Dataset for Classification
Although there are two AEP recording sessions for each subject so that each dyad of the subject has total 14 trials, some trails will be removed due to artifacts. Therefore, we select 7 trials of each dyad for each subject to be the dataset for classification. Averaging 10 trials corresponding to 10 perfect fifth dyads as the left column of Fig. 2 will perform one 10-dyad perfect fifth AEP and one subject will have 7 such AEPs. Each 10-dyad AEP (from 0 ms to 350 ms, with stimulus given at 0 ms) will contain 88 time points (0.35s *250 Hz = 88).
Similarly, the subject will also have seven 10-dyad tritone AEPs. By merging one 10-dyad perfect fifth AEP and one 10-dyad tritone AEP to be a data vector, one subject will contribute 49 data vectors (7*7=49 combinations) and the dimensions of each data vector are 176 (88+88=176 samples).
Therefore, there will be 294 data vector for training or testing from 6 subjects.
C. Principle Component Analysis
The principal component analysis transforms a set of correlated variables into a new set of uncorrelated variables that can express the relevant information contained in the observation data by using fewer dimensions. It has also been widely used in EEG analysis. In this study, we will combine PCA and neural networks to classify the AEPs of musicians and non-musicians. Two classification experiments were performed.
The first one is using the data samples of one musician and one non-musician to train a model to test the reminding data. The other one is the leave-one-out cross validation that excludes the data samples of one musician and one non-musician for training.
Fig. 4 shows the percentage of data variance against the number of principle components (PCs) corresponding to the data of Musician 1 and Non-musician 1. It can be found the variance will be saturated when more than 25 PCs are utilized. For
leave-one-out cross validation, the variance can also achieve 99% by using 25 PCs. Therefore, the dimensions of input vector will be reduced from 176 to 25 by the PCA in our experiments.
0 5 10 15 20 25 30 35 40 45 50
60 65 70 75 80 85 90 95 100
Number Of PCA Components
Variance (%)
Fig. 4 Percentage of variance against the number of principle components (PCs) corresponding to the data of Musician 1 and Non-musician 1.
D. Classification of AEPs by the Neural Network
A three-layer feedforward neural network is utilized to identify data vectors as AEPs belonging to musicians or non-musicians. As shown in Fig. 5, the neurons of the input layer, hidden layer and the output layer are, 25, 16 and 2, respectively. The desired outputs of two output nodes corresponding to data vector belong to musicians and non-musicians are coded as (1, -1) and (-1, 1), respectively.
The network is trained by the backpropagation with 2000 iterations.
EEG Signal
…
…
PCA-Transformed Feature Space
25 Input node
16 hidden node
2 output node
Outputs (Musician/
Non-Musician) BP Neural
Network
ERP Analysis
[Perfect fifth ERP, Tritone REP ] EEG Signal
EEG Signal
…
…
…
…
…
…
PCA-Transformed Feature Space PCA-Transformed
Feature Space
25 Input node
16 hidden node
2 output node
Outputs (Musician/
Non-Musician) BP Neural
Network
ERP Analysis ERP Analysis
[Perfect fifth ERP, Tritone REP ]
Fig. 5 The neural network utilized to identify data vectors as AEPs belonging to musicians or non-musicians.
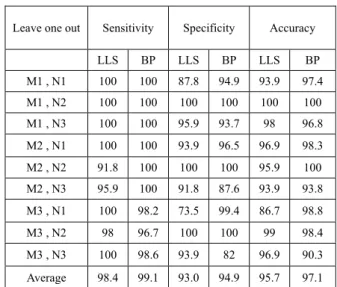
IV.EXPERIMENTAL RESULTS Table III Performance of AEP classification by excluding the data belong to one musician and one non-musician to training a linear least squares (LLS) model and the neural network (leave-one-out validation).
Two subject-independent classification experiments were performed in this study. The first one is using the data vectors of one musician and one non-musician to train a model and the reminding data are used for testing. The other one is the leave-one-out cross validation that excludes the data vectors of one musician and one non-musician for training. For the first experiment, the training dataset contains 98 data vectors (49 samples * 2 subjects) and the testing dataset contains 196 data vectors (49 samples * 4 subjects). For the leave-one-out validation, the training and testing datasets contains 196 and 98 vectors, respectively.
Table II shows the performance of AEP classification by using the data belong to one musician and one non-musician to train a linear least squares (LLS) model and the neural network.
The class of AEPs belong to musician is defined as the true event to calculate the sensitivity and specificity performance.
The first column indicates the training subjects. For example, (M1, N1) represents that the data of Musician 1 (M1) and Non-musician 1 (N1) were used to train classifiers. It can be found that the accuracy of both linear (LLS) and nonlinear (BP) models can reach about 90%. It shows the discriminability of the proposed AEP features. In addition, the average accuracy can improve about 4% by using the neural network instead of the LLS model.
Table II Performance of AEP classification by using the data belong to one musician and one non-musician to train a linear least squares (LLS) model and the neural network.
Table III shows the performance of AEP classification by excluding the data belong to one musician and one non-musician to train the classifiers (leave-one-out cross validation). It can be found that the accuracy can be further improved for both the LLS model and the neural network. The performance of the neural network is also superior to the LLS model and can reach 97% in average. The experimental results demonstrate the feasibility of assessing effects of musical training by ERP signals elicited by musical chord perception.
Leave one out Sensitivity Specificity Accuracy
LLS BP LLS BP LLS BP
M1 , N1 100 100 87.8 94.9 93.9 97.4
M1 , N2 100 100 100 100 100 100
M1 , N3 100 100 95.9 93.7 98 96.8 M2 , N1 100 100 93.9 96.5 96.9 98.3 M2 , N2 91.8 100 100 100 95.9 100 M2 , N3 95.9 100 91.8 87.6 93.9 93.8 M3 , N1 100 98.2 73.5 99.4 86.7 98.8
M3 , N2 98 96.7 100 100 99 98.4
M3 , N3 100 98.6 93.9 82 96.9 90.3 Average 98.4 99.1 93.0 94.9 95.7 97.1
V.CONCLUSIONS
In this study, we developed an EEG-based neural network for assessing human brain plasticity induced by musical training.
The system input is the ERP pairs elicited by the consonant and dissonant chords. The output of the system is the classification result of a neural network that recognizing the ERP pairs belong to a musician or a non-musician. We proposed a detailed experimental design and data-processing procedures for measuring and analyzing the ERP signals. The experimental results show that the proposed system can successfully assess the neuroplasticity induced by musical training. More subjects will be evaluated by the system and the model will be extended to correlate and estimate the behavior performance of subjects in the future.
Training data Sensitivity Specificity Accuracy
LLS BP LLS BP LLS BP M1 , N1 76.5 91.5 86.7 87.3 81.6 89.4 M1 , N2 99 99.0 70.4 77.9 84.7 88.4 M1 , N3 99 99.2 90.8 99.3 94.9 99.2 M2 , N1 100 98.6 91.8 96 95.9 97.3 M2 , N2 100 99.4 86.7 96.3 93.4 97.9 M2 , N3 100 93.3 82.7 96.5 91.3 94.9 M3 , N1 100 99.4 73.5 93.4 86.7 96.4 M3 , N2 100 100.0 96.9 88.5 98.5 94.2 M3 , N3 78.6 87.7 84.7 89.1 81.6 88.4 Average 94.8 96.5 84.9 91.6 89.8 94.0
REFERENCES
[1] M. Critchley, and R. Henson, Music and the Brain: Studies in the Neurology of Music, London: Heinemann, 1977.
[2] R. Zatorre, “Music, the food of neuroscience?” Nature, vol. 434, 312-315, 2005.
[3] S. Koelsch and W. A. Siebel, “Towards a neural basis of music perception,”
Trends in Cognitive Science, vol. 9, no. 12, pp. 578-584, 2005.
[4] I. Peretz, R. J. Zatorre, “Brain organization for music processing,” Annual Review of Psychology, vol. 56, pp. 89-114, 2005.
[5] E. Terhardt, “The concept of musical consonance: a link between music and psychoacoustics,” Music Perception, vol. 1, pp. 276–295, 1984.
[6] R. Plomp and W. J. M. Levelt, “Tonal consonance and critical bandwidth,”
J. Acoust. Soc. Am., vol. 38, pp. 548–560, 1965.
[7] K. Itoh, S. Suwazono, and T. Nakada, “Cortical processing of musical consonance: an evoked potential study,” Neuroreport, vol. 14, no. 18, pp.
2303-2306, 2003.
[8] T. F. Munte, E. Altenmuller, and L. Jancke, “The musician’s brain as a model of neuroplasticity,” Nature Reviews Neuroscience, Vol. 3, pp.
473-478, 2002.
[9] A. Norton, E. Winner, K. Cronin, K. Overy, D.J. Lee, G. Schlaug, “Are There Pre-Existing Neural, Cognitive, or Motoric Markers for Musical Ability?” Brain and Cognition, vol. 59, pp. 124-134, 2005.
[10] D. J. McFarland, G. W. Neat, R. F. Read, and J. R. Wolpaw, “An EEG-based method for graded cursor control,” Psychobiology, vol. 21, no.
1, pp. 77-81, 1993.
[11] G. Pfurtscheller, D. Flotzinger, M. Pregenzer, J. Wolpaw, and D. McFarland,
“EEG-based brain computer interface (BCI),” Medical Progress through Technology, vol. 21, pp. 111-121, 1996.
[12] C. E. Davila and R. Srebro, "Subspace Averaging of Steady-State Visual Evoked Potentials," IEEE Transactions on Biomedical Engineering, pp.
720-728, vol. 47, 2000.
[13] T. P. Jung, S. Makeig, W. Westerfield, J. Townsend, E. Courchesne, and T.
J. Sejnowski, “Analysis and visulization of single-trial event-related potentials,” Human Brain Mapping, vol. 14, no. 3, pp. 166-85, 2001.
[14] S. F. Liang, C. T. Lin, R. C. Wu, Y. C. Chen, T. Y. Huang, T. P. Jung,
“Monitoring Driver's Alertness based on the Driving Performance Estimation and the EEG Power Spectrum ,” in Proc. 27th Int'l Conference of the IEEE Engineering in Medicine and Biology Society, Shanghai, 2005, pp.
[15] C. T. Lin, R. C. Wu, S. F. Liang, W. H. Chao, Y. J. Chen, and T. P. Jung,
“EEG-based Drowsiness Estimation for Safety Driving Using Independent Component Analysis,” IEEE Trans. on Circuits and Systems I, vol. 52, no.
12, pp. 2726-2738, 2005
[16] C. T. Lin, I. F. Chung, L. W. Ko, Y. C. Chen, and S. F. Liang and J. R.
Duann, “EEG-based Assessment of Driver Cognitive Responses in a Dynamic Virtual-Reality Driving Environment,” IEEE Trans. on Biomedical Engineering, vol. 54, no. 7, pp. 1349-1352, 2007.