國立臺灣大學工學院工業工程學研究所 碩士論文
Graduate Institute of Industrial Engineering College of Engineering
National Taiwan University Master Thesis
專利資料分散性與被引用之分佈探究
On the Scattering Distributions of Patent Citation
黃國瑞 Kuo-Jui Huang
指導教授:陳達仁 博士 Advisor: Dar-Zen Chen, Ph.D.
中華民國 97 年 1 月
January, 2008
致謝
或許,我們常說道:「有一得,必有一失」。那麼,如果說我目前所得到的是 人人所稱羨的學位,達到的是人生中該視為有價值的里程碑,對我來說,那或許 失去的是在這求學旅程中無法兼顧的友情。對於這些不斷陪伴著、不曾遺棄我的 朋友們,我要先說聲感謝。
回眸台大求學研究的路途,像是在漫漫森林中摸索出一條生路,以求達到那 另一頭的山巔之處。然而,心中的藍圖清晰可見,往往力行時又似乎伸手而不可 及,一個不注意卻又容易在歧途中打轉,此刻回想起來只能說是滿心驚恐與感恩。
首先感謝陳達仁老師在我陷入歧途之時,像太陽一般指引著正確的方位,雖說沿 途峰迴路轉,至山窮水盡疑無路之時,在您的指導之下總是能夠發現柳暗花明的 那一村,這讓我真正體驗到第一學府的研究精神—不懈與精進!另外,也感謝在 旅途陷入黑夜膠著中,即時出現的兩盞明燈—黃慕萱老師和林正平老師。感謝黃 老師在圖書資訊領域的相關指導,您溫柔與和藹的氣質也是鼓勵我的一個動力;
而林老師總是像我們的課後輔導老師,永遠是那樣認真與耐心地提供我們許多研 究建議。而在同袍中,第一感謝的當然一起共禦外敵,相互砥礪兩年之久的正宇,
還要謝謝你常常叫我起床還忍受我愛遲到的毛病。第二感謝的是程式達人-邱 排,雖然你看起來大我兩三歲,但要不是論文封面有格式限制我早就把你放在友 情客串了!研究室的好伙伴:又菁、博揚、凱安、雞雞怡,阿宅、游小游、軍師 馬爺、和電梯之王喜德龍,我永遠都不會忘記這段友誼。
感謝所辦之:MO 媽、淑云、琍文、相怡四大美女,還有一路相陪的工工所每 一位學長姊及學弟妹,無論在生活與課業都給予相當的鼓勵與幫助,這一段也更 豐富了我在台大的美好記憶。
最後,也特別感謝我的女友林小妤,不僅完整了我最後的求學生涯,也填補 了那塊心靈最重要的缺,這也是讓我堅持到最後一刻的力量。
黃國瑞 2008/01 於台灣大學 IAID 實驗室
摘要
本研究目的乃在於設定一個專利分類準則,用以辨別專利的重要性與價值。
其中,書目計量學(Bibliometrics)之布萊德福法則(Bradford’s Law)提供了一個實證 方法,本研究得以藉此法則探索此種分類法則,同時亦發現在專利被引用(forward citation)資料中,存在了一個不均勻分佈(unequal distribution)。此外,藉由三個產 業的實證研究當中,也發現了專利被引用資料的分佈中存在葛羅斯偏垂(Groos droop)現象,如同書目計量研究,說明了專利被引用中亦有大量專利鮮少被引用的 狀況。
專利資料的分散現象在本研究中,藉由圖形發展來探究其成長現象。更進一 步地,藉由計量性的探討,基於布萊德福法則下將各產業專利資料分區,並在各 產業中進行比較,發現本研究之三個產業專利被引用分佈,具有相同的成長分佈。
最後,本研究亦提出相關的管理意涵,建議公司應專注於自身落在專利分區 的第一區專利技術,因其具有相對的發展價值。而建議未來研究方向,則應該專 注於這些較具有價值性的專利資料。此外,後續相關於專利之研究變數,也建議 參考本研究之專利價值分類準則。而布萊德福法則亦可作為專利資料的整體技術 管理方法。
關鍵字:書目計量學、布萊德福法則、專利被引用、不均勻分佈、葛羅斯偏垂
Abstract
The objective of this research is to set up a criterion for classifying the patents by their importance and value. Bradford’s law provided a practical method for us to find this criterion and verified the unequal distribution of patent data related to forward citation. Groos droop was also verified which presented in the industries studies that revealed there would be a rule of higher number of patents containing fewer forward citations.
The meaning of patent data scattering was also deeply elaborated and illustrated in some growing patterns. Based on more numerical discussion, it was more precisely depicted that how the distributions in several zones of patent data grew which Bradford was mentioned in the industrial studies. Meanwhile, the comparative discussions on the patent data distributions of three industries were also verified that there would be the similar trends among them.
The managerial implication was discussed in the study as well. It was emphasized that a firm should have more of the patent belonged to the first zone and make effort to focus on the development of the relative technology. The future works were supposed that using the valuable patents, the first zone’s patents, was more meaningful than the numerical count of all the patents. Therefore, the other studies about the prediction of firm’s performance could modify the independent variable according the criterion made from Bradford. Besides, taking the entire firm’s granted patents as a Bradford curve to see the overall development pattern was also a technological development method.
Keywords: Bibliometrics, Bradford’s Law, forward citation, unequal distribution, Groos droop
Contents
List of Figures ...v
List of Tables ...vi
Chapter 1 Introduction ... 1
1.1 Research Background ... 1
1.2 Research Motivation and Objectives... 5
Chapter 2 Determination of the Citation Indicator ... 7
2.1 Backward Citation Indicator - A Backward View ... 7
2.2 Forward Citation Indicator - A Forward View... 7
2.3 Bradford’s Law and Groos Droop ... 8
2.4 Industrial Definition...12
Chapter 3 The Unequal Distribution of Patent Data ... 30
3.1 The Scattering of Patent Data... 30
3.2 Analysis on Patent Forward Citation Numbers-into Three Zones ... 32
3.3 Analysis on Patent Forward Citation Proportionalities-into Three Zones....35
3.4 Analysis on Patent Forward Citation Numbers-into Four Zones ... 36
3.5 Analysis on Patent Forward Citation Proportionalities-into Four Zones ... 39
3.6 Analysis on Patent Forward Citation Numbers-into Five Zones... 40
3.7 Analysis on Patent Forward Citation Proportionalities-into Five Zones... 43
Chapter 4 Analysis on Scattering Pattern of Patents Data... 45
4.1 Growth Pattern by Logarithm View ... 45
4.2 Curve Growth with Logarithmic Scale... 49
4.3 Inflection Behaviors by Groos Droop ...51
4.4 The Trends of Data Distribution on Curve Fitting...53
Chapter 5 Conclusions ...56
List of Figures
Figure 2.1 The Scattering Pattern of Journals with Articles ... 9
Figure 2.2 The Original Bradford Curve with Three Zones ... 11
Figure 2.3 Bradford Curve with Groos Droop... 12
Figure 3.1 The Scattering of Industry... 30
Figure 3.2(a) The Scattering of LD Industry ... 31
Figure 3.2(b) The Scattering of Drug Industry ...31
Figure 3.2(c) The Scattering of Semiconductor Industry ... 32
Figure 4.1 The Bradford Curve with Groos Droop of Industry... 45
Figure 4.2(a) The Bradford Curve of LD Industry ...47
Figure 4.2(b) The Bradford Curve of Drug Industry ... 48
Figure 4.2(c) The Bradford Curve of Semiconductor Industry ... 49
Figure 4.3(a) The Marginal Value after Inflection Point- The LD Industry ... 51
Figure 4.3(b) The Marginal Value after Inflection Point- The Drug Industry ... 51
Figure 4.3(c) The Marginal Value after Inflection Point- The Semiconductor Industry52 Figure 4.4 Curve Fitting on Bradford Curve of Three Industries ... 54
Figure 4.5 Curve Fitting on Patents with Citations of Three Industries ... 55
List of Tables
Table 2.1(a) The Data of LD Industry ... 14
Table 2.1(b) The Data of Drug Industry... 18
Table 2.1(c) The Data of Semiconductor Industry ... 23
Table 3.1(a) The Equal Citations into Three Zones- The LD Industry ... 33
Table 3.1(b) The Equal Citations into Three Zones- The Drug Industry ... 33
Table 3.1(c) The Equal Citations into Three Zones- The Semiconductor Industry ... 33
Table 3.2(a) The Equal Citations into Four Zones- The LD Industry ... 37
Table 3.2(b) The Equal Citations into Four Zones- The Drug Industry ... 37
Table 3.2(c) The Equal Citations into Four Zones- The Semiconductor Industry ... 37
Table 3.3(a) The Equal Citations into Five Zones- The LD Industry ... 41
Table 3.3(b) The Equal Citations into Five Zones- The Drug Industry ... 41
Table 3.3(c) The Equal Citations into Five Zones- The Semiconductor Industry...41
Chapter 1 Introduction
1.1 Research Background
“Knowledge-based economy” was referred to be the combination of information and knowledge, of which “information” means those data which could be read and understood while “knowledge” indicated the accumulation of messages, techniques, and experience done by using knowledge. From the “Organization for Economic Cooperation and Development (OECD)”, “knowledge-based economy” was also referred to be “an economy with the most important output factor which is to own, allocate, produce, and use knowledge resource.” The core knowledge, which contributed most to the competency, was often taken as invisible intellectual property such as technological knowledge. Furthermore, “patent” was used to protect their core technological knowledge by most firms all around the world. Patent is a kind of property right of assignee granted by the government for protecting and developing their invention and competitiveness. Moreover, there is a strong relation between patent and invention, which means with more patents, comes more ability of invention.
Therefore, it is very critical that technology-based organizations can make more competencies by applying for a patent approval in their industries.
For a technology-based organization, continually technology progressing and changing leads to not only disruptions in the industry, but more uncertainties to this organization as well. So an executive manager has to face the change, understand what the most important and related patent information is, and then making timely and right decisions (Kayal & Water, 1999). Additionally, from the definition of European Patent Office, “patent information” is usually considered as the information of technique,
market, law, and all other information relates to its own company from patent office publications. Based on the World Intellectual Property Organization (WIPO) report, patent information is the only document among those technical development data, such as journals, magazines, and encyclopedia that can fully disclose the core technique.
Nowadays, it could be observed that patent specifications contained about 90 to 95 percent of the research and development (R&D) results all over the world, however, 80 percent of them were not yet recorded in other publications. From WIPO investigation, R&D time could be shortened up to 60 percent by using patent information effectively, and consequently the cost in R&D could be cut up to 40 percent. Especially, patent data is the information, which was most frequently used by R&D staffs. Not only could this
stimulate new research directions, but promote new usage of present techniques and predict industrial growth as well.
Recently, patent-based technology indicators have been developed to the elaboration on measuring the technical strengths of firms, industries and countries.
Griliches (1984) was the first person trying to analyze patent data and considering the numbers of granted patents as R&D performance. Also, Griliches (1990) pointed out that using patent information could be the most useful indicator. Choung (1998) also used the patent data to recognize the different technological progress between Taiwan and Korea, then comparing their competitiveness.
Meanwhile, researchers started to focus on and to analyze patent data then tried to find some beneficial information. CHI research, Inc., a consulting company had already developed some considerable technical indicators based on patent citation. The patent citation indicators developed so far were included as follows:
z Current Impact Index (CII): CII shows the citation rate of patents in the last five years being cited during the most current period. CII means the owner of the target patents has more competitiveness when CII is greater than 1.0.
Breitzman and Narin (2001) also proposed that a higher citation rate of the patent revealed that the patent was more significant with a higher technological impact.
z Science Linkage (SL): SL shows the number of reference per patent to other scientific publications. The owner of those patents cited a large number of scientific papers possibly appear to work closely with the latest scientific development.
z Technology Cycle Time (TCT): TCT presents “the median age in years of prior patents cited, which provides an indicator of the pace of technological change”. Narin (1993) found that different technological industry had different TCT value and demonstrated “in a fast changing area such as electronics, the cycle time may be as fast as three to five years, whereas in some of the very old technologies such as ship and boat building, the cycle time may be in the 15 to 20 year range. Deng et al., (1999) thought TCT indicator was the “backward looking and industry dependent” indicator, that is, it took advantage of cited patents from a given patent to calculate the given patent’s TCT value, and the value from different industries represent unlike value.
We can identify characteristics in a group of patents to measure patent quality by seeing patent citation. It can also establish linkages between patent documents. Patent citation was also recognized as the technology flow or change and R&D spillover. One
patent cited another patent means the knowledge or technology contained in a patent was transited to the other patent. Jaff et al., (1992) conducted a research of the extent to which knowledge spillovers were geographically localized by comparing the geographic location of patent citations to those of the cited patents.
Furthermore, researchers also take advantage of patent citation to analyze corporate competitiveness, technology life cycle, competitor analysis, and predict industrial growth. Tomas et al., (2001) also used TCT indicator and other technological indicators as a patent portfolio to measure and predict future stock market performance of a company, and finally they found this investment model did better than the Standard and Poor’s (S&P) 500 indexes. Moreover, Pouris (2005) conducted a study to detect the performance of transport research in South Africa and finally observed that research performance of South Africa was relatively well when comparing with other Africa countries, but did very weak comparing with other countries, like Great Britain, Australia, and South Korea and so on. Three main usages in patent citations were proposed by Gay and Le Bas in 2005: (1) Patent citations were used as a measurement of the value of technological inventions; (2) Patent citations were used as a measurement of the origins or the “knowledge base” of inventions; and (3) Patent citations were used as an evaluation of technological knowledge flows.
In recent years, the number of issued patents is growing rapidly, but some of them are useful and valuable while others are not. Valuable patents that contain crucial technology can often help firms to produce more research outcomes and result in more profit to the entire organization. However, less valuable patents have no practical usage and would be disregarded quickly. Therefore, if a criterion could be set up for helping sieving out what valuable patents are, then furthermore we can just spend time to focus
save more resource. It would be a great contribution to many researchers in carrying out patent analysis. Therefore, it’s very useful to find the criterion of recognizing the important and valuable patents.
1.2 Research Motivation and Objectives
In the Bibliometrics, Bradford (1934) revealed the phenomenon of some science journals containing many articles relative to the corresponding specific subject, but other journals were not. He supposed that not every library could afford the great cost to have many of the journals, but it could be more economically for a library just to store the valuable journals which contained the considerable articles. He started his research upon this background and tried to build up a criterion to classify some journals which were valuable and considerable in order to apply to the management in library. Then the unequal distribution was clearly analyzed by other researchers and gradually became a strict principle. Consequently, it was truly a justifiable theory with influence.
Nonetheless, this phenomenon of unequal scattering reappeared in the distribution of patent citation. For several reasons, there were some patents frequently cited by many other patents, but some were not and even never been cited. Thus, there would be a motivation about how the performance and distribution of patent citation were.
Especially, by using Bradford’s law might be more easily, logically and precisely to find out these phenomena of unequal distribution and to come up with an explicit criterion which could define the valuable and considerable patents, of which we assume the patent was cited frequently, meant it had a very important and future influence to the specific technology. Therefore Bradford’s law also might be firstly depicted and verified in the patent field, it would be a significant research contribution to the study of
relationship between bibliometrics and patent fields, and it might be more economically in the management of patents.
At the same time, it was also assumed that there would be a “multiplier relation”
among the three zones’ number of patents in Bradford’s research. However, it was supposed that there would be a stable proportional relation among the three-zone results in the study. Furthermore, it was assumed that the stable proportional relations would be changed and had different proportional results when the more zones were elaborated, as the three zones might not be the “perfect” separation. Thus, it was firstly deeply discussed the unequal distribution of patent data into three, four, and five zones in terms of “multiplier” and “proportion” relations.
In addition, the comparative discussion about how the different industries’ data distributions would be is also studied in the following sections.
Chapter 2 Determination of the Citation Indicator
2.1 Backward Citation Indicator - A Backward View
Analysis of citations to prior patents on the targeted patent is called “backward citation”. Ashton & Sen (1988) pointed out that “citations to a previous patent represent
evidence that current state-of-the-art developments are related to or were derived from the earlier inventions”. Backward citation analysis is based on the “indirect
information” characteristics, that is, we measure the target patent by the term of its backward citation. But this could only reflect the “passed performance” of those patent owners (firms, industries, or countries) but not their future influence trend. In the other words, backward citation indicator belongs to the “static information” because the value of a fixed year’s data would not be update. Kayal and Water (1999) conducted an empirical evaluation by using TCT indicator to analyze the patent data of superconductor industry from 1974 to 1994, and tried to prove the validity of TCT. The obstacle was that we could not use TCT to predict the future performance of superconductor industry future performance. There would be a bias that we use the backward citation indicator to depict what the patent will perform. However, what we really care is the patents’ future performance and impact to the technology environment.2.2 Forward Citation Indicator - A Forward View
Analysis of citations on the targeted patent by subsequent patents is called
“forward citation”. Forward citation analysis is based on the “direct information”
characteristics, that is, we measure the target patent by the term of its forward citation.
In fact, forward citation indicator belongs to the “dynamic information” because the
value of a fixed year’s data would be updated constantly year by year. It is valuable to find out patent’s attribute by means of evaluating citations per patent, which was cited by others (forward citation). The assumption was that patent been cited frequently meant it was worthy to be referred and had future influence to the specific technology in terms of the concept of spillover. A patent with higher number of forward citations could be regard as having higher impact to the corresponding technology and industry.
Thus, results from patent citation analysis are important for forecasting future technology development, and that means the trends of market development can be accurately evaluated by patent information. Trajtenberg (1989) considered that the intensity of forward citations to a group of patents in subsequent patents had highly relation with the social gains from the target patents. Hall et al., (1998) considered an event that the intensity of forward citations of firm’s patents was contemporaneously had highly relation with their performance of market values. Moreover, Hall and Trajtenberg (2004) elaborated on the generality and impact of patents through the concept of probability in patent citation. Haupt et al., (2007) also conducted a research containing the method of forward citation to analyze the technology life cycle stages development.
2.3 Bradford’s Law and Groos Droop
Recently, the research on literatures in library and information science had led to a large number of bibliometrics studies. Bradford (1934) found the distribution of literature was the objective phenomenon. Especially, it was common that the science literatures scattered in many different fields, not just in the technological field. Bradford found that some journals with a same specific subject would contain many articles of
articles of which were in fact highly related to the specific subject. Therefore, Bradford assumed that there might be a scattering principle so that it could be helpful for finding the pattern of scattering. Therefore, Bradford also proposed the “principle of the unity of science” to reflect the relation between articles and their references. Besides, Bradford considered that the articles in each bibliography could be divided into three zones, and each zone included an approximately equal number of articles to each other, while the number of journals required producing those articles increased dramatically from one zone to the next.
First, Bradford collected the data of journals with articles from the bibliography on applied geophysics and lubrication. And he depicted the scattering pattern with vertical axis (R (n)) showing the cumulative number of articles and with the horizontal axis (n) showing the cumulative number of journals. We could find that there would be a quite small portion of journals for a large portion of the cumulative number of articles from the origin, and additional journals outside the core contribution relatively few additional articles. The conceptual scatter was illustrated as shown in figure 2.1.
Figure 2.1 The Scattering Pattern of Journals with Articles
Secondly, Bradford found that there would be a linearity relation between “the cumulative number of articles related to the specific object” and “the log value of the cumulative number of journals” in the given object. He then proposed the “law of
R (n)
n
scattering” and depicted the scattering pattern with the vertical axis(R (n)) showing the cumulative number of articles, and the horizontal axis (Log (n)) showing the logarithm value of the cumulative number of journals.
If scientific journals are arranged in the order of descending number of containing articles for a given subject, they may be divided into a nucleus of journals more particularly devote to the specific subject. Simultaneously, the three zones contain nearly the same number of articles as the nucleus. Then the number of journals (Ri, i=1, 2, 3) in the first zone and succeeding zones will be as R1:R2:R3=C (1: r: r2). We denote that “C” is a constant and “r” is the “multiplier”.
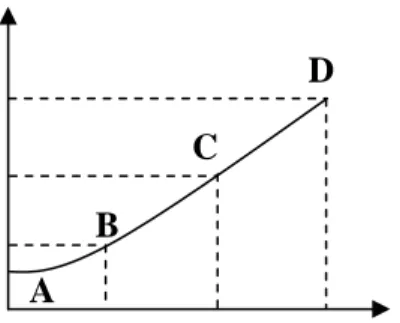
The three zones and their characteristics were described as below and shown as in figure 2.2:
1. First zone (AB):
The number of journals (R1) is the fewest, but it contains the largest number of articles in average, which are related to the specific subject of journals.
2. Second zone (BC)
The number of journals (R2) is fewer, but it contains the larger number of articles in average, which are related to the specific subject of journals.
3. Third zone (CD)
The number of journals (R3) is the highest, but it contains the fewest number of articles in average, which are related to the specific subject of journals.
Figure 2.2 The Original Bradford Curve with Three Zones
In 1948, Vickery first concluded the research of “Bradford’s law of scattering” and named Bradford’s principle as “Bradford’s law” formally. Kendall (1960) and Lawani (1973) also conducted a series of researches to prove the evidence of “Bradford’s law”
so that Bradford’s discovery could be confirmed and being valuable in the bibliometrics studies. Especially, Leimkuhler (1967) revealed a mathematics research to the
“Bradford’s law” and confirmed the law by the descriptions of discussion about three zones. On the other hand, Brookes (1973) also revealed the numerical methods of Bradford’s law and tried to predict the total number of articles by the slope of straight line in the second zone of scattering pattern.
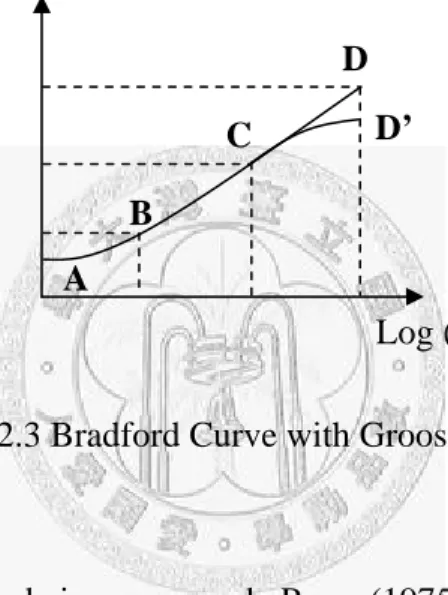
Bradford’s law was successively corrected and proven by many researchers after being proposed. Vickery (1948) revealed the validity of linear view of Bradford. Groos proposed also, “Groos droop” in 1967. He depicted the scattering from Bradford’s law and then found that the line of the third zone might not be linear. On the contrary, there would be “an inflection point” that made the pattern shape became “S” shaped.
Moreover, Groos precisely depicted the growth relation as the following description and figure 2.3:
R3
R2
R1 R (n)
Log (n)
B
C
D
A
1. First zone (AB): The exponential growth leads to a convex curve which has the increasing progressively positive slope.
2. Second zone (BC): The straight linear growth leads to a line with positive slope.
3. Third zone (CD’): The inverse growth leads to a curve which has “an inflection point” so that the positive slope starts decreasing progressively finally and grew as curve CD’, not as curve CD.
Figure 2.3 Bradford Curve with Groos Droop
After Groos’ correction being proposed, Pope (1975) also conducted statistical analysis and then verified the phenomenon of Groos droop, consequently, “standard Bradford’s law” was proposed, too.
2.4 Industrial Definition
In this study, the “specific technology” was focused for building up a formal research upon the “specific subject” in Bibliometrics. It could be generated as a study by using “industry technology” to represent the “specific technology” and then compile all the relative patent data from our industrial definition. Additionally, this study focused on the granted patents all dating from 1986 to 2006.
R (n)
Log (n)
B
C
D
A
D’
The LD industry referenced the industrial definition from the research of discussing the knowledge diffusion in 2002, which conducted by Stolpe. He took the
“LCD industry” as his target researching case and defined “LCD industry” for his research containing all the patents in USPTO class 349, “Liquid crystal cells, elements and systems” in this study. Although Stolpe took the USPTO class 349 as the LCD industry, we took a look at the USPTO class definition and knew the class 349 should be regarded as “LD industry” (since the class 349 didn’t contain the “crystal technology”). The LD industry covered 13,930 granted patents and only 10,550 patents have forward citations, and the total frequency of forward citation was 130,319 (times).
Therefore this study focuses on the patents, which have forward citation, that is, other patents cite them. The highest number of forward citation of patent is 275 times for only one patent, and 1,476 patens have the lowest number of forward citation, that is, 1 time.
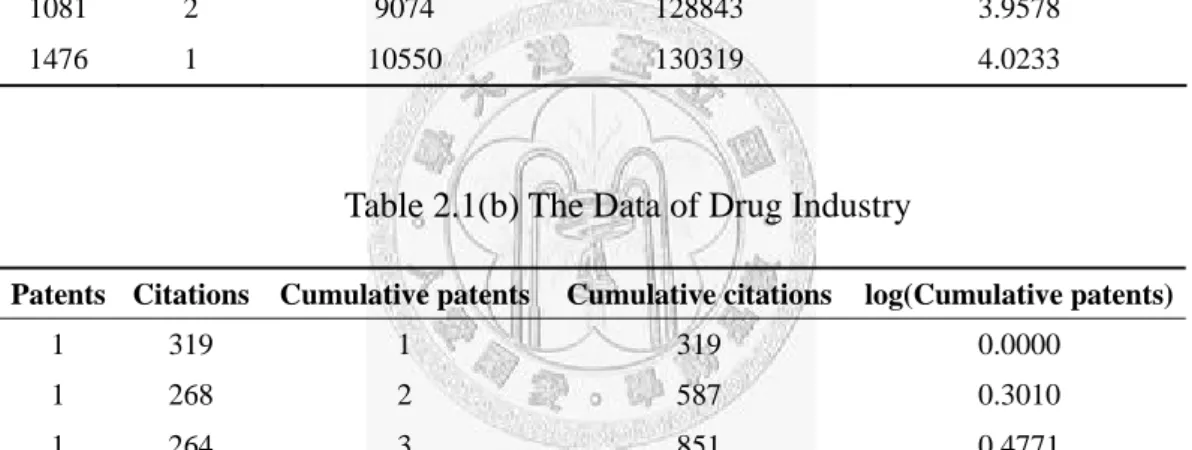
Drug industry has been regarded as highly related to biotechnology industry which has been highly emphasized and discussed lately. We took the definition of drug industry revealed by Hall et al., (2001) and Lichtenberg and Virabhak (2002) who chose all the patents in USPTO class 424 and 514 which are both entitled “Drug, bio-affecting and body treating compositions” as the scope of drug industry. In the drug industry, it covered 136,700 granted patents and only 75,702 patents were cited, and the total frequency of forward citations was 632,457(times). Compiling the effective 75,702 patents, the highest number of forward citation of patent is 319 times for only one patent, and 16,504 patens have the lowest number of forward citation, that is, 1 time.
Semiconductor industry was the large industry and has been highly developed around the world. The scale and scope of semiconductor industry is large and wide, and the applications of semiconductor have been widely scattered to other industries.
Weinstein and Huang (1999) conducted a research about patent analysis in 1999 and
define the semiconductor industry by the patent data of USPTO class 257, 365, and 437 as semiconductor patents. In this research, the class 437 was found that the number of patent was abated and combined into class 438 which is entitled “Semiconductor device manufacturing: process,” so that 437 was replaced by 438 to the definition of semiconductor industry. Hall et al., (2001) also compiled over 400 USPTO classes into 36 subclasses and further aggregated into 6 main categories. In the research, they classified class 257, 326, 438, and 505 as “Semiconductor Devices” patents. Therefore, by referencing the researches done by Weinstein and Huang (1999) and Hall et al.
(2001), the scope of semiconductor industry in this study will be all the patents included in USPTO class 257 entitled “Active solid-state devices (e.g., transistors, solid-state diodes),” 326 entitled “Electronic digital logic circuitry,” 438 entitled “Semiconductor device manufacturing: process,” and 505 entitled “Superconductor technology:
apparatus, material, process.” The semiconductor industry covered 202,985 granted patents that contained 153,569 patents were cited, and the total frequency of forward citations was 1,856,999 (times). Compiling the effective 153,569 patents, the highest number of forward citation of patent is 571 times for only two patents, respectively, and 23,469 patens have the lowest number of forward citation, that is, 1 time. The number of granted patents and the relative forward citation in the three industries were cumulated in order and were listed in table 2.1(a), table 2.1(b), and table 2.1(c), respectively.
Table 2.1(a) The Data of LD Industry
Patents Citations Cumulative patents Cumulative citations log(Cumulative patents)
1 275 1 275 0.0000
1 231 2 506 0.3010
1 203 3 709 0.4771
1 177 4 886 0.6021
1 168 5 1054 0.6990
1 161 6 1215 0.7782 1 156 7 1371 0.8451 2 153 9 1677 0.9542 1 152 10 1829 1.0000 1 151 11 1980 1.0414 1 148 12 2128 1.0792 1 146 13 2274 1.1139 1 142 14 2416 1.1461 2 141 16 2698 1.2041 1 139 17 2837 1.2304 3 137 20 3248 1.3010 1 136 21 3384 1.3222 2 135 23 3654 1.3617 2 134 25 3922 1.3979 1 132 26 4054 1.4150 2 131 28 4316 1.4472 1 130 29 4446 1.4624 1 129 30 4575 1.4771 1 126 31 4701 1.4914 1 125 32 4826 1.5051 1 122 33 4948 1.5185 2 120 35 5188 1.5441 1 119 36 5307 1.5563 1 117 37 5424 1.5682 3 116 40 5772 1.6021 1 114 41 5886 1.6128 1 112 42 5998 1.6232 2 111 44 6220 1.6435 1 110 45 6330 1.6532 2 108 47 6546 1.6721 1 107 48 6653 1.6812 2 106 50 6865 1.6990 1 105 51 6970 1.7076 2 104 53 7178 1.7243 1 103 54 7281 1.7324 4 102 58 7689 1.7634 2 101 60 7891 1.7782 2 100 62 8091 1.7924 3 99 65 8388 1.8129 3 98 68 8682 1.8325
1 97 69 8779 1.8388 5 96 74 9259 1.8692 2 95 76 9449 1.8808 6 94 82 10013 1.9138 1 93 83 10106 1.9191 2 92 85 10290 1.9294 1 91 86 10381 1.9345 3 90 89 10651 1.9494 3 89 92 10918 1.9638 1 88 93 11006 1.9685 1 87 94 11093 1.9731 4 86 98 11437 1.9912 1 85 99 11522 1.9956 2 84 101 11690 2.0043 3 83 104 11939 2.0170 5 82 109 12349 2.0374 2 81 111 12511 2.0453 2 80 113 12671 2.0531 3 79 116 12908 2.0645 4 78 120 13220 2.0792 9 77 129 13913 2.1106 7 76 136 14445 2.1335 7 75 143 14970 2.1553 8 74 151 15562 2.1790 4 73 155 15854 2.1903 11 72 166 16646 2.2201
5 71 171 17001 2.2330 7 70 178 17491 2.2504 6 69 184 17905 2.2648 8 68 192 18449 2.2833 11 67 203 19186 2.3075
9 66 212 19780 2.3263 4 65 216 20040 2.3345 9 64 225 20616 2.3522 9 63 234 21183 2.3692 10 62 244 21803 2.3874
8 61 252 22291 2.4014 9 60 261 22831 2.4166 9 59 270 23362 2.4314 20 58 290 24522 2.4624
12 57 302 25206 2.4800 13 56 315 25934 2.4983 17 55 332 26869 2.5211 15 54 347 27679 2.5403 18 53 365 28633 2.5623 28 52 393 30089 2.5944 12 51 405 30701 2.6075 12 50 417 31301 2.6201 21 49 438 32330 2.6415 16 48 454 33098 2.6571 18 47 472 33944 2.6739 22 46 494 34956 2.6937 23 45 517 35991 2.7135 24 44 541 37047 2.7332 21 43 562 37950 2.7497 23 42 585 38916 2.7672 29 41 614 40105 2.7882 26 40 640 41145 2.8062 42 39 682 42783 2.8338 32 38 714 43999 2.8537 31 37 745 45146 2.8722 41 36 786 46622 2.8954 46 35 832 48232 2.9201 44 34 876 49728 2.9425 39 33 915 51015 2.9614 39 32 954 52263 2.9795 52 31 1006 53875 3.0026 53 30 1059 55465 3.0249 64 29 1123 57321 3.0504 57 28 1180 58917 3.0719 63 27 1243 60618 3.0945 64 26 1307 62282 3.1163 99 25 1406 64757 3.1480 80 24 1486 66677 3.1720 93 23 1579 68816 3.1984 111 22 1690 71258 3.2279 125 21 1815 73883 3.2589 125 20 1940 76383 3.2878 127 19 2067 78796 3.3153 130 18 2197 81136 3.3418
159 17 2356 83839 3.3722 177 16 2533 86671 3.4036 209 15 2742 89806 3.4381 173 14 2915 92228 3.4646 248 13 3163 95452 3.5001 256 12 3419 98524 3.5339 306 11 3725 101890 3.5711 332 10 4057 105210 3.6082 357 9 4414 108423 3.6448 431 8 4845 111871 3.6853 484 7 5329 115259 3.7266 499 6 5828 118253 3.7655 623 5 6451 121368 3.8096 687 4 7138 124116 3.8536 855 3 7993 126681 3.9027 1081 2 9074 128843 3.9578 1476 1 10550 130319 4.0233
Table 2.1(b) The Data of Drug Industry
Patents Citations Cumulative patents Cumulative citations log(Cumulative patents)
1 319 1 319 0.0000
1 268 2 587 0.3010
1 264 3 851 0.4771
1 235 4 1086 0.6021 1 226 5 1312 0.6990 1 219 6 1531 0.7782 1 218 7 1749 0.8451 1 216 8 1965 0.9031 1 209 9 2174 0.9542 1 207 10 2381 1.0000 1 202 11 2583 1.0414 1 201 12 2784 1.0792 1 195 13 2979 1.1139 1 194 14 3173 1.1461 1 193 15 3366 1.1761 2 192 17 3750 1.2304 1 189 18 3939 1.2553 1 186 19 4125 1.2788
1 184 21 4494 1.3222 1 182 22 4676 1.3424 1 180 23 4856 1.3617 1 178 24 5034 1.3802 1 177 25 5211 1.3979 1 175 26 5386 1.4150 1 174 27 5560 1.4314 1 173 28 5733 1.4472 1 172 29 5905 1.4624 1 170 30 6075 1.4771 1 169 31 6244 1.4914 1 168 32 6412 1.5051 1 165 33 6577 1.5185 1 164 34 6741 1.5315 1 163 35 6904 1.5441 2 161 37 7226 1.5682 1 160 38 7386 1.5798 1 158 39 7544 1.5911 1 157 40 7701 1.6021 2 156 42 8013 1.6232 1 155 43 8168 1.6335 2 153 45 8474 1.6532 1 152 46 8626 1.6628 1 151 47 8777 1.6721 1 150 48 8927 1.6812 2 149 50 9225 1.6990 2 148 52 9521 1.7160 2 147 54 9815 1.7324 4 146 58 10399 1.7634 4 145 62 10979 1.7924 3 144 65 11411 1.8129 3 143 68 11840 1.8325 2 142 70 12124 1.8451 2 141 72 12406 1.8573 3 140 75 12826 1.8751 2 138 77 13102 1.8865 1 136 78 13238 1.8921 3 135 81 13643 1.9085 1 134 82 13777 1.9138 2 133 84 14043 1.9243
4 132 88 14571 1.9445 1 131 89 14702 1.9494 2 130 91 14962 1.9590 4 128 95 15474 1.9777 3 127 98 15855 1.9912 6 126 104 16611 2.0170 4 125 108 17111 2.0334 10 123 118 18341 2.0719
2 122 120 18585 2.0792 2 121 122 18827 2.0864 7 120 129 19667 2.1106 5 119 134 20262 2.1271 5 118 139 20852 2.1430 7 117 146 21671 2.1644 2 116 148 21903 2.1703 5 115 153 22478 2.1847 5 114 158 23048 2.1987 8 113 166 23952 2.2201 3 112 169 24288 2.2279 1 111 170 24399 2.2304 10 110 180 25499 2.2553
5 109 185 26044 2.2672 4 108 189 26476 2.2765 10 107 199 27546 2.2989
5 106 204 28076 2.3096 5 105 209 28601 2.3201 2 104 211 28809 2.3243 7 103 218 29530 2.3385 4 102 222 29938 2.3464 4 101 226 30342 2.3541 5 100 231 30842 2.3636 8 99 239 31634 2.3784 9 98 248 32516 2.3945 9 97 257 33389 2.4099 6 96 263 33965 2.4200 7 95 270 34630 2.4314 8 94 278 35382 2.4440 9 93 287 36219 2.4579 9 92 296 37047 2.4713 7 91 303 37684 2.4814
10 90 313 38584 2.4955 14 89 327 39830 2.5145 8 88 335 40534 2.5250 14 87 349 41752 2.5428 15 86 364 43042 2.5611 11 85 375 43977 2.5740 14 84 389 45153 2.5899 5 83 394 45568 2.5955 16 82 410 46880 2.6128 16 81 426 48176 2.6294 19 80 445 49696 2.6484 16 79 461 50960 2.6637 19 78 480 52442 2.6812 17 77 497 53751 2.6964 17 76 514 55043 2.7110 32 75 546 57443 2.7372 16 74 562 58627 2.7497 15 73 577 59722 2.7612 18 72 595 61018 2.7745 21 71 616 62509 2.7896 33 70 649 64819 2.8122 24 69 673 66475 2.8280 21 68 694 67903 2.8414 24 67 718 69511 2.8561 30 66 748 71491 2.8739 41 65 789 74156 2.8971 23 64 812 75628 2.9096 33 63 845 77707 2.9269 30 62 875 79567 2.9420 29 61 904 81336 2.9562 32 60 936 83256 2.9713 36 59 972 85380 2.9877 45 58 1017 87990 3.0073 43 57 1060 90441 3.0253 47 56 1107 93073 3.0441 52 55 1159 95933 3.0641 48 54 1207 98525 3.0817 46 53 1253 100963 3.0980 57 52 1310 103927 3.1173 56 51 1366 106783 3.1355
51 50 1417 109333 3.1514 57 49 1474 112126 3.1685 54 48 1528 114718 3.1841 53 47 1581 117209 3.1989 64 46 1645 120153 3.2162 71 45 1716 123348 3.2345 92 44 1808 127396 3.2572 95 43 1903 131481 3.2794 99 42 2002 135639 3.3015 82 41 2084 139001 3.3189 106 40 2190 143241 3.3404 113 39 2303 147648 3.3623 114 38 2417 151980 3.3833 123 37 2540 156531 3.4048 142 36 2682 161643 3.4285 174 35 2856 167733 3.4558 167 34 3023 173411 3.4804 157 33 3180 178592 3.5024 216 32 3396 185504 3.5310 219 31 3615 192293 3.5581 221 30 3836 198923 3.5839 249 29 4085 206144 3.6112 293 28 4378 214348 3.6413 280 27 4658 221908 3.6682 316 26 4974 230124 3.6967 323 25 5297 238199 3.7240 411 24 5708 248063 3.7565 461 23 6169 258666 3.7902 491 22 6660 269468 3.8235 511 21 7171 280199 3.8556 587 20 7758 291939 3.8897 598 19 8356 303301 3.9220 723 18 9079 316315 3.9580 815 17 9894 330170 3.9954 855 16 10749 343850 4.0314 985 15 11734 358625 4.0694 1093 14 12827 373927 4.1081 1195 13 14022 389462 4.1468 1399 12 15421 406250 4.1881 1532 11 16953 423102 4.2292
1833 10 18786 441432 4.2738 2159 9 20945 460863 4.3211 2523 8 23468 481047 4.3705 2996 7 26464 502019 4.4227 3758 6 30222 524567 4.4803 4559 5 34781 547362 4.5413 5994 4 40775 571338 4.6104 7769 3 48544 594645 4.6861 10654 2 59198 615953 4.7723 16504 1 75702 632457 4.8791
Table 2.1(c) The Data of Semiconductor Industry
Patents Citations Cumulative patents Cumulative citations log(Cumulative patents) 2 571 2 1142 0.3010 1 463 3 1605 0.4771 1 415 4 2020 0.6021 1 406 5 2426 0.6990 1 365 6 2791 0.7782 1 364 7 3155 0.8451 1 361 8 3516 0.9031 2 360 10 4236 1.0000 1 358 11 4594 1.0414 2 357 13 5308 1.1139 1 349 14 5657 1.1461 1 346 15 6003 1.1761 1 337 16 6340 1.2041 2 335 18 7010 1.2553 1 334 19 7344 1.2788 1 330 20 7674 1.3010 1 328 21 8002 1.3222 1 318 22 8320 1.3424 2 317 24 8954 1.3802 1 315 25 9269 1.3979 2 309 27 9887 1.4314 1 306 28 10193 1.4472 1 296 29 10489 1.4624 1 292 30 10781 1.4771 2 290 32 11361 1.5051 2 286 34 11933 1.5315
1 285 35 12218 1.5441 2 278 37 12774 1.5682 1 277 38 13051 1.5798 2 275 40 13601 1.6021 1 271 41 13872 1.6128 1 264 42 14136 1.6232 1 262 43 14398 1.6335 2 261 45 14920 1.6532 1 260 46 15180 1.6628 1 258 47 15438 1.6721 2 244 49 15926 1.6902 2 242 51 16410 1.7076 2 239 53 16888 1.7243 3 238 56 17602 1.7482 4 236 60 18546 1.7782 2 235 62 19016 1.7924 2 234 64 19484 1.8062 1 233 65 19717 1.8129 1 231 66 19948 1.8195 1 225 67 20173 1.8261 2 222 69 20617 1.8388 5 221 74 21722 1.8692 1 219 75 21941 1.8751 3 218 78 22595 1.8921 6 217 84 23897 1.9243 1 216 85 24113 1.9294 3 214 88 24755 1.9445 1 213 89 24968 1.9494 2 212 91 25392 1.9590 6 211 97 26658 1.9868 2 210 99 27078 1.9956 1 209 100 27287 2.0000 3 208 103 27911 2.0128 1 205 104 28116 2.0170 3 204 107 28728 2.0294 1 202 108 28930 2.0334 4 201 112 29734 2.0492 2 199 114 30132 2.0569 2 197 116 30526 2.0645 1 196 117 30722 2.0682
1 195 118 30917 2.0719 4 194 122 31693 2.0864 3 193 125 32272 2.0969 4 191 129 33036 2.1106 4 190 133 33796 2.1239 5 189 138 34741 2.1399 2 188 140 35117 2.1461 5 187 145 36052 2.1614 4 186 149 36796 2.1732 4 185 153 37536 2.1847 5 184 158 38456 2.1987 1 183 159 38639 2.2014 2 182 161 39003 2.2068 7 181 168 40270 2.2253 2 180 170 40630 2.2304 2 179 172 40988 2.2355 2 178 174 41344 2.2405 7 177 181 42583 2.2577 2 176 183 42935 2.2625 4 175 187 43635 2.2718 3 174 190 44157 2.2788 1 173 191 44330 2.2810 4 172 195 45018 2.2900 4 171 199 45702 2.2989 3 170 202 46212 2.3054 7 168 209 47388 2.3201 5 167 214 48223 2.3304 5 166 219 49053 2.3404 6 165 225 50043 2.3522 7 163 232 51184 2.3655 2 162 234 51508 2.3692 6 161 240 52474 2.3802 9 160 249 53914 2.3962 1 159 250 54073 2.3979 8 158 258 55337 2.4116 3 157 261 55808 2.4166 14 156 275 57992 2.4393
7 155 282 59077 2.4502 6 154 288 60001 2.4594 7 153 295 61072 2.4698
3 152 298 61528 2.4742 8 151 306 62736 2.4857 10 150 316 64236 2.4997
4 149 320 64832 2.5051 10 148 330 66312 2.5185
3 147 333 66753 2.5224 5 146 338 67483 2.5289 9 145 347 68788 2.5403 10 144 357 70228 2.5527
6 143 363 71086 2.5599 13 142 376 72932 2.5752
5 141 381 73637 2.5809 6 140 387 74477 2.5877 13 139 400 76284 2.6021
7 138 407 77250 2.6096 8 137 415 78346 2.6180 12 136 427 79978 2.6304
9 135 436 81193 2.6395 12 134 448 82801 2.6513
6 133 454 83599 2.6571 17 132 471 85843 2.6730 18 131 489 88201 2.6893 11 130 500 89631 2.6990 19 129 519 92082 2.7152 11 128 530 93490 2.7243 19 127 549 95903 2.7396 11 126 560 97289 2.7482 12 125 572 98789 2.7574 11 124 583 100153 2.7657 6 123 589 100891 2.7701 15 122 604 102721 2.7810 21 121 625 105262 2.7959 22 120 647 107902 2.8109 17 119 664 109925 2.8222 16 118 680 111813 2.8325 13 117 693 113334 2.8407 23 116 716 116002 2.8549 19 115 735 118187 2.8663 26 114 761 121151 2.8814 18 113 779 123185 2.8915
20 112 799 125425 2.9025 14 111 813 126979 2.9101 28 110 841 130059 2.9248 24 109 865 132675 2.9370 17 108 882 134511 2.9455 15 107 897 136116 2.9528 26 106 923 138872 2.9652 23 105 946 141287 2.9759 29 104 975 144303 2.9890 22 103 997 146569 2.9987 29 102 1026 149527 3.0111 25 101 1051 152052 3.0216 29 100 1080 154952 3.0334 22 99 1102 157130 3.0422 32 98 1134 160266 3.0546 43 97 1177 164437 3.0708 32 96 1209 167509 3.0824 42 95 1251 171499 3.0973 19 94 1270 173285 3.1038 39 93 1309 176912 3.1169 46 92 1355 181144 3.1319 25 91 1380 183419 3.1399 53 90 1433 188189 3.1562 45 89 1478 192194 3.1697 45 88 1523 196154 3.1827 45 87 1568 200069 3.1953 53 86 1621 204627 3.2098 45 85 1666 208452 3.2217 48 84 1714 212484 3.2340 67 83 1781 218045 3.2507 47 82 1828 221899 3.2620 72 81 1900 227731 3.2788 62 80 1962 232691 3.2927 66 79 2028 237905 3.3071 39 78 2067 240947 3.3153 85 77 2152 247492 3.3328 63 76 2215 252280 3.3454 81 75 2296 258355 3.3610 82 74 2378 264423 3.3762 62 73 2440 268949 3.3874
77 72 2517 274493 3.4009 91 71 2608 280954 3.4163 103 70 2711 288164 3.4331 131 69 2842 297203 3.4536 105 68 2947 304343 3.4694 120 67 3067 312383 3.4867 92 66 3159 318455 3.4995 121 65 3280 326320 3.5159 139 64 3419 335216 3.5339 129 63 3548 343343 3.5500 142 62 3690 352147 3.5670 125 61 3815 359772 3.5815 120 60 3935 366972 3.5949 146 59 4081 375586 3.6108 157 58 4238 384692 3.6272 167 57 4405 394211 3.6439 174 56 4579 403955 3.6608 165 55 4744 413030 3.6761 184 54 4928 422966 3.6927 201 53 5129 433619 3.7100 203 52 5332 444175 3.7269 191 51 5523 453916 3.7422 251 50 5774 466466 3.7615 292 49 6066 480774 3.7829 277 48 6343 494070 3.8023 258 47 6601 506196 3.8196 275 46 6876 518846 3.8373 295 45 7171 532121 3.8556 309 44 7480 545717 3.8739 299 43 7779 558574 3.8909 363 42 8142 573820 3.9107 377 41 8519 589277 3.9304 422 40 8941 606157 3.9514 450 39 9391 623707 3.9727 461 38 9852 641225 3.9935 466 37 10318 658467 4.0136 488 36 10806 676035 4.0337 557 35 11363 695530 4.0555 621 34 11984 716644 4.0786 633 33 12617 737533 4.1010
568 32 13185 755709 4.1201 720 31 13905 778029 4.1432 739 30 14644 800199 4.1657 820 29 15464 823979 4.1893 823 28 16287 847023 4.2118 991 27 17278 873780 4.2375 1097 26 18375 902302 4.2642 1046 25 19421 928452 4.2883 1238 24 20659 958164 4.3151 1319 23 21978 988501 4.3420 1543 22 23521 1022447 4.3715 1534 21 25055 1054661 4.3989 1742 20 26797 1089501 4.4281 1840 19 28637 1124461 4.4569 2026 18 30663 1160929 4.4866 2206 17 32869 1198431 4.5168 2286 16 35155 1235007 4.5460 2690 15 37845 1275357 4.5780 2888 14 40733 1315789 4.6099 3208 13 43941 1357493 4.6429 3684 12 47625 1401701 4.6778 3969 11 51594 1445360 4.7126 4517 10 56111 1490530 4.7490 5189 9 61300 1537231 4.7875 5814 8 67114 1583743 4.8268 6427 7 73541 1628732 4.8665 7717 6 81258 1675034 4.9099 8888 5 90146 1719474 4.9549 10492 4 100638 1761442 5.0028 13110 3 113748 1800772 5.0559 16379 2 130127 1833530 5.1144 23469 1 153596 1856999 5.1864
Chapter 3 The Unequal Distribution of Patent Data
3.1 The Scattering of Patents Data
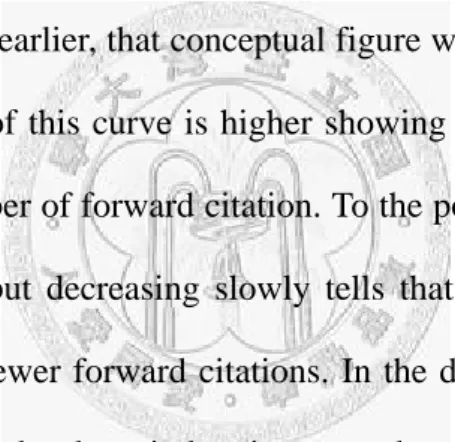
Before the discussion of separations, the scattering of patents data was describing first. Then the pattern of the scattering of each industry was drawn with cumulative citations (vertical axis) and cumulative patents (horizontal axis). From the pattern, the observation of how the cumulative of patents and forward citations growth would be is clear. If there would be a phenomenon of which “fewer number of patent containing larger number of forward citation” likes the state of journals from the research in the bibilometric field discussed earlier, that conceptual figure would be shown in figure 3.1.
From the origin, the slope of this curve is higher showing the fact that less number of patents reaches higher number of forward citation. To the posterior portion, the slope of this curve is still positive but decreasing slowly tells that there is a large number of patents contain fewer and fewer forward citations. In the discussion, it was also found the unequal distributions in the three industries were the same as Bradford’s studying results. In statistics, it is a disproportionate distribution that exists the different and valuable characteristics to be discussed furthermore.
Figure 3.1 The Scattering of Industry
Cumulative citations
Cumulative patents
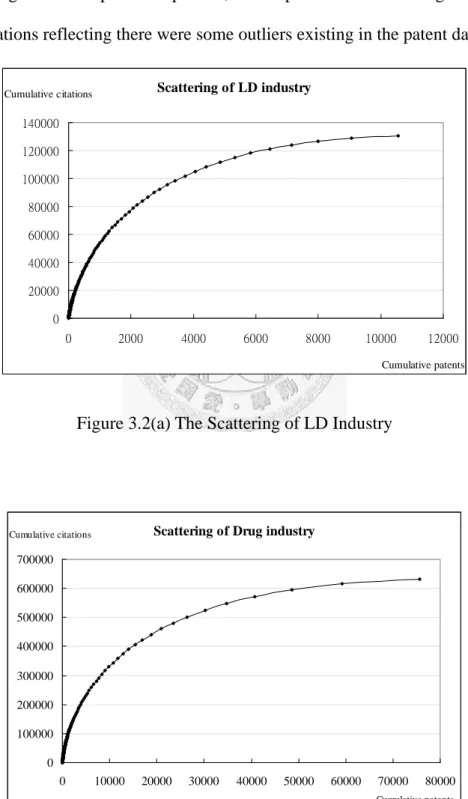
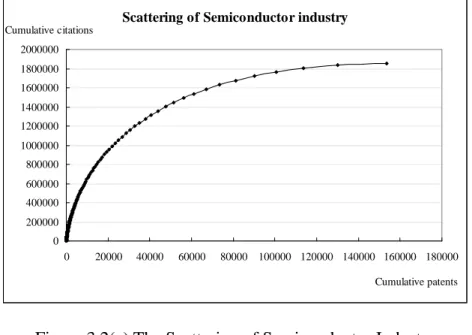
The scattering patterns of three industries were illustrated in figure 3.2(a), figure 3.2(b) and figure 3.2(c) by the patent data in table 2.1(a), table 2.1(b) and table 2.1(c), respectively. There would be a similar pattern in the three industries with a gradually decreasing slope meant a higher number of patents containing fewer forward citations from the origin. To the posterior portion, fewer patents contained higher number of forward citations reflecting there were some outliers existing in the patent data.
Scattering of LD industry
0 20000 40000 60000 80000 100000 120000 140000
0 2000 4000 6000 8000 10000 12000
Cumulative patents Cumulative citations
Figure 3.2(a) The Scattering of LD Industry
Scattering of Drug industry
0 100000 200000 300000 400000 500000 600000 700000
0 10000 20000 30000 40000 50000 60000 70000 80000
Cumulative patents Cumulative citations
Figure 3.2(b) The Scattering of Drug Industry
Scattering of Semiconductor industry
0 200000 400000 600000 800000 1000000 1200000 1400000 1600000 1800000 2000000
0 20000 40000 60000 80000 100000 120000 140000 160000 180000 Cumulative patents Cumulative citations
Figure 3.2(c) The Scattering of Semiconductor Industry
3.2 Analysis on Patent Forward Citation Numbers – into Three Zones
It was also tried to use the number of granted patents (which have forward citation) and their forward citations that parallel the science journals and the containing articles according to the Bradford’s studying method. Patents are arranged in the order of descending number of forward citation for a given industry so that they would be divided into a zone of patents more particularly devote to the given industry.
Simultaneously, computing and sorting out the three zones containing nearly the same number of forward citations as the nucleus. Then the number of patents (Ri, i=1, 2, 3) in the first zone and succeeding zones will be as R1:R2:R3=C (1: r: r2). We denote that “C”
is the constant and “r” is the “multiplier” as well. With the multiplier it could be expected the number of granted patents between three zones. And from the grouping method, it could be more easily to be found there was a phenomenon that fewer patents have greater number of forward citations, and a higher number of patents containing fewer forward citations. And the data was compiled in the equal citations as the
Table 3.1 The Equal Citations into Three Zones (a) The LD Industry
Zone Citation times
Number of Patents
Percentage of Patents
Cumulative
patents (=n) Log(n) Average of patent to citation First 43999 714 6.77% 714 2.8537 61.62 Second 42672 1819 17.24% 2533 3.4036 23.46 Third 43648 8017 75.99% 10550 4.0233 5.44 Total 130319 10550 100.00%
*n=cumulative patents
(b) The Drug Industry
Zone Citation times
Number of Patents
Percentage of Patents
Cumulative
patents (=n) Log(n) Average of patent to citation First 214348 4378 5.78% 4378 3.6413 48.96 Second 208754 12575 16.61% 12575 4.2292 16.60 Third 209355 58749 77.61% 58749 4.8791 3.56 Total 632457 75702 100.00%
*n=cumulative patents
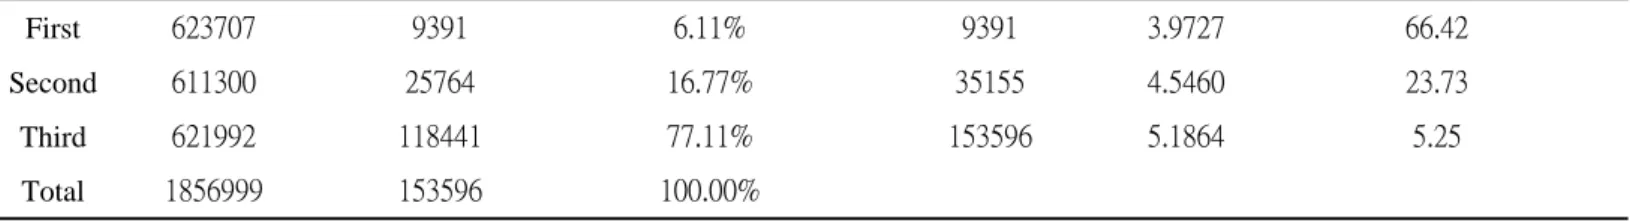
(c) The Semiconductor Industry
Zone Citation times
Number of Patents
Percentage of Patents
Cumulative
patents (=n) Log(n) Average of patent to citation First 623707 9391 6.11% 9391 3.9727 66.42 Second 611300 25764 16.77% 35155 4.5460 23.73 Third 621992 118441 77.11% 153596 5.1864 5.25 Total 1856999 153596 100.00%
*n=cumulative patents
In LD industry, the three zones are compiled into table 3.1 (a) according to the one third of total forward citations that is nearly equal to 43,440 times. Then the numbers of patents (Ri, i=1, 2, 3) in the first zone and succeeding zones are R1:R2:R3=714:1819:8017=714(1:2.55:11.23), of which the constant is C=714. And the
multiplier (r) might be general about 3. Furthermore, the average citation ratios of patent to citation are also computed in each zone. The value of average in the first zone is about 61.62, and then reduced to 23.46 in the second zone, and the value in the third zone is about 5.44. This reveals the phenomenon that the patents in the first zone have relative highly impact and value to the LD technology while the patents from the third zone have relative lowest influence to this specific technology. Besides, the patents in the second zone have a relative influence between the other zones.
In the drug industry, the three zones are compiled into table 3.1 (b) by the one third of total forward citations that is nearly equal to 210,819 times. Then the numbers of
patents (Ri, i=1, 2, 3) in the zones are
R1:R2:R3=4,378:12,571:58,749=4,378(1:2.87:13.42), of which the constant is C=4,378.
And the multiplier (r) might be general about 3, too. Moreover, the average citation ratios of patent to citation are also computed in each zone. The value in the first zone is about 48.96, and then reduced to 16.60 in the second zone, and the value in the third zone is about 3.56. It also tells the phenomenon that the patents in the first zone have relative highly impact and value to a drug technology, like LD industry, and the patents in the third zone have relative lowest influence to this specific technology. In addition, the patents in the second zone have a relative influence between the two zones.
In the semiconductor industry, the three zones are compiled into table 3.1 (c) according to the one third of total forward citations that is nearly equal to 619,000 times.
Then the numbers of patents (Ri, i=1, 2, 3) in the zones are R1:R2:R3=9,391:25,764:118,441=9,391(1:2.74:12.61), of which the constant is C=9,391.
And the multiplier (r) might be general about 3 also. Besides, the average citation ratios of patent to citation are also computed in each zone. The value in the first zone is about 48.96, and then reduced to 16.60 in the second zone, and the value in the third zone is
about 3.56. This reveals the phenomenon also that the patents in the first zone have relative highly impact and value to a drug technology, like LD and drug industry, and the patents from the third zone have relative lowest influence to this technology. In fact, the patents in the second zone have a relative influence between the other zones.
3.3 Analysis on Patent Forward Citation Proportionalities - into Three Zones
Additionally, it was supposed that there should be a proportional conclusion. This would be also easily to expect the number of granted patents by the portions in the three zones. On the other hand, the “marginal productivity” from Economics was also quoted to define that the patent contains more forward citations as a highly marginal productivity patent, which could reveal patent’s importance. The percentages of distribution were shown in table 3.1.
From the results, we can more clearly observe the relative distribution of each number. There would be 6% of granted patents in the first; 16% of granted patents in the second; and there would be about 77% of granted patents in the third. All the three zones’ patents contained the same percentage of 33% about citations. Thus, there would be a relative highly marginal productivity for the patents in the first zone in terms of economics because it cost relative low number of patents reach the same portion of forward citation. However, the patents in the third zone should be less important since it cost much more patents to reach the same portion of forward citation.
A firm with more patents in first zone means it had more core technologies and competences in the specific technology and would be the leader firm of the industry in R&D development. In the contrary, the patents in the third zone was less valuable and could be viewed as almost not yet be cited as their forward citations were just less then
10 times on average and hard to have certain influence. This state might reveal that these patents had no valuable technology and knowledge for developing the specific technology. A firm had more of these unhelpful patents meant it took too much R&D resource devoting to the unimportant technology. Then it could be set up a criterion that the firms or countries should try to add the value of the patents and make effort to have the first-zone-patents because this meant the firm or country had the great influence in a specific technology if they dominate more of the first zone’s patents. It also could be the goal in R&D developing that a firm should reach.
3.4 Analysis on Patent Forward Citation Numbers – into Four Zones
In the section, patents are arranged in the order of descending number of forward citation for a given industry so that they would be divided into a zone of patents more particularly devote to the given industry. Simultaneously, computing and sorting out the four zones containing nearly the same number of forward citations as the nucleus. Then the number of patents (Ri, i=1, 2, 3, 4) in the first zone and succeeding zones will be as R1:R2:R3:R4=C (1: r: r2: r3). We denote that “C” is the constant and “r” is the
“multiplier” as well. With the multiplier it could be expected the number of granted patents between four zones. And from the grouping method, it could be more easily to be found there was a phenomenon that fewer patents have more number of forward citations, and a higher number of patents containing fewer forward citations. And the data was compiled in the equal citation as the following tables.
Table 3.2 The Equal Citations into Four Zones
(a) The LD Industry
Zone Citations Number of Patents
Percentage of Patents
Cumulative
patents (=n) Log(n) Average of patent to citation First 32330 438 4.15% 438 2.6415 73.81 Second 32427 968 9.18% 1406 3.1480 33.50
Third 33767 2013 19.08% 3419 3.5339 16.77 Fourth 31795 7131 67.59% 10550 4.0233 4.46
Total 130319 10550 100.00%
*n=cumulative patents
(b) The Drug Industry
Zone Citation times
Number of Patents
Percentage of Patents
Cumulative
patents (=n) Log(n) Average of patent to citation First 156531 2540 3.36% 2540 3.4048 61.63 Second 159784 6539 8.64% 9079 3.9580 24.44
Third 164732 14389 19.01% 23468 4.3705 11.45 Fourth 151410 52234 69.00% 75702 4.8791 2.90
Total 632457 75702 100.00%
*n=cumulative patents
(c) The Semiconductor Industry
Zone Citation times
Number of Patents
Percentage of Patents
Cumulative
patents (=n) Log(n) Average of patent to citation First 466466 5774 3.76% 5774 3.7615 80.79 Second 461986 13647 8.88% 19421 4.2883 33.85
Third 473249 28204 18.36% 47625 4.6778 16.78 Fourth 455298 105971 68.99% 153596 5.1864 4.30
Total 1856999 153596 100.00%
*n=cumulative patents
In LD industry, the four zones are compiled into table 3.2(a) according to the one fourth of total forward citations that is nearly equal to 32,580 times. Then the numbers of patents (Ri, i=1, 2, 3, 4) in the first zone and succeeding zones are R1:R2:R3:R4=438:968:2013:7131=438(1:2.21:4.60:16.28) which the constant is C=438.
And the multiplier (r) might not be generally computed. Furthermore, the average citation ratio of patent to citation is also computed in each zone. The value in the first zone is about 73.81, and then reduced to 33.50 in the second zone, and the value in the third zone is about 16.77, then 4.46 in the fourth zone. This reveals the phenomenon that the patents in the first zone have relative highly impact and value to a LD technology, and the patents belonged to the fourth zone have relative lowest influence to this technology. It was more obvious that there would be an unequal data distribution after conducting four zones results (comparing to the-three-zones results).
In the drug industry, the four zones are compiled into table 3.2(b) according to the one fourth of total forward citations that is nearly equal to 158,114 times. Then the numbers of patents (Ri, i=1, 2, 3, 4) in the zones are R1:R2:R3:R4=2,540:6,539:14,389:52,234=2,540 (1:2.57:5.66:20.56) which the constant is C=2,540. And the multiplier (r) might not be generally computed, too. Moreover, the average citation ratio of patent to citation is also computed in each zone. The value in the first zone is about 61.63, and then reduces to 24.44 in the second zone, and the value in the third and fourth zone is about 11.45 and 2.90. This also reveals the phenomenon that the patents in the first zone have relative highly impact and value to a drug technology like LD industry, and the patents in the fourth zone have relative lowest influence to this technology.
In the semiconductor industry, the four zones are compiled into table 3.2(c) according to the one fourth of total forward citations that is nearly equal to 464,250
times. Then the numbers of patents (Ri, i=1, 2, 3, 4) in the zones are R1:R2:R3:R4=5,774:13,647:28,204,105,971=5,774(1:2.36:4.88:18.35) which the constant is C=5,774. And the multiplier (r) might not be generally computed. In fact, the average citation ratio of patent to citation is also computed in each zone. The value in the first zone is about 80.79, and then reduced to 33.85 in the second zone, and the value in the third zone is about 16.78 and 4.30 in the fourth zone. This reveals the phenomenon that the patents in the first zone have relative highly impact and value to a drug technology; such as LD and drug industry, and the patents belonged to the fourth zone have relative lowest influence to this technology.
3.5 Analysis on Patent Forward Citation Proportionalities – into Four Zones
The relative distribution of each number can be more clearly observed by the-fourth-zones results from the table 3.2. There would be 4% of granted patents in first; 9% of granted patents in second; 19% and 68% of granted patents in third and fourth zone, respectively. All the zones’ patents contained the same percentage of 25%
about citations. Thus, there would be a relative highly marginal productivity for the patents in terms of economics in the first zone because it cost relative low number of patents reach the same portion of forward citation. Besides, the patents in the fourth zone should be less important since it cost much more patents to contain the same portion of forward citation.
A firm had more of these patents in first zone meant it had more core technology in the specific technology and would be the leader firm of the industry in R&D development. In comparison, the patents in the fourth zone was less valuable and could be viewed as almost not yet be cited as the forward citations was just less then 5 times on average in our cases. This state might reveal these patents had no valuable
technology and knowledge for the development of the specific technology. A firm had more of these patents meant it took much R&D resource to the development of unimportant technology. Then it could be set up a criterion that the firms or countries should try to add the value of the patents and make effort to have the first-zone-patents because this meant the firm or country had the great influence in a specific technology if they dominate more of the first zone’s patents. It also could be the goal in R&D developing that a firm should reach.
3.6 Analysis on Patent Forward Citation Numbers – into Five Zones
In the section, patents are arranged in the order of descending number of forward citation for a given industry so that they would be divided into a zone of patents more particularly devote to the given industry. Simultaneously, computing and sorting out the five zones containing nearly the same number of forward citations as a zone. Then the number of patents (Ri, i=1, 2, 3, 4, 5) in the first zone and succeeding zones will be as R1:R2:R3 R4:R5=C (1: r: r2: r3: r4). We denote that “C” is the constant and “r” is the
“multiplier” as well. With the multiplier it could be expected the number of granted patents between five zones. And it could be more easily to be found there was a phenomenon that fewer patents have more number of forward citations from the grouping method, and a higher number of patents containing fewer forward citations.
Thus, the data was compiled in the equal citation as the following tables.