Documenting economic, social and
environmental impacts on coastal communities
Principal contributors:
Emma Gibbin, Chloe Hill, Josephine Langley,
Jennifer Ross-Jones, Romain Savary and Francis Vorhies
and tools that enable human progress, economic development and nature conservation to take place together.
Created in 1948, IUCN is now the world’s largest and most diverse environmental network, harnessing the knowledge, resources and reach of more than 1,400 Member organisations and some 18,000 experts. It is a leading provider of conservation data, assessments and analysis.
Its broad membership enables IUCN to fill the role of incubator and trusted repository of best practices, tools and international standards.
IUCN provides a neutral space in which diverse stakeholders including governments, NGOs, scientists, businesses, local communities, indigenous peoples organisations and others can work together to forge and implement solutions to environmental challenges and achieve sustainable development.
www.iucn.org twitter.com/IUCN/
Documenting economic, social and
environmental impacts on coastal communities
Principal contributors:
Emma Gibbin, Chloe Hill, Josephine Langley,
Jennifer Ross-Jones, Romain Savary and Francis Vorhies
IUCN is pleased to acknowledge the support of its Framework Partners who provide core funding: Ministry of Foreign Affairs of Denmark; Ministry for Foreign Affairs of Finland; Government of France and the French Development Agency (AFD); the Ministry of Environment, Republic of Korea; the Norwegian Agency for Development Cooperation (Norad); the Swedish International Development Cooperation Agency (Sida); the Swiss Agency for Development and Cooperation (SDC); and the United States Department of State.
This publication has been made possible by funding from the Swedish Ministry of Environment & Energy.
Published by: IUCN, Gland, Switzerland
Produced by: IUCN Global Marine and Polar Programme
Copyright: © 2021 IUCN, International Union for Conservation of Nature and Natural Resources Reproduction of this publication for educational or other non-commercial purposes is authorized without prior written permission from the copyright holder provided the source is fully acknowledged. Reproduction of this publication for resale or other commercial purposes is prohibited without prior written permission of the copyright holder.
Citation: Gibbin E., Hill C., Langley J., Ross-Jones J., Savary R. and Vorhies F. (2021). Acting on ocean risk. Gland, Switzerland: IUCN. vi+62 pp.
Cover images: © Shutterstock
Images: © Shutterstock unless otherwise credited Layout by: Imre Sebestyén (Unit Graphics)
Printed by: BSR Imprimeurs SA, Gland, Switzerland
The text of this book is printed on paper made from wood fibre from well-managed forests certified in accordance with the rules of the Forest Stewardship Council (FSC).
Executive summary . . . .v
1. Introduction . . . .1
2. Background . . . .3
2.1 An expert meeting in 2017 . . . .3
2.2 An ocean connections report in 2018 . . . .4
2.3 Review of what is known . . . .6
2.3.1 Disaster risk reduction and ocean risk . . . .7
2.3.2 Climate change and ocean risk . . . .7
3. Evidence of impacts globally . . . .9
3.1 Extreme weather events . . . .9
3.2 Coral bleaching . . . .11
3.3 Harmful algal blooms (HABs) . . . .14
3.4 Food security via fisheries and aquaculture . . . .19
3.5 Human health and diseases. . . 21
Shellfish and other food contamination . . . .22
Costs of norovirus virus (NoV) . . . .24
Illnesses from direct marine exposure . . . .24
Anthropogenic pollution - exacerbating human illnesses . . . .25
4. Evidence of impacts in the Western Indian Ocean . . . .29
4.1 Impacts in Kenya . . . .29
4.2 Impacts in Mozambique . . . .33
4.3 Impacts in Tanzania . . . .36
5. What do we still need to know? . . . .41
5.1 Extreme weather events . . . .41
5.2 Coral bleaching . . . .42
5.3 Harmful algal blooms . . . .43
5.4 Food security via fisheries and aquaculture . . . .43
5.5 Human health and diseases. . . .44
6. Opportunities . . . .47
6.1 Economic risk . . . .47
6.2 Partners . . . .47
6.3 Capacity . . . .48
6.4 Integrated approach to implementation . . . .48
6.5 Financing . . . .49
6.6 Ocean risk assessments . . . .50
7. What can be done? . . . .53
References . . . .55
Executive summary
The rapid and deep changes that are being caused to the biosphere due to climate disruption and biodiversity loss undermine the future wealth, health, and prosperity of the human population. As these changes take hold and negative effects accelerate, it will be important to keep track of the full impact of such issues in order take the necessary mitigation and adaptation actions that are needed to keep our activities in proper balance with the natural world. A central aspect of this is fully understanding the changes and impact our actions are having on the ocean, which provides most of the living space for species on the planet and has a central role in regulating global temperature and climate.
In 2018 IUCN, in partnership with AXA XL, produced a landmark report on ocean risk. Not only did this report define, for the first time, what ocean risk is in terminology that resonates with the global insurance industry, but it also tracked major changes already happening in the ocean and how their effects ripple out into society. The 2018 report also postulated that the full impact of ocean risk was not only increasingly financially significant at global, regional, and national levels but remained under-assessed. It was projected that this would become an increasing challenge in the coming years both in terms of tracking impacts but also making a strong and compelling case for accelerating action to halt deterioration of the natural world.
This report is a follow on and update from the 2018 report and explores whether there is a case to answer for better analysis and understanding of ocean risk, leading to a more accurate
assessment of costs and impacts. The report updates information around the five original focal areas: extreme weather events, coral bleaching, harmful algal blooms, food security via fisheries and aquaculture, and human health and disease. It also analyses this from the national perspective using the case examples from three Western Indian Ocean countries:
Kenya, Mozambique, and Tanzania.
These case studies show that sea-level rise is an increasing threat on some densely populated areas and extreme weather events are likely to increase with ever greater unpredictable consequences. Mass coral bleaching events are occurring with increasing regularity and are potentially of major concern. The full extent of the impact of climate change on artisanal fisheries is as yet unquantified. Harmful algal blooms are having an increasing impact on human health especially those working in the marine environment.
The work concludes, from the global and regional observations in this report, that ocean risk is material. For many hazards, impacts are both already significant and increasing. It recommends that more in-depth assessment is urgently needed to inform policy makers, investors, insurers, and communities about the substantive and rising costs of these impacts on developing countries, and the extent to which ocean risks impact economic and subsistence activities.
1. Introduction
The ocean has always presented humanity with a mix of substantive opportunities and serious threats. From bountiful fisheries to devastating storms, the ocean has impacted human societies and settlements for centuries. What is different today, however, is the scale of these impacts and the increasing risk of negative impacts.
Globalisation, as evidenced in the increasing scale and scope of global trade and the extraction of resources – including fish and other marine resources – is increasing our demand for ocean goods and services. Our ever-expanding technical and financial capacity is enabling us to harvest the ocean at unsustainable levels. At the same time, environmental pressures on the ocean – climate change, plastic waste, land-based pollution – are also increasing, resulting in disruptive ocean events as never seen before.
This report highlights what is known about the economic value, cost and losses associated with five major global issues: extreme weather events, coral bleaching, harmful algal blooms, food security via fisheries and aquaculture, and human health and disease.
The aim of this report is straightforward – to make the case for better assessment and management of ocean risk. This is achieved by first observing what is known about ocean risk regarding several key issues and by looking at three Western Indian Ocean countries. This is followed by a discussion of what is not known and should be known in order to better assess and manage ocean risk. The report ends with a call to develop a more strategic approach to ocean risk assessment and management at the national level.
In particular, the report hopes to stimulate discussions around the following questions:
• What are the major economic sectors at risk in the country/region?
• Who would need to be involved in national or regional-level talks? Government officials? Private sector representatives?
Universities? NGOs?
• How much capacity is there already for monitoring changes in ocean-related economic trends?
• Can ocean risk management be integrated into countries national strategies and approaches to natural disaster risk reduction?
2. Background
2.1 An expert meeting in 2017
An expert workshop exploring ocean risk took place at in 2017 at Oxford University in the UK (Laffoley et al, 2017). The experts discussed the nexus between hazards, exposure, and risks and agreed on the following relationship:
Hazard x Exposure
Vulnerability = Degree ofocean
risk
They then proceeded to draw up an initial list of potential ocean hazards, which included the following:
Changes in ocean physics and chemistry
Methane Acidification
Changes in ocean chemistry Rising temperature and stratification
Ocean currents and winds Hypoxia
Nutrient changes
The workshop explored the risks of ocean hazards and the potential impacts of these risks on coastal communities. They concluded with the recommendation that:
The true financial costs of ocean risk impacts - such as extreme storm events, coral bleaching and harmful algal blooms - is unclear, either in terms of total number of events or in terms of the total scale of impacts. This means that the impacts are not fully assessed because events are seldom isolated and they are rarely without multiplier effects. Moving forward, it will be important to gather more consistent and in-depth facts on the true scale of what is happening, including the knock-on effects on small to medium-sized enterprises that are often the life-blood of the economy.
This report responds to this recommendation by highlighting what is known and what yet needs to be known about ocean risks.
Human use/ocean interaction Pollution
Extraction Ocean use change Societal disconnection
Geoengineering Change in ocean use
Shipping
Harmful ecosystem change
Resource competition Military use Seismic testing
Aquaculture Bioprospecting Pipelines and cables Renewable energy generation
Tourism Recreation
2.2 An ocean connections report in 2018
The IUCN “Ocean connections: An introduction to rising risks from a warming, changing ocean” report (Laffoley and Baxter, 2018) report identified the societal ripple effects of climate change in innovative bubble diagrams. It set out to “explore the hazards and risks associated with ocean warming from a variety of angles, and by using innovative graphics, look at how these ‘simple’ temperature-related changes to the ocean can ripple out into many aspects of society.”
These ripple effects are used in this report as the investigative framework for further research to identify what is known, and what is not known, about the economic risks of climate change. The
ripple effect of ocean risks was investigated for 5 key areas:
• extreme weather events;
• human health and diseases;
• harmful algal blooms;
• coral bleaching; and
• food security via fisheries and aquaculture.
These ripple effects were set out in bubble diagrams. The right-hand sections of these diagrams – reproduced here – provided the investigative framework for further research on finding out what we know and what we should know about the changing risk landscape.
Extreme weather events
The societal vulnerability to risks arising from extreme weather events include the following costs:
• Costs to life
• Costs to property and infrastructure
• Costs to repair and insure
• Costs to operate
• Costs to income
• Costs to recreation and tourism
• Costs to agriculture
What do we know and what do we need to know about these costs?
Coral bleaching
The societal vulnerability to risks arising from coral bleaching events include the following costs:
• Devaluation of the region
• Coastal defence costs
• Costs to income
• Loss of business
• Costs to operate
What do we know about these costs and losses and what do we need to know?
Harmful algal blooms
The societal vulnerability to risks arising from harmful algal bloom events include the following costs:
• Costs to tourism and recreation
• Costs to income
• Costs from loss of production
• Costs to secondary dependent industries
• Human poisoning, e.g. PSP/DSP
• Viability of marine aquaculture
• Viability of wild shellfish harvesting
What do we know about these costs and impacts and what do we need to know?
Food security via fisheries and aquaculture
The societal vulnerability to risks include the following costs:
• Costs to associated industries
• Conflicts around new fisheries
• Fishing travel costs
• Viability of profits and jobs
• Changes to predator/ prey interactions
• Biodiversity changes from altered fishing
• Changes to ecosystem services
• Impacts on predatory species
• Large catch decreases in the tropics
• Food security for local communities
What do we know about these costs and changes and what do we need to know?
Human health and diseases
The societal vulnerability to risks arising from human health and diseases include the following costs:
• Shellfish and other food contamination
• Life-threatening illness epidemics
What do we know about contamination and illnesses - and what do we need to know?
2.3 Review of what is known
In preparation for this report, the IUCN Global Marine and Polar Programme undertook an extensive desk-based review of the available evidence of current ocean climate economic
impacts. For instance, traditional sectors such as fisheries are seeing ever-increasing demands on already-declining stocks. These pressures come not only from climate impacts, but also from
overfishing and from more recent and growing sectors such as tourism and aquaculture, which are vital sources of revenue for many of the poorest communities in developing countries and regions.
Considering these challenges, it is somewhat surprising that no comprehensive figures exist on the scale and nature of economic impacts already being felt by affected local communities and others throughout the world. The research undertaken by IUCN confirms that we know a good deal about what is happening, but we still do not have a comprehensive understanding of the cumulative impacts, particularly in terms of costs. Not knowing these figures is hampering the assessments of the scale, nature, and urgency of the actual investments needed to counter these problems.
The research also highlights that several distinct areas of work related to development, disaster risk reduction, climate change and particular economic sectors each have their own distinct approaches to some aspects of ocean risk, although none comprehensively incorporate all ocean risks.
2.3.1 Disaster risk reduction and ocean risk
Globally, annual economic losses to all types of disasters due to natural hazards has increased from US$ 14 billion in 1985 to US$ 140 billion in 2014 (UNDRR, 2019). Partial information on the scale and nature of economic impacts from disasters are available from resources provided by - and supporting - global efforts on disaster risk reduction, including: the knowledge platform on disaster risk reduction1, the disaster loss data for the Sustainable Development Goals and Sendai Framework Monitoring System2, and the International Disasters Database (EM- DAT)3. Unfortunately, even with these global databases, economic data are not provided for over 60% of disaster reports in EM-DAT (CRED, 2018).
1 https://www.preventionweb.net/knowledgebase/disaster-statistics 2 https://www.desinventar.net/
3 https://www.emdat.be/
Economic data and information are most available regarding geophysical hazards (earthquakes, volcanoes, and mass movement), hydrological hazards (floods and landslides), meteorological hazards (storms and extreme temperatures) and climatological hazards (droughts and wildfires) (CRED, 2018). Biological hazards including disease, pests/infestations, biotoxins and harmful algal blooms are less commonly reported to these global platforms.
In addition, many platforms are inconsistent in what and how they report, with large gaps for developing countries on economic costs and little information on many ocean risks such as coral bleaching, harmful algal blooms and human health and diseases. Impacts of disasters on economic sectors such as fisheries or
tourism are rarely reported using a standardised approach or incorporated consistently into global databases.
2.3.2 Climate change and ocean risk
The IPCC Special Report on the Ocean and Cryosphere in a Changing Climate (SROCC) highlights the range of hazards and risks that have been, and will continue to be, exacerbated by climate change (IPCC, 2019). The physical changes to the ocean (temperature, oxygen, acidity and sea level) will affect all ocean and coastal ecosystems with knock-on effects on human systems and ecosystem services (fisheries, tourism, transportation/shipping, cultural services, and carbon sequestration) (IPCC, 2019). Climate change has increased the severity and extent of hazards, while population growth, coastal and ocean-based economic activities and socio-economic development have increased the exposure of people and their assets to these hazards.
Whilst adaptation actions are being taken, it seems highly likely that they will not be achieved at the speed or scale commensurate with the ocean risks now being faced, with the poorest communities likely to be the most affected.
3. Evidence of impacts globally
3.1 Extreme weather events
Examples of extreme weather include heat waves, cold waves, extreme precipitation, and drought. To be classified as an extreme weather event, certain criteria, based on the physical, temporal, and spatial extent of the weather must be met.
Definition aside, both the frequency and magnitude of extreme weather events are growing at an alarming rate. The IPCC states with statistical confidence there has been: an increase in global average daily temperature;
an overall increase in the length or number of heat waves in many regions; an increase in drought duration in southern Europe and West Africa; and a reduction in drought duration and/
or frequency across central North America and north-west Australia (Field et al., 2012). The UN Office for Disaster Risk Reduction (UNDRR) reported that there were 6,602 weather-related disasters between 1998 and 2017 (Wallemacq and House, 2018).
Economic costs represent a growing problem.
The World Meteorological Organisation (WMO) covered an almost 40 year range, from 1970 to 2012, and reported economic losses of US$ 2.4 trillion (Golnaraghi et al., 2014). These figures seem to be validated by other studies, which report losses of US$ 1.4 trillion, between 1980 and 2004 (Mills, 2005) and US$ 1.5 trillion between 2003 and 2013 (Baas et al., 2015).
The UNDRR estimated that economic losses were US$ 2.24 trillion from 1998 to 2017; US$
932 billion more than those reported for the prior 20-year period (i.e. from 1978 to 1997) (Wallemacq and House, 2018).
Considered together, the reports show an overall increase in economic costs associated with extreme weather events, despite the systematic underreporting of the losses in developing countries. Surprisingly, while high- income countries reported losses from 53% of disasters between 1998 and 2017, low-income countries only reported them from 13%. No data are thus available on the losses incurred by 87% of the disasters in low income countries (Wallemacq and House, 2018).
Costs to operate
Global growth could be hindered by rising operational costs as the frequency and magnitude of extreme weather events increase. In the worst-case, this could reduce annual GDP growth by up to 1% (Wade and Jennings, 2015). The transportation departments (Venner and Zamurs, 2012) and power industries (Campbell and Lowry, 2012) are expected to be the most heavily impacted by rising maintenance costs, although very few data exist on these topics.
Costs to life
A key risk area from the potential increase in the intensity and frequency of extreme weather events is the costs to life, not only in terms of lives lost, but also people who suffer from health problems (physical injuries and psychological trauma) or displacement from their homes from an extreme weather event. The saddest and most troubling cost remains the number of fatalities caused by extreme weather events, which stands at 967,616 for the period ranging from 1900 to 2015 (Bouwer and Jonkman, 2018) and 552,766 in the period ranging from 1998 to 2017 (Wallemacq and House, 2018). In 2018 alone, extreme weather events claimed more than 13,500 victims (Swiss Re, 2018).
Costs to property and infrastructure
Extreme weather events are thought to inflict US$ 18 billion worth of
damage a year to power and transport infrastructure in low- and middle-income countries. Natural disasters also cause significant disruptions to infrastructure that are thought to be worth between US$ 391 billion and US$ 647 billion a year to households and private firms. Water infrastructure systems such as reservoirs, groundwater pumps, and transmission lines are extremely vulnerable to natural disasters. However, no information currently exists on the economic cost absorbed by these sectors (Hallegatte et al., 2019).
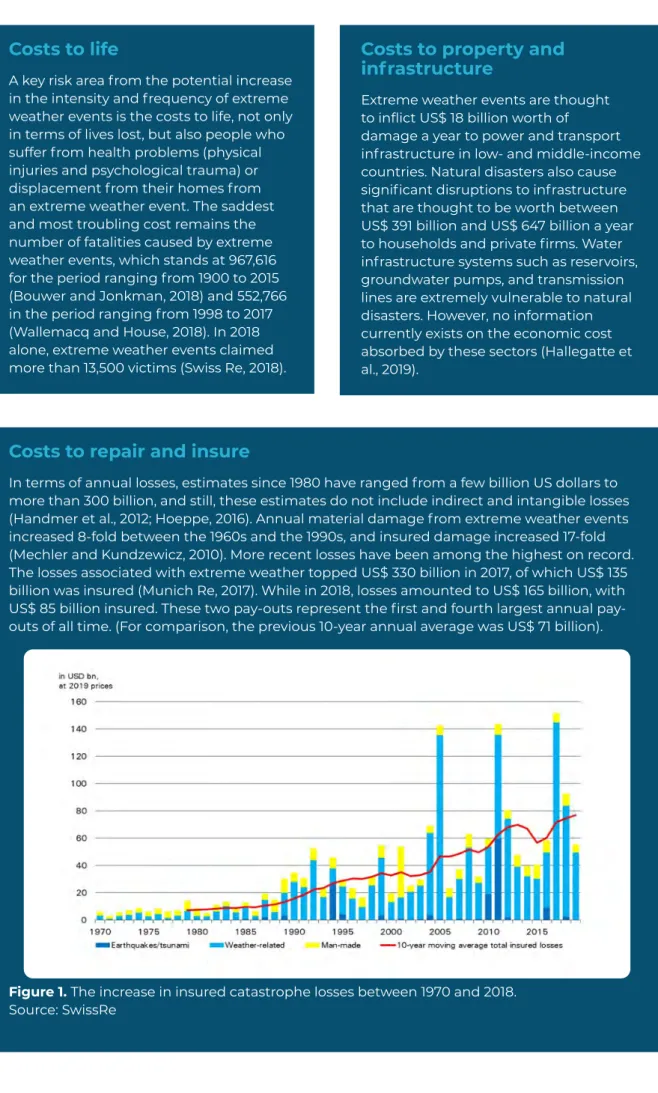
Costs to repair and insure
In terms of annual losses, estimates since 1980 have ranged from a few billion US dollars to more than 300 billion, and still, these estimates do not include indirect and intangible losses (Handmer et al., 2012; Hoeppe, 2016). Annual material damage from extreme weather events increased 8-fold between the 1960s and the 1990s, and insured damage increased 17-fold (Mechler and Kundzewicz, 2010). More recent losses have been among the highest on record.
The losses associated with extreme weather topped US$ 330 billion in 2017, of which US$ 135 billion was insured (Munich Re, 2017). While in 2018, losses amounted to US$ 165 billion, with US$ 85 billion insured. These two pay-outs represent the first and fourth largest annual pay- outs of all time. (For comparison, the previous 10-year annual average was US$ 71 billion).
Figure 1. The increase in insured catastrophe losses between 1970 and 2018.
Source: SwissRe
Costs to income
Predicting the impact of extreme weather events on household income depends on five main criteria. Is the household a net producer or a net consumer of food? How varied/diverse are the household’s current and potential income sources? What type of assets are owned by the household? Is the household able to adapt to income disruptions by reducing or smoothing their consumption? Does the household have access to credit or social safety programmes?
Even if one can calculate all of these factors, predicting the effect that
extreme weather will have on household income is extremely difficult, because a socioeconomic response in society is almost always initiated. In general, though, extreme weather events tend to affect the poor more than the rich. It is much easier to calculate the costs of extreme weather events on corporate income. In the financial year of 2017, for example, 500 companies publicly stated that extreme weather events reduced their revenue (S&P Global Ratings, 2018), yet only 18 companies quantified the effect. The average reduction amounted to 6% (S&P Global Ratings, 2018).
Costs to recreation and tourism
Recreation is conducted in proximity to the home, whereas tourism involves an overnight stay. Recreational activities are not expected to be heavily impacted by extreme weather events; people will simply switch activities or seasons in which they practise their hobby. Tourism on the other hand, will be much more heavily impacted by extreme weather events. The tourism industry is one of the world’s largest, accounting for 9%
of global GDP and generating more than US$ 6 trillion in revenue each year (Handmer et al., 2012). The majority of assessments to date have been carried out in the Caribbean region because of its disproportionate reliance on tourism for GDP (Layne, 2017). A 2016 report from CISL reported that the costs of rebuilding tourist resorts as a result of sea level rises of 1m would be between US$ 10 billion and US$ 23.3 billion. The cost of extreme weather events for Barbados alone, were estimated to range from US$ 5.127 billion (129% of GDP) to US$ 7.648 billion (193% of GDP) (ECLAC, 2011).
3.2 Coral bleaching
Coral reefs provide a range of ecosystem
services including coastal protection, recreation, and tourism. They also act as nursery grounds, supporting artisanal and commercial fisheries and they are a hotspot for novel drug discovery.
Estimating the global value of coral reefs is complicated because many of the values of the services they provide overlap. Nonetheless, estimates do exist. In 1997, the annual value of coral reefs was calculated as being US$ 375 billion (Costanza et al., 1997). In 2012, this value was expressed relative to the spatial extent (in hectares per year). The average value was US$
352,915 ha-1yr-1 although values ranged from 36,794 ha-1yr-1 to 2,129,122 ha-1yr-1 (De Groot et al., 2012). In 2014, the global service estimate was revised to between US$ 9.9 trillion and US$ 21.7 trillion (Costanza et al., 2014). Valuations of coral reefs have also been conducted at the national
level. The services provided by the Great Barrier Reef, Australia for example, have been valued at between AUS$ 15 billion and AUS$ 20 billion per year (Stoeckl et al., 2014), while Hawaii’s reefs contribute an estimated US$ 360 million to the economy each year (Cesar et al., 2003).
Coral bleaching (the characteristic whitening of coral resulting from the loss of its symbiotic algae) is threatening the very survival of coral reefs and the ecosystem services they provide.
The first global mass bleaching events were reported in 1998 (Aronson et al., 2002; Baird and Marshall, 1998). The second occurred in 2010 (Alemu and Clement, 2014; Krishnan et al., 2011; Moore et al., 2012). In 2015 and 2016, NASA reported that seawater temperatures were the warmest since measurements began (Northon,
2017). Seventy-five per cent of the world’s reefs were affected in the latter year (Hughes et al., 2018). It is widely accepted that 20% of the world’s corals are dead and that the rest are
under substantial threat. In this section, we will assess the effects of coral bleaching on the value of the ecosystem services provided by the reef.
Costs to recreation and tourism
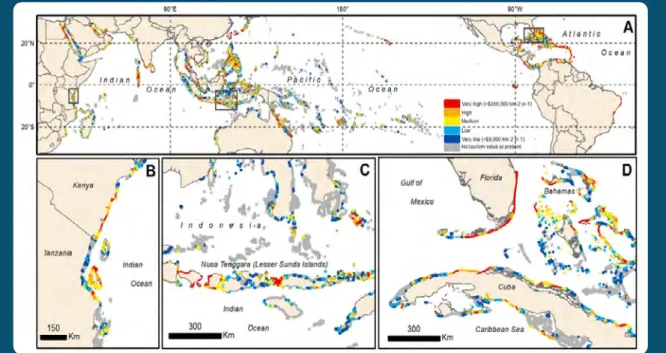
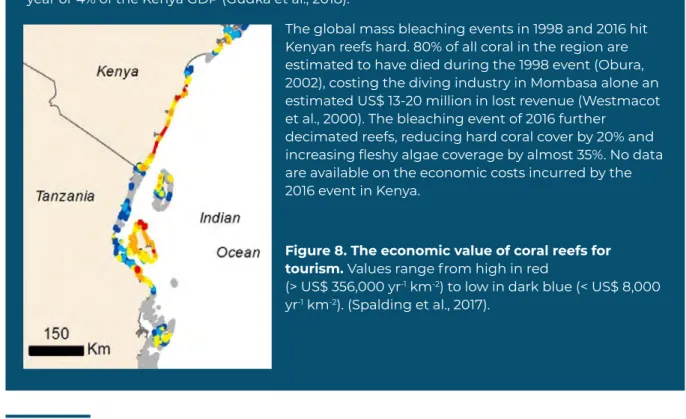
Tourism is one of the biggest industries associated with coral reefs, and is worth at least US$°36 billion to the global economy every year (Spalding et al., 2017). The average value of tourism-related income on coral reefs has been estimated to be US$ 96,300 ha-1 yr-1. Although this varies from a few hundred US$ ha-1 yr-1 for small remote reefs to over US$ 2 million ha-1 yr-1 for heavily visited reefs in the Caribbean (De Groot et al., 2012). Such high variability makes extrapolating values to a larger scale difficult and thus, unwise. Rather, it is better to consider how bleaching will affect ecosystems at the national level. Take the Great Barrier Reef (GBR) as an example. In 2017, more than 2.3 million tourists visited the GBR generating revenue of US$ 5.2 billion for the Australian economy (Piggott-McKellar and McNamara, 2017). In a survey asking visitors whether severe bleaching events would make them more likely to choose an alternative holiday destination a large proportion answered in the affirmative: 35% of Americans, 27% of British and 55% of Chinese tourists and 37% of domestic Australian visitors (Swann and Campbell, 2016). This potential loss of tourism revenue is estimated at $1 billion (Swann and Campbell, 2016), putting at risk the 65,000 full-time jobs dependent on tourism in the region (Piggott-McKellar and McNamara, 2017).
The GBR aside, most coral reefs are in low economic countries. This renders poor and developing countries at greater risk from the loss of revenue from tourism. In some cases, reef-related revenue represents up to 40% of a countries GDP (e.g. the Maldives and Palau (Spalding et al., 2017)). Caribbean countries are also heavily reliant on reef-related tourism (Burke et al., 2011, 2004). In 2006, the direct economic benefits of reefs provided Tobago and St. Lucia $ 43.5 million (15% of GDP) and US $ 91.6 million (11% GDP), respectively. The indirect benefits (such as the provision of boats, towels and beverages) contributed an additional US$°58-86 million to Tobago, and US$ 68-102 million to St. Lucia (Burke et al., 2008).
Figure 2. Tourism value of coral reefs. Red: >US$ 356,000 km-2 yr-1; Dark blue: <$US 8,000 km-2 yr-1); Grey: no value available at present. (Source: Spalding et al., 2017)
Coastal defence costs
Coral reefs play a critical role in wave attenuation, reducing the force of big waves, and thus protecting the coastline from flood damage and erosion (Ferrario et al., 2014; Spalding et al., 2014). In 2010, the loss of value in coastal protection from reef destruction was between US$°0.011 and US$ 0.453 million per km2 (Barbier et al., 2010). Recently, a global assessment valued the coastal protection provided by reefs at more than US$ 4 billion (Beck et al., 2018).
If all reefs were lost (a very real possibility if mass coral bleaching events continue to happen), annual damages are expected to double and terrestrial flooding would increase by 69% (Beck et al., 2018). The economic impact of this bleaching would be particularly felt in small island developing states such as Belize, Granada, Cuba, and Bahamas (Table 1).
Table 1. Annual benefit of reefs for flood protection by country.
Source: (Beck et al., 2018)
Costs to income
Evaluating the impacts that coral bleaching will have on income at a national or regional scale requires knowledge of the contribution of each sector to the overall economy. (Direct sectors include, for example: tourism, fisheries, protection, and indirect sectors: cultural, recreational, and research & education value). For this reason, assessments are usually
conducted at the national scale. For example, many assessments have been completed in Sri Lanka (Berg et al., 1998), Hawaii (Cesar et al., 2003), the Philippines (White et al., 2000), Thailand (Seenprachawong, 2016), and Australia (Stoeckl et al., 2014). A case study from Bermuda illustrates the principles involved in assessing the costs. Sarkis et al. (2013), found that tourism provided the highest annual contribution to ecosystem service values in Bermuda, contributing US$ 406 million (56% of the total economic value; TEV), coastal protection was worth US$ 266 million (37% of TEV), recreational and cultural value was valued at US$ 37 million (5% of TEV). Amenities, fisheries, and cultural and recreational values, combined, made up the remaining 2% of TEV.
Loss of potential business
Coral reefs have often been referred to as “blue gold” when it comes to the discovery of new natural products (Leal et al., 2013). Among the most promising are potential cures for cancer, HIV, bacterial infections, and viruses. One such example is Yondelis, a potent antitumor drug, first extracted from a marine tunicate. PharmaMar the company that developed Yondelis reported $US 100 million worth of sales of this drug in 2017. It is highly likely that unidentified drugs have yet to be discovered in closely related species (Zhu et al., 2011). To date, no studies have evaluated what the loss of coral reefs may mean for the loss of blue gold.
Costs to operate
Six million fishers in 99 countries directly rely on coral reefs (Teh et al., 2013). The annual value of reef fishing exceeds US$ 5.7 billion (Cesar et al., 2003). Coral reef loss or degradation could cost the fisheries industry US$ 0.41 million km-2 (Barbier et al., 2010). These costs will be acutely felt in Southeast Asia where over half of all reef fishing occurs. In the Philippines alone, more than one million artisanal fishers catch almost US$ 1 billion annually (White et al., 2000). The Caribbean is also expected to suffer high losses in relation to bleaching, which are estimated to range from US$ 95 million to US$ 140 million per year (Burke et al., 2004).
Seaweed farming is an industry that is indirectly dependent on reefs. Seaweed farming occurs in the sheltered lagoons and bays created by coral reefs where 21 million tonnes of seaweed are produced worldwide each year (Hehre and Meeuwig, 2016) in an industry worth US$ 7.35 billion (FAO, 2012). China is the world’s largest producer of seaweed, cultivating 60% of the world’s production, while Indonesia (21%) and the Philippines (9%) also produce substantial amounts.
The marine ornamental fish trade is another sector that might be severely affected by future coral reef ecosystem degradation. This trade provides a significant source of income for low- income nations, i.e. EUR 135 million between 2000 and 2011 (Leal et al., 2016).
3.3 Harmful algal blooms (HABs)
Harmful algal blooms (HABs) are proliferations of certain noxious or toxic microalgae,
macroalgae and cyanobacteria with negative impacts on aquatic ecosystems, wildlife, and human health and wellbeing (Berdalet et al., 2017). HABs can be classified as biological hazards (UNDRR, 2019). HABs can cause human fatalities, disability and illness, fish kills, mortalities and stranding of wildlife, contamination of drinking water and seafood, ecological damage through the development of anoxia or other habitat alteration (Berdalet et al., 2017). HABs cause extensive economic damage to four major economic sectors:
recreation and tourism, public health,
monitoring and management, and commercial fishing (Sanseverino et al., 2016). Detailed global estimates do not exist regarding the economic
impact of HABs but conservative national figures suggest that annual costs exceed US$
95 million in the USA, US$ 850 million in Europe and US$ 1 billion in Asia (Kudela et al., 2015).
Due to extensive economic losses in the past caused by HABs, many governments have implemented monitoring and management programmes (Anderson 2017; Sanseverino et al., 2016; Wang et al., 2009). This has had a positive impact in reducing the costs to public health and from disposal of toxic fishery harvests from HABs. However, these costs have largely been transferred to monitoring and mitigation costs borne by the private sector, e.g. in aquaculture (closures) or the public sector, e.g. on water quality monitoring, warning systems and clean- up/disposal (Anderson 2017; Trainer et al, 2014;
Yang et al., 2018). Other industries affected by HABs include desalination processes for water supply, due to the cost of managing biofouling and the risk of biotoxins in drinking water (Anderson, 2017; Berktay, 2011; Villacorte et al., 2015). Other industries whose operating costs are vulnerable to increase due to HABs include energy and industrial activities that use seawater for cooling. Added costs include those from biofouling and reducing the risk of invasive species introductions caused by maritime transport (Anderson, 2017).
European data about spending on annual HAB monitoring plans exceed global estimates on the annual costs of HABs: Denmark and Portugal spent about US$ 500,000, France US$ 800,000 and Spain (Galicia) US$ 1,114,000
4 https://www.prnewswire.com/in/news-releases/fish-processing-market-worth-22271-billion-usd-by-2021-582221241.html
(Anderson et al., 2001 in Sanseverino et al., 2016).
This highlights the importance attributed by European governments to monitoring and managing HABs.
Since the 1980s, HABs have expanded in their range and increased in frequency, due to a combination of human introduction (e.g.
aquaculture and shipping), ocean warming, marine heatwaves, oxygen loss, eutrophication, and pollution (IPCC 2019). Coastal communities are particularly vulnerable, as there are
no monitoring programmes and early warning systems in place. Unfortunately, the identification of biotoxins and their toxicity require specialist skills and equipment, which are often lacking but necessary for risk management and mitigation.
Costs to income
Loss of income and jobs from beach and fisheries closures affects commercial and recreational fisheries, tourism and restaurant industries, property sales and rentals, as well as income and traditional food sources to local communities. Indigenous coastal communities are particularly vulnerable to acute and chronic exposure to HAB toxins due to the high consumption of seafood and ties to traditional and customary practices (Cisneros- Montemayor et al., 2016).
Costs to income can be assessed at an individual level by calculating the average cost of sick days taken due to illnesses arising from HAB exposure (Kouakou and Poder, 2019). This has been estimated to be between US$ 136 (Nierenberg et al., 2010) and $236 (Todd, 1995) per day.
Costs to associated industries
The fish processing industry, which includes the preservation, cooking, and production of fish meal for animal feed, is extremely valuable. By 2021, the market is projected to reach US$
222.71 billion in value4. The EU estimates that 45% of the gross value of fisheries is added by the processing industry (DG MARE, 2019). The sector is an important employer, particularly for women. In 2015, 130,000 people were employed by the EU processing industry and more than EUR 30 billion was turned over by this industry (DG MARE, 2019). In Australia, AUS$ 330 million of Gross Value Added (GVA) was added by fish processing in 2017-2018, contributing AUS$165 million to total household income (FRDC, 2019). Such activities are vulnerable to disruption by fisheries closures caused by HAB events and the costs associated with monitoring and control (Anderson et al., 2017; Trainer et al., 2014). However, any loss and damage to fisheries processing industries from HAB events have not been isolated from the larger scale costs to fisheries in general.
Costs to recreation and tourism
Global costs to tourism and recreation due to HAB events are not available even though these events frequently occur in most continents. In the Caribbean, West Africa, France and China, massive noxious blooms of macroalgae have displaced tourism and recreation away from affected beaches and water bodies due to huge biomass accumulation and odours released during decomposition. Toxic blooms cause closures of beaches and recreational fisheries, and even make water-based activities unpleasant or dangerous. Visual and odour effects, as well as aerosols affecting respiration, can increase the zone of impact to extend well beyond the initial location of the HAB.
HAB outbreaks occur off the coast of Florida, USA on an almost annual basis wreaking havoc on the tourism industry. HABs of the dinoflagellate Karenia brevis, for example, are estimated to cost the Florida tourism industry more than US$ 20 million per year (Anderson et al., 2000), with economic losses of US$ 2.8 million and US$ 3.7 million per month assumed by the hotel and restaurant industries (Larkin and Adams, 2007). A particularly strong HAB, which occurred in the North Pacific on the coast of Washington in 2015, inflicted US$ 40 million worth of lost tourism revenue on coastal communities following the closure of popular razor clam and Dungeness crab tourist attractions (Dyson and Huppert, 2010).
Algal blooms have also become an annual summer event in the China’s Yellow Sea. The “green tides” of Ulva prolifera are not necessarily toxic for human health, but as the bloom peaks and then declines, the decomposition releases noxious gases. The first major algal bloom of U.
prolifera occurred in 2008, during the Beijing Olympic Games, raising international awareness about the problem. The 600 km2 bloom lasted 46 days and required 5,000 people, 200 trucks and 1,185 fishing boats a day to eliminate algae from the sailing event area. This operation cost the organizers more than US$ 100 million (Wang et al., 2009; Ye et al., 2011), substantially higher than profits gained by the local seaweed (Porphyra yezoensis) aquaculture industry, which accounted for US$ 53 million (Hu et al., 2010).
Costs of human poisoning from algal biotoxins
Algal biotoxins affect 60,000 people per year with 1.5% of cases leading to death (GESAMP, 2001). The financial cost of health care caused by consuming contaminated seafood alone is estimated to be around US$ 4 billion a year (GESAMP, 2001). Globally the incidence rate of paralytic shellfish poisoning (PSP) arising from HABs increased from 1970 to 2000 (Gilbert et al., 2005; Figure 3). This increase is related to: the increase in seawater temperatures, increased shellfish consumption and higher levels of coastal eutrophication (Berdalet et al., 2015;
Gilbert et al., 2005; Morabito et al., 2018). Also, more time and effort are spent monitoring the distribution of biotoxins and their impacts on human health.
The most reliable estimates of economic costs can be found in the USA. Exposure to food or water-borne poisoning is estimated to cost up to US$ 1 billion a year. Of this, US$ 350 million comes from food-borne pathogens or toxins, US$ 300 million is attributed to seafood borne disease with an unknown cause and US$ 300 million are caused by gastro-intestinal illnesses from beach recreation (Ralston et al., 2011). The proportion of illnesses that are caused by HAB-related toxins versus bacterial infections or other causes is not known. Most major HAB poisoning syndromes are present in the USA (Figure 4). Of these ciguatera fish poisoning has the highest costs at US$ 17-21 million per year (Anderson et al., 2000; Ralston et al., 2011).
Respiratory and digestive illnesses caused by Karenia brevis blooms range from US$ 0.1- 0.7 million every year, depending on the intensity and duration of the bloom (Hoagland et al., 2014, 2009).
Figure 3. The global increase in Paralytic Shellfish Poisoning.
Data from 1970-2000 (Gilbert et al., 2005).
Figure 4. The national distribution of algal biotoxin syndromes in USA. Figures exclude USA territories in the Pacific and Caribbean).
Copyright © 2008, Erdner et al; licensee BioMed Central Ltd.
Costs to fisheries and loss of production
In 2003, HABs losses to fisheries (including finfish and shellfish wild harvests and aquaculture) in European coastal waters were estimated to be more than € 800 million (Scatasta et al., 2003). Similar losses in the USA are only available at the state or regional level with annual losses of US$ 20 million reported in South West Florida and US$ 43 million in Maryland (Sanseverino, 2016).
In 2006, a HAB event off the coast of Zhejiang Province caused US$ 5.9 million in losses for local fisheries. In 2012, a HAB event off the adjacent Fujian Province coast decimated the farmed abalone industry, resulting in US$ 284 million in losses (Xinhua, 2017). In 2015/2016, a bloom of the diatom Pseudo-nitzschia australis broke records for extent, duration, and toxicity. The bloom, associated with an El Niño event, a marine heatwave (named “The Blob”) and coastal upwelling, shut down the lucrative Dungeness crab fisheries on the West Coast of the US, causing losses of US$ 97.5 million (Dyson and Huppert, 2010).
In 2016, 40,000 tonnes of farmed salmon in Chile (12% of annual production) were lost during a HAB, dominated by the raphidophyte Pseudochattonella, which lasted for two weeks (Clément et al., 2016; León-Muñoz et al., 2018). The HAB was one of the worst in recent history, causing economic losses of more than US$ 800 million; a huge part of the US$ 4.3 billion economy in Chile (León-Muñoz et al., 2018).
A different algal bloom also in 2016, dominated by the floating brown macroalgae Sargassum, hit China’s Yellow Sea, and caused US$ 73 million worth of losses to seaweed farmers in the Jiangsu Shoal (Xing et al., 2017).
Algal bloom in a tropical fish farm, Thailand.
Source: Shutterstock / nicepix
Costs to household income
Climate change is expected to significantly impact fishers, fish farmers and coastal
inhabitants. Global losses in household income are expected to range between US$ 6-14 billion per year depending on the projected climate change scenario that is used (Lam et al., 2017).
Households in developing countries are likely to suffer bigger relative losses than developed countries (estimated at US$3.9–8.4 billion for the former and US$1.6–4.2 billion for the latter).
East Asia and the Pacific stand to lose the highest amount (US$6 billion per year) followed by Latin America, the Caribbean and Sub-Saharan Africa (Sumaila and Cheung, 2010).
3.4 Food security via fisheries and aquaculture
5 https://www.cfr.org/report/exposing-chinas-actions-south-china-sea; https://international.thenewslens.com/article/69945
The livelihoods and food security of 520 million people (approximately 8% of the world’s population) depend on fisheries and aquaculture (FAO, 2009). In addition to this, a further 200 million people are employed (both directly and indirectly) along the value chain in the two sectors (FAO, 2017). More than 3
billion obtain more than 20% of their dietary protein from the marine environment (UNDRR, 2019). Fish comprised 17% of all animal protein consumed by the human population (FAO, 2017) and capture fisheries alone are estimated to be worth US$ 220-250 billion annually (UNDRR, 2019).
Costs to associated industries
As mentioned in Section 3.3, the fish processing industry, which includes the preservation, cooking, and production of fish meal for animal feed, is extremely valuable. By 2021, the market is projected to reach US$ 222.71 billion in value1. The EU estimates that 45% of the gross value of fisheries is added by the processing industry (DG MARE, 2019). The sector is an important employer, particularly for women. In 2015, 130,000 people were employed by the EU processing industry and more than EUR 30 billion was turned over by this industry (DG MARE, 2019). In Australia, AUS$ 330 million of GVA was added by fish processing in 2017-2018, contributing AUS$165 million to total household income (FRDC, 2019).
Conflicts around new fisheries
Climate change will alter the distribution and abundance of commercially-important species (Cheung et al., 2010), potentially leading to escalations in the number of conflicts over marine resources (Spijkers et al., 2018). Conflicts have the potential to become extremely costly. The Council on Foreign Relations has cautioned that territorial disputes such as the on-going conflict in the South China Sea (between China, Vietnam, the Philippines, Taiwan, Malaysia and Brunei) jeopardises the US$5 trillion worth of trade passing through the South China Sea every year5. Co-management policies that cover large marine ecosystems on a regional basis substantially reduce the risk of resource-related conflicts (Pomeroy et al., 2007).
Fishing travel costs
Both the commercial and recreational fishing industries are affected by the price of fuel. This determines the distance travelled by boats and, therefore, has a direct impact on the amount of fish that are caught. The distribution and/or stock levels of the target species also plays an important role in determining the catch per unit effort. Overfished stocks at low densities and smaller sized individuals require boats to travel greater distances or to deeper grounds, which increases the amount of fuel used per tonne of landings (Kelleher et al., 2009). Fuel subsidies offer a controversial means of controlling these values. Annual fuel subsidies paid to the fishing industry exceed US$ 7.7 billion (Sumaila et al., 2016). A recent study called for the abolishment of such subsidies, arguing that would be beneficial for both consumers and fishers (Lancker et al., 2019).
Viability of profits and jobs
Approximately 260 million people are employed either directly, or indirectly (i.e. in associated industries) within marine fisheries. Of these people, 22 million fall into the small-scale fisher classification (i.e. are subsistence or artisanal fishers) (Teh and Sumaila, 2011). It is possible to estimate the impact that changing fish stocks and/or catch per unit effort will have on the job market, but few studies have done it. One exception was a study conducted in West Africa by Lam et al. (2013) that estimated there would be an overall loss of 50% of jobs in fisheries by 2050, relative to the year 2000. Togo, Côte d’Ivoire, Sierra Leone, Nigeria, Ghana and Liberia were shown to be particularly high risk (Lam et al., 2012).
Figure 5. Annual average change in fisheries-related jobs in West Africa. Values represent average employment in the 2050s relative to the 2000s for two climate change scenarios (high: SRES A1B and low: constant 2000 level). (Lam et al., 2012).
Changes to biological interactions
There is currently no information available about the economic costs that changes in marine biodiversity and ecosystem services will have on food security. However, the increasing global demand for lower-value fish used to produce animal feed for aquaculture and/or oil is a major global concern (Garcia and Rosenberg, 2010). Removing large amounts of lower trophic level fish will have a negative impact on the stocks of large predatory fish species (e.g. tuna, cod) that they feed. On the other hand, this removal will reduce predation pressure on species that occupy the lower trophic levels (e.g. krill), which could potentially become a new food source (Garcia and Rosenberg, 2010). Predicting the costs associated with changes in predator-prey interactions is highly complex. It would require complete knowledge of seasonal fluctuations in community dynamics at a regional level (Stevenson et al., 2015); the trophic structure of the ecosystem in terms of both the abundance and spatial distribution of species (Bretagnolle and Gillis, 2010); and the dispersal and severity of threats (including fishing pressure, habitat loss or gain and the introduction of non-native species), data, which are simply not available.
Large catch decreases in the tropics
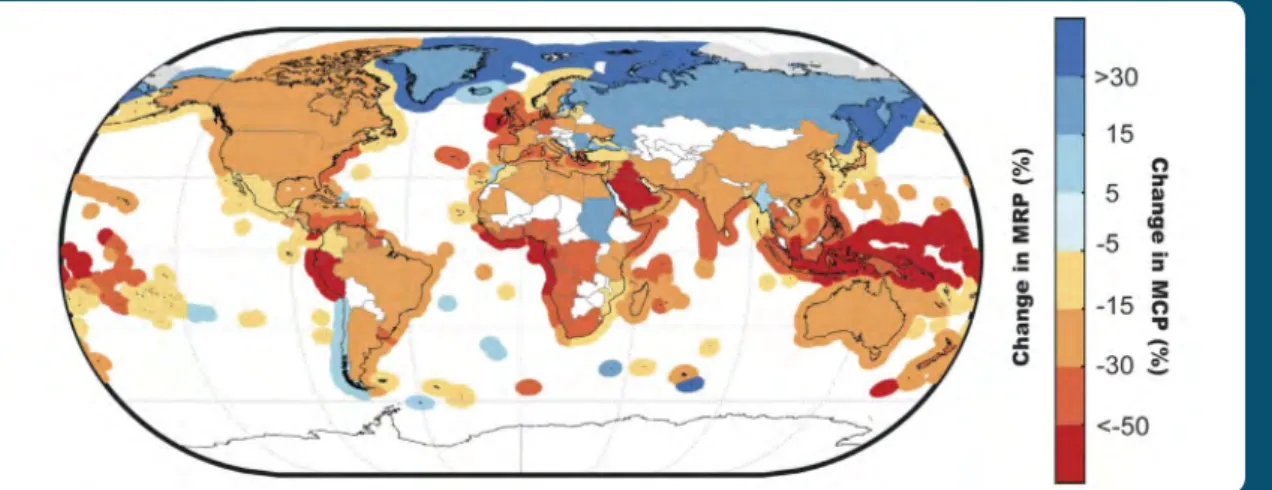
Climate change is expected to cause large-scale redistributions of the global catch potential, with 40% declines in the tropics and 30 to 70% increases in high-latitude regions predicted (Cheung et al., 2010). Temperate tunas (albacore, Atlantic bluefin, and southern bluefin) and tropical bigeye tuna are at particularly high risk of decline in the tropics (Erauskin-Extramiana et al., 2019). Such losses are predicted to reduce the maximum revenue potential of the tropics (latitudes spanning from 10°N to 10°S) by 33% (Lam et al., 2016).
Figure 6. Impacts of climate change on maximum revenue potential (MRP) and maximum catch potential (MRC). Change in MRP/MRC is expressed as the % difference between
average values in the 2050s relative to the 2000s (Lam et al., 2016).
3.5 Human health and diseases
Human exposure to marine-borne diseases can be costly, not only to infected individuals but to entire communities. Direct costs can include: death, medical diagnosis, treatment, investigation of outbreaks, and subsequent monitoring. Indirect costs can include: lost wages and productivity, migration costs, chronic pain and suffering, cost of psychological follow- up, mental health costs, and loss of recreational activities.
Globally, marine pathogens cause
approximately 250 million cases of illness a year, with 5 million annual cases of gastrointestinal illness due to bathing in contaminated water in the USA alone (Ralston et al., 2011). Currently, there are no estimates for the global economic costs associated with this. There are, however, estimates available from the USA, which place figures at approximately US$ 1 billion per year (Ralston et al., 2011). A breakdown of the costs show that US$ 350 million is spent on known marine pathogens and toxins that cause food-
borne diseases; US$ 300 million is spent on seafood-borne diseases with known etiology (i.e.
cases with unknown pathogenic etiology are excluded from this estimation); US$30 million of damage is caused by the Vibrio bacteria; and US$ 300 million is spent on gastrointestinal illnesses arising from bathing in contaminated water (Ralston et al., 2011).
The two primary routes of transmission for marine borne disease are the consumption of contaminated seafood and direct exposure to marine pathogens in the marine environment.
However, a third route of impact on human health - which deserves further attention - is the effect of anthropogenic pollution on the spread, transfer and potential exacerbation of marine-borne illnesses. The following outlines a few examples of the frequently reported illnesses associated with these transmission and impact routes, and the economic data currently available regarding the costs of these illnesses.
Shellfish and other food contamination
Contaminated seafood causes more illnesses per weight consumed than any other food category (CSPI, 2015; Elbashir et al., 2018).
Caused by a variety of bacteria, viruses, parasites and toxins, illnesses can range from mild gastroenteritis to life-threatening symptoms (Iwamoto et al., 2010). Coastal populations are particularly vulnerable to seafood-borne illness, with an average consumption per capita that is 15 times higher than non-indigenous country populations (Cisneros-Montemayor et al., 2016).
6 http://www.fao.org/food/food-safety-quality/scientific-advice/jemra/risk-assessments/vibrio0/en/
While viruses are one of the most common cause of seafood-related infections, bacterial agents have been associated with most hospitalizations and deaths (Butt et al., 2004).
Parasitic infections from seafood consumption seem more uncommon (and less costly) than bacterial or viral infections. However, the actual public health impact posed by parasites via shellfish remains unclear, largely due to severe under-reporting and the lack of data and minimal evidence of infection transmission, globally and locally (Robertson, 2007). Better monitoring is urgently required to understand the risks posed by these food-borne parasites (Singh et al., 2014).
Costs of seafood-borne illness
According to US studies, the acute health care costs resulting from marine-borne pathogens in the USA are estimated at approximately US$1 billion annually (Ralston et al., 2011). This includes US$350 million due to known marine pathogens and toxins that cause food-borne diseases; and US$300 million due to seafood-borne disease with known etiology (cases with unknown pathogenic etiology are excluded from this estimation). Most of the costs of seafood-borne illness are associated with premature deaths (US$300 million), followed by medical care (US$25 million) and lost productivity (US$15 million) (Ralston et al, 20116).
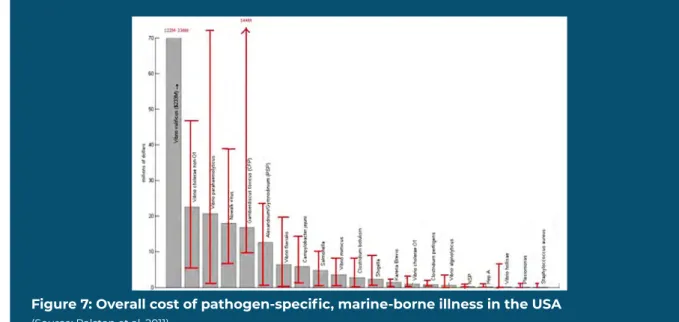
Of all the marine-borne pathogens, Vibrio and Norovirus (Norwalk virus) are among the costliest. Vibrio spp. is the main species involved in seafood-and seawater-borne illness worldwide (with Vibrio vulnificus being the costliest). Enteric viruses, such as human noroviruses are among the most infectious, and one of the main causes of gastroenteritis worldwide (Rincé et al., 2018). Ciguatera Fish-Poisoning (discussed in section 3.3) is the most frequently reported seafood-toxin illness in the world (Friedman et al., 2017), and remains in the top five of costliest illnesses in the USA.
Figure 7: Overall cost of pathogen-specific, marine-borne illness in the USA
(Source: Ralston et al, 2011)
Costs of Vibrio infections
Facts about the Vibrio bacteria
Vibrio bacterial infections are among the most costly seafood-related illnesses in the USA, and post a significant burden on the healthcare sector (Iwamoto et al., 2010). For example, in the USA alone, the annual health costs of seafood related illnesses associated with Vibrio vulnificus, Vibrio parahaemolyticus, Vibrio alginolyticus are estimated to be US$ 350 million (Heng et al., 2017). Studies demonstrate that premature deaths (i.e. death before the age of 75) account for a large proportion of the total treatment costs associated with seafood-related illnesses (US$ 306 million), followed by medical care (US$ 25 million), hospitalization (US$ 6 million), and loss of productivity (US$ 15 million) (Ralston et al., 2011 in Heng et al., 2017).
Despite causing a lower incidence of illness than other bacteria or pathogens, V. vulnificus is a leading cause of seafood-associated fatality, with approximately 95 cases reported with 85 hospitalizations and 35 deaths per year globally (Heng et al., 2017). Just in the USA, V. vulnificus infections account for 45 hospitalizations and 16 deaths annually (Centre for Disease Control, 2013, cited in Ralston et al, 2011). Accordingly, V.vulnificus is recognized as one of the costliest of all marine-borne pathogens, accounting for 66% of seafood-related illness health costs and 26% of the total health costs, one third of the total seafood-related illness and more than 85%
of the costs of direct exposure to the Vibrio pathogen (Heng et al., 2017).
Vibrio cholerae is often transmitted by contaminated drinking water, but the consumption of fish or seafood that has been in contacted with contaminated water can also serve as a frequent transmission route. There are an estimated 1.3 to 4.0 million cases of cholera per year, with 21,000 to 143,000 deaths worldwide (Ali et al, 2015 cited in WHO, 2018e). However, the global health burden and costs of cholera remain largely unknown and possibly underestimated given that most cases are not reported and, in many cases, the specific pathway of exposure to Vibrio cholerae in patients remains unknown (Chowdhury et al., 2016).
Vibrios are common in marine environmental infections especially in warmer regions, where the bacteria thrive (e.g. US southeast coast, South America, Asia), whereas there are fewer cases reported in Europe7. Anthropogenic warming of ocean water, increased coastal flooding and encroachment of saltwater further inland, could further increase the risk of human interaction with pathogenic Vibrio species, such as V. vulnificus, V. cholerae, and V.
parahaemolyticus (Froelich and Daines, 2020).
7 https://earthobservatory.nasa.gov/images/91591/bacteria-thrive-as-ocean-warms
Costs of norovirus virus (NoV)
While rarely causing deaths, some of the milder illnesses from seafood consumption or direct recreational exposure, such as Norovirus(Norwalk virus or NoV), can also be costly.
The third most commonly reported pathogen associated with seafood in the USA (mostly from contaminated shellfish, such as molluscs and raw oysters), NoV causes 29% of all seafood- associated illnesses and 10% of hospitalisations (Iwamoto et al, 2010). In the USA alone, costs are estimated at US$18 million annually to manage an estimated 184,000 cases, making it one of the top five most costly pathogens causing marine-borne illness in the USA (Ralston et al, 2011).
Most incidence and regional distribution data are available for developed countries (including USA, Europe, Japan), with a lack of incidence data from high mortality settings and low-income countries, including for example, significant data gaps in Africa (Kreidieh et al., 2017).
In addition, while considerable global cost and loss data are available regarding NoV associated foodborne diseases, fewer studies quantify the global health and economic burden specifically associated with marine-borne sources (including cases with mild symptoms). Given the significant costs and losses associated with food-borne NoV cases, and the fact that 50% of NoV outbreaks are due to the consumption of contaminated shellfish (Alfano-Sobsey et al., 2012), we conclude that this deserves more detailed monitoring and surveillance. Further studies are recommended to understand the incidence and role exerted by NoV on the burden of diarrheal illnesses resulting from marine-borne sources.
Illnesses from direct marine exposure
With over a million bacteria characterized as being present per mL of seawater, and 10 to 100 times as many viral particles, the risks of developing an infectious disease - from recreational or occupational uses of marine water, or exposure to beach and sand sediment, zooplankton and animals - is very high, but one that remains poorly understood (Young, 2016).
Some of the human pathogens identified in bathing waters include for example: Adenovirus,
Noroviruses, Enteroviruses, Hepatitis A, Escherichia coli, Staphylococcus aureus, Bacteroides spp., Clostridia, Pseudomonas spp., Salmonella spp., Giardia spp and Vibrios spp.
(Young, 2016). There is also growing evidence that beach sand can also harbour harmful microbes such as pathogenic bacteria, viruses and fungi in much larger concentrations that beach water itself; however, little research has been conducted regarding the health outcomes of direct and indirect exposure to differing sand qualities (Sabino et al., 2014, Solo-Gabriele et al., 2016, Abreu et al., 2016).
Spread of marine-borne illness via ballast water
The treatment and discharge of ballast water by ocean-going vessels has the potential to significantly impact human health through the worldwide spread of aquatic invasive species, pathogens (such as V.cholerae) and toxic organisms, such as harmful algae. The significant transfer of ballast water (approximately 2 to 3 billion tonnes per year) from one continent to another and between oceans (Werschkun et al., 2014) poses a significant potential bacteriological risk for all international water routes. In addition, human health can be impacted through occupational and non-occupational exposure (oral, dermal and inhalation) to the disinfection-by-products (DBPs) used for ballast water treatment and disinfection, which can include chlorine (Werschkun et al., 2014). Detailed risk assessments are required to identify the incidence of transmission of pathogens and toxins causing human illness via the various exposure pathways described above; and the economic and health burden that this represents.
It is unclear from current research whether it is possible to contract the COVID-19 virus from exposure to faeces in recreational waters; there are still many unknowns regarding potential transmission of this virus via sewage and wastewater (Carducci et al., 2020).
Anthropogenic pollution - exacerbating human illnesses
While there is significant evidence regarding the human health risks caused by bacterial and viral pathogens and marine toxins, there are much fewer studies to-date regarding how the
consumption and/or exposure to anthropogenic pollutants in the marine environment affect the incidence and human health costs of marine- borne diseases. There is evidence of human infectious diseases being transferred from anthropogenic sources and spreading infections to new populations and geographic locations (Young, 2016). However, there are no data available regarding the economic and health burden that these illnesses represent.
This section outlines a few examples of anthropogenic pollution (e.g. transfer of pathogens via ballast water, synthetic organic chemicals, metals and microplastics), which have the potential to adversely impact human health, cause or exacerbate human illnesses – and which deserve further study in order to understand their scale and magnitude in light of a changing ocean climate, and the health and economic burden that they represent.
Costs of illnesses from direct marine exposure
Given that the symptoms of marine infectious diseases from direct marine exposure (e.g.
gastrointestinal, respiratory, dermatologic, and ear, nose and throat infections) are mild and often self-reported, it is a challenge to understand the true incidence of infection and associated health burden (Sridhar and Deo, 2017). Some studies estimate that approximately 250 million cases of gastroenteritis occur worldwide each year (5 million in the US) as a result of bathing in contaminated water (Ralston et al, 2011), and 50 million or more cases associated with severe respiratory disease (Shuval, 2003).
While rarely causing death, there is evidence that even the milder illnesses caused by direct marine exposure can also be costly. For example, gastrointestinal illness from beach recreation in the USA is estimated to cost US$300 million, with US$30 million from direct marine exposure to the Vibrio species (Ralston et al., 2011).