Influences of Different Pollen Sources on Fruit Quality and Productivity of Chestnut (Castanea mollissima Blume)
in China
Jing Wang,
1)Su-Juan Guo
1,2)【 Summary】
The chestnut (Castanea mollissima Blume) has a very large cultivation area and production in the world and is an important nut species crop worldwide. It is also an important food and timber crop in many parts of China. It is known that pollination plays an important role in the fruit qual- ity and fruit productivity of this species. To investigate its role, 8 locally selected pollen sources were tested for their effect on indicators of fruit quality and fruit productivity of ‘Yanshanzaofeng’
(YSZF) trees. Natural pollination served as the control experiment. Chestnut has the characteristic of alternate year bearing, so data of 2 yr was averaged and used as the final data in the study on chestnut productivity. Cross pollination of these recipient trees by ‘Zipo’ (ZP) pollen led to the highest fruit set at 86.67%, ‘Dabanhong’ (DBH) pollen led to the highest total yield (1.62 kg tree-1),
‘Qianxizhuangli’ (QXZL) pollen resulted in the highest kernel percentage (54.71%), whereas self- pollination resulted in the lowest kernel percentage. Self-pollination led to a heavier single-grain weight than did the other treatments. ZP pollen resulted in the lowest fat and the highest crude pro- tein contents. ‘Qianxizaohong’ (QXZH) pollen resulted in the highest percentage of soluble sugars.
‘Yanshanduanzhi’ (YSDZ) pollen resulted in the highest amylopectin content, and DBH pollen resulted in the highest amylose content. The pollen of DBH and ‘Yanlong’ (YL) ranked best in a comprehensive analysis of all data using a gray relational analysis (GRA), with self-pollination ranking last and natural pollination ranking next to last. Thus, in this study, pollen sources had xe- nia effects in chestnut, and the results suggested proper species DBH and YL as pollination trees for YSZF.
Key words: Castanea mollissima, fruit quality and productivity, fruit set, yield, xenia.
Wang J, Guo SJ. 2018. Influences of different pollen sources on fruit quality and productivity of chestnut (Castanea mollissima Blume) in China. Taiwan J For Sci 33(4):263-75.
1)Key Laboratory for Silviculture and Conservation, Ministry of Education, Beijing Forestry Univ., 35 Tsinghua East Rd., Haidian District, Beijing 100083, China. 北京林業大學教育部森林培育與保
護重點實驗室,100083北京市海澱區清華東路35號。
2)Corresponding author, e-mail:[email protected] 通訊作者。
Received January 2018, Accepted July 2018. 2018年1月送審 2018年7月通過。
研究報告
不同花粉授粉對中國板栗結實特性和果實品質的影響
王靜
1)郭素娟
1,2)摘 要
中國板栗種植面積和產量居世界第一,是世界上重要的果樹之一。同時,板栗也是中國最重要的 木本糧食樹種之一,授粉對果實的品質以及結實能力起著至關重要的作用。試驗選用「燕山早豐」為 母本,8個品種花粉為試材進行雜交授粉試驗,自然授粉為對照組,研究不同品種花粉對果實品質和果 實結實特性的影響。板栗具有隔年結實特性,因此在研究板栗結實特性時取2年平均值作為最終試驗 結果。在雜交實驗中,以「紫珀」為父本授粉後,果實著果率最高為86.67%,以「大板紅」為父本授 粉後,產量(1.62 kg tree-1)最高,「遷西壯栗」為父本結實率(54.71%)最高,以「燕山早豐」為父本即 自交組合結實率最低。與雜交組合相比,自交的單粒重較大。「紫珀」為父本時,果實中脂肪含量最 低,粗蛋白含量最高;「遷西早紅」為父本時,可溶性糖含量最高;「燕山短枝」為父本時,果實中 支鏈澱粉含量最高;「大板紅」為父本時,果實中直鏈澱粉含量最高。使用灰色關聯法對果實品質和 果實結實特性進行綜合排序,以「大板紅」和「燕龍」為父本果實綜合評價最高,自交組合綜合評價 最低, 自然授粉次之。本研究不僅驗證了花粉直感效應對板栗果實品質和結實特性的影響,同時也為燕 山早豐的授粉樹配置提供了理論依據。
關鍵詞:中國板栗、果實品質和結實特性、著果率、產量、花粉直感效應。
王靜、郭素娟。2018。不同花粉授粉對中國板栗結實特性和果實品質的影響。台灣林業科學33(4):263- 75。
INTRODUCTION
The chestnut (Castanea mollissima Blume) is a deciduous tree that belongs to the Fagaceae family and is native to China (Zhang et al. 2011, Zou et al. 2015a). It has been widely used as a food and timber crop in northern China since ancient times (Payne et al. 1983, Zhang et al. 2005). The chestnut can be used as a source of gluten-free flour since it contains essential dietary nutrients and minerals (Bounous and Marinoni 2005, Semih and Llknur 2012), and it has become an increasingly important crop in human nu- trition. Chestnut is also an important nut spe- cies among fruit crops worldwide. The world area of cultivated chestnut is 602,718 ha, and China with 326,479 ha surpasses all other
countries. The world production of chestnut was estimated to be more than 2 million t, with China being the main producer contrib- uting 83.08% to the total yield (1,879,031 of 2,261,589 t, FAOSTAT 2016). Chestnut trees are distributed in over 24 provinces in south- ern and northern China. In many hilly areas of China, the chestnut can be the principle source of income for many rural families (Shi and Stösser 2005). In general, chestnut can both provide healthy, nutritious food to hu- mans and serve as a major source of income for farmers (Martín et al. 2012, Zou et al.
2013, 2015a). In addition, the chestnut is con- sidered a gene center for the genus Castanea (Vavilov 1951).
Chestnut is hermaphroditic, with both male and female flowers on the same tree.
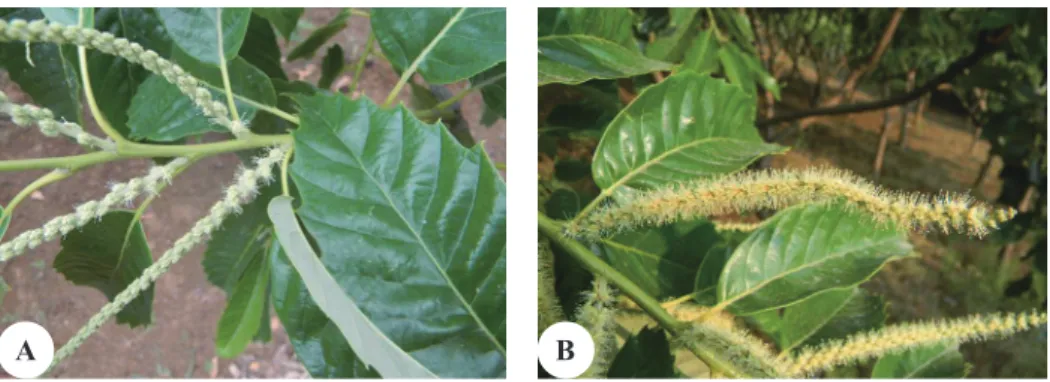
Chestnut is characterized by catkins and can be divided into unisexual flowers (Fig. 1) and bisexual flowers (Fig. 2). Unisexual flowers are male flowers, sessile, monochlamydeous, with 5~7 male flowers in a cluster, with slight filaments. Bisexual flowers are mixed inflo- rescences; the top of the inflorescence con- sists of male flowers, while the bottom has 1~3 female flowers. The female flower has a narrow-neck bottle configuration and is ses- sile (Zhang et al. 2011).
Chestnut is a self-incompatible (and wind pollinated) and cross-pollinated plant.
The chestnut self-fertilization rate is < 1%
(Mckay 1942). Self-pollination can seriously reduce chestnut production (Guo et al. 2013,
Lv et al. 2013). Chestnuts exhibits a set of flo- ral features that tends to promote outcrossing (Klinac et al. 1995). Cross-pollination with other cultivars has to be provided to ensure satisfactory yields (Shi and Stősser 2005).
Fruit development of chestnut can be in- fluenced by pollen, through the ‘xenia effect’, which was first described by Focke (1881).
The xenia effect can cause changes in fruit form and size (xenoplasm) and in fruit color (xenochroms). Xenia provides a theoretical basis for the pollination tree configuration, fruit quality improvement, and advances in economic returns. Based on the importance of xenia, many scholars have studied its mechanism, including changes in endogenous hormone contents, isoenzyme variations, mo- lecular biology, and so on. So far, there is no
Note: A. Initial flowering stage. B. Full-bloom stage.
Fig. 1. Male catkin of chestnut.
A B
Note: Initial flowering stage. B. Full-bloom stage.
Fig. 2. Male and female mixed inflorescence of chestnut.
A B
consistent conclusion about the mechanism of xenia (Yang 2012). The xenia effect was shown in studies on cross-pollination in al- mond (Kumar and Das 1996). Pollen sources have an effect on seeds and fruits in many crop species (Denney 1992), such as chestnut (McKay and Crane 1939), pear (Nyeki 1972), pistachio (Crane and Iwakiri 1980), apple (Ruth and Williams 1983), and pecan (Mar- quard 1988). In Mckay and Crane’s (1939) study, hybridization experiments with 3 spe- cies of chestnut showed that 2 different pollen sources produced nuts of different sizes with mean weights of 18.7 and 27.1 g, respective- ly, on the same tree.
The aim of this study was to evaluate the degree to which pollination by different cultivars influences both fruit productivity and fruit quality of chestnut (C. mollissima Blume).
MATERIALS AND METHODS Plant materials, pollination, and experi- mental design
This study was carried out at the experi- mental base of Beijing Forestry Univ. (Qianxi County, Hebei Province, China), during the growth seasons (May to September) of 2 con-
secutive years, 2014 and 2015. The elevation of the experimental base is 163 m (118°12′E, 40°21′N), and the area is semi-humid, with a mean annual precipitation of 744.7 mm and a mean annual temperature of 10.9℃ (Zou et al. 2013, Guo and Zou 2014). The soil is rich, with available N, P, and K contents of 75, 24, and 234 mg kg-1, respectively (Li et al. 2013).
Twelve-year-old chestnut trees (C.
mollissima, ‘Yanshanzaofeng’ (YSZF)), planted at a spacing of 3×4 m, were used as female parents. Pollen was obtained from a germplasm nursery in Qianxi County, Hebei Province, China. Table 1 introduces 8 culti- vars (Wang et al. 2008, Hebei Province For- estry Bureau 2016), and 7 cultivars were se- lected as pollinizers for the cross-pollination treatment: ‘Qianxizaohong’ (QXZH), ‘Qianx- izhuangli’ (QXZL), ‘Yanlong’ (YL), ‘Yankui’
(YK), ‘Zipo’ (ZP), ‘Dabanhong’ (DBH), and ‘Yanshanduanzhi’ (YSDZ). We selected female trees of YSZF for the self-pollination treatment. Natural pollination by CK served as the control experiment.
The experiment was conducted in a com- pletely randomized block design with 8 treat- ments (pollen sources), 3 replicates (3 female trees per plot), and a total of 72 trees each year in Qianxi County, Hebei Province, China.
Table 1. Information of 8 chestnut (Castanea) cultivars
Cultivars Type Number Soluble sugars Starch Crude protein
(%) (%) (%)
C. Yanshanzaofeng (YSZF) cultivar JiS-SV-CM-002-2005 19.69 51.34 4.43 C. Qianxizaohong (QXZH) cultivar JiS-SV-CM-014-2013 19.5 49.3 6.96 C. Qianxizhongli (QXZL) cultivar JiR-SV-CM-001-2013 21.5 49.6 5.89 C. Yanlong (YL) cultivar JiS-SV-CM-003-2009 22.6 48.2 6.01 C. Yankui (YK) cultivar JiS-SV-CM-001-2005 21.2 51.98 3.72
C. Zipo (ZP) cultivar JiS-SV-CM-001-2004 37.6 (total sugars) 38.26 23.22 (protein) C. Dabanhong (DBH) cultivar JiS-SV-CM-004-2005 20.44 61.22 4.82
C. Yanshanduanzhi (YSDZ) cultivar JiS-SV-CM-003-2005 20.57 50.85 5.89 Qianxi 15 Superior
individual
To prevent uncontrolled pollination, clus- ters of unopened female flowers were covered with paper bags. Male catkins containing pollen from the 8 cultivars targeted for test- ing were harvested at a germplasm repository in late May and early June. Hand pollination was carried out in June (1~3 June 2014, and 7~9 June 2015) at 04:00~06:00. The female flower clusters were then re-covered with the paper bags until all male flowers in the experimental plots had withered and were no longer fertile (Zou et al. 2015b).
Measurements and data collection
In early July of each year—1 mo after the experimental pollination in early June—
the number of fruits that had set was recorded for each female flower cluster per tree. Fruits were harvested for further analysis in early autumn after burs had begun to open. The following data were collected: (1) number of fruits in each bur; (2) single fruit weight (g);
and (3) total yield (kg). These productivity data were analyzed as follows: (1) fruit set percentage (%) as (number of fruit×100) (number of flowers pollinated)-1; (2) kernel percentage (%) as (fruit weight×100) (total weight)-1; and (3) total yield per tree (kg) as the kernel percentage (%)×total bur weight (g)×1000-1.
Further, fruit quality was estimated by calculating contents of fat, soluble sugars, crude protein, amylose, and amylopectin.
Stored samples (1.000 g) were used to deter- mine the fat content using a Soxhlet apparatus for 6 h (AOAC 1990). Total soluble sugar was determined by the anthrone colorimetric method (ultraviolet spectrophotometer at a 620-nm absorbance wavelength) with defat- ted samples (0.200 g) (Zou et al. 2015a). To determine the amylose and amylopectin con- tents in the samples, we used dual-wavelength spectrophotometry (0.200 g), with an ultra-
violet spectrophotometer to scan all bands, run absorbance curves for amylose and amy- lopectin, and confirm the amylose and amy- lopectin maximum absorbance wavelengths, λ1 and λ3. We used isoabsorptive point map- ping to confirm the amylose and amylopectin absorbances of λ2 and λ4, and used Δλ =∣λ1 - λ2∣as the ordinate and the content of ordi- nate amylose (mg) as the abscissa to draw a standard amylose curve. Through use of the standard curve, we calculated the content of amylose. The content of amylopectin was calculated the same as for amylose. The level of crude protein was determined by the con- tent of N*6.25, while the content of N was measured using Auto Analyzer 3 (AA3 High Resolution). Three replicates were performed for each treatment in these assays.
Statistical analysis
Duncan’s multiple-range test and Pear- son’s correlation coefficient test were run using SPSS 21.0 software (SPSS, Chicago, IL, USA). Means were first compared by Duncan’s multiple-range test at 0.05, and then Pearson’s correlation coefficients were calcu- lated at 0.01 and 0.05. The GRA method was used to select high-quality pollination trees by ranking them using a comprehensive set of fruit productivity and quality characteristics.
The GRA methodology, developed on the basis of gray system theory (Deng 1989), has been broadly applied to evaluate intrinsic in- terrelationships among multiple variables (Hu et al. 2016). The GRA was used in this study with each treatment considered one of the fac- tors in the GRA, and the gray relational grade (GRG) was obtained to assess the relation- ship between pollen sources and fruit quality parameters. (1) To normalize comprehensive fruit characteristics, Yij, is expressed as Yij = Xij /Xoj, where Xij is the original parameter, i
= 1, 2……m, and j = 1, 2……n; and X0j is the
ideal treatment, defined as the highest value of any single parameter. Other treatments were defined as comparison treatments, X1~X8. In this study, m is the number of pollen sources, and n is the number of comprehensive fruit characteristics. (2) The gray relational coef- ficient, λij, was calculated as follows: λij =
, where yi0
is the ideal normalized result for the ith pa- rameter; and ρ is a distinguishing coefficient, which can be set from 0 to 1, and was set as 0.5 in this study (Wang et al. 2015). (3) The GRG was used in this study to assess relationships between a pollen source and all recorded fruit characteristics, and was carried out using the equation Ri = Σi=1m wyλij, where Ri is the GRG for the jth treatment; wy is the weighting fac- tor for the ith parameter, and m is the number of fruit quality parameters. The GRA was calculated using Excel 2013 (Microsoft, Red- mond, WA, USA).
RESULTS Fruit productivity
An analysis of combined data from this
2-yr study revealed that the pollen source sig- nificantly influenced the fruit set, total yield, number of fruits per bur, kernel percentage, and single-grain weight (Table 2). Because of alternate bearing in chestnut, the average of results from 2 yr is also shown in Table 2.
Fruit set ( ) and total yield (kg tree-1):
In this study, the pollen source significantly (r = -0.389, p < 0.01) influenced the aver- age fruit set over 2 yr (Table 2). Fruit set of the recipient YSZF trees ranged from a low of 38.89% (with YK pollen in 2014) to the highest value of 97.78% (with DBH pollen in 2015), whereas self-pollination resulted in the lowest fruit set of 15.56% in 2014 and 22.22% in 2015. Averaging data of 2 yr re- sulted in the highest fruit set of 86.67% with ZP pollen, while the lowest was 18.89% with self-pollination. Fruit set of natural pollina- tion was in the middle range.
The total yield significantly (r = -0.317, p < 0.05) differed among pollen sources (Table 2), ranging from 1.07 (with YSDZ in 2014) to 2.10 kg tree-1 (by DBH in 2015). Self-pollina- tion resulted in the lowest yield 0.53 and 0.59 kg tree-1 in 2014 and 2015, respectively. Self- pollination resulted in the lowest yield 0.56 kg tree-1 in a 2-yr average, while DBH pollen Table 2. Effects of 8 pollen sources on chestnut fruit productivity in 2014 and 2015
Pollen Fruit set Total yield Fruits bur-1 Kernel Single-grain (%) (kg tree-1) (N) percentage (%) weight (g) source
2014 2015 Avg. 2014 2015 Avg. 2014 2015 Avg. 2014 2015 Avg. 2014 2015 Avg.
QXZH 77.78cd 94.44ab 86.11a 1.21fgh 1.24fgh 1.23a 2.57a 2.47ab 2.52a 48.50def 50.79d 49.65abc 5.34fg 7.08cde 6.21a QXZL 61.11f 90.00b 75.56a 1.21fgh 1.73bc 1.47a 2.27ab 2.57a 2.42a 47.40def 62.01a 54.71a 4.98gh 6.74de 5.86a YL 72.22de 91.11ab 81.67a 1.19fgh 1.86b 1.53a 2.63a 2.63a 2.63a 49.97de 54.36c 52.17ab 4.22hi 8.68ab 6.45a YK 38.89g 58.89f 48.89b 1.13gh 1.56cd 1.35a 2.53a 2.27ab 2.40a 46.61ef 57.43bc 52.02ab 3.85i 6.85cde 5.35a ZP 82.22c 91.11ab 86.67a 1.15gh 1.36ef 1.26a 2.07cd 1.67cd 1.87b 43.03g 46.35efg 44.69c 4.57ghi 8.62ab 6.60a DBH 75.56cd 97.78a 82.78a 1.13gh 2.10a 1.62a 2.63a 2.4ab 2.52a 49.93de 58.01b 53.97ab 4.65ghi 7.24cd 5.95a YSDZ 58.89f 90.00b 74.45a 1.07h 1.30fg 1.19a 2.63a 2.33ab 2.48a 48.35def 46.78ef 47.57bc 5.13fgh 7.82bc 6.48a YSZF 15.56h 22.22h 18.89c 0.53i 0.59i 0.56b 0.30d 0.37d 0.34c 31.82h 28.12i 29.97d 6.04ef 8.82a 7.43a CK 65.67ef 73.44d 69.56a 1.10gh 1.52de 1.31a 2.07bc 1.70b 1.89b 45.44fg 48.02de 46.73bc 4.50ghi 6.39de 5.45a In each column, means followed by different superscript letters significantly differ at the 0.01 level according to Duncan’s multiple-range test.
Pollen sources are defined in Table 1.
resulted in the highest yield of 1.62 kg tree-1. There was a negative correlation (r = -0.582, p < 0.01) between the pollen source and the total yield in 2014, and a negative correlation (r = -0.317, p < 0.05) for the average of 2 yr (Table 3). There were positive correlations (r
= 0.792/2014, r = 0.690/2015, r = 0.750/avg., p < 0.01) between fruit set and total yield (Table 3).
Number of fruits bur-1: The number of fruits bur-1 was higher with cross-pollination (by 1.67 to 2.63) than with self-pollination (by 0.30 to 0.37) (Table 2). Fruits bur-1 by natural pollination was in a middle range. Negative correlations (r = -0.486/2014, p < 0.01, r = -0.640/2015, r = -0.551/avg., p < 0.01) were found between the pollen source and fruits bur-1. Fruits bur-1 was positively correlated with fruit set (r = 0.703/2014, r = 0.857/2015, r = 0.692/avg., p < 0.01) and total yield (r = 0.888/2014, r = 0.752/2015, r = 0.613/avg., p
< 0.01) (Table 3).
Kernel percentage ( ): In this study, kernel percentage was negatively affected by the pollen source (r = -0.465/2014, r = -0.556/2015, r = -0.483/avg., p < 0.01); val- ues ranged from a low of 28.12% (with self- pollination in 2015) to the highest of 62.01%
(by QXZL in 2015) (Table 2). Kernel percent- ages for YL, YK, DBH, and QXZL, which ranged 54.36~62.01%, were significantly
greater than those with pollen sources from QXZH, ZP, and YSDZ and natural pollination in 2015. After averaging 2014 and 2015 data, the QXZL pollen source had the highest ker- nel percentage with 54.71%. Self-pollination resulted in the lowest kernel percentages of 31.82% in 2014, 28.12% in 2015, and 29.97%
on average. The kernel percentage was posi- tively correlated with fruit set (r = 0.712/2014, r = 0.694/2015, r = 0.719/avg., p < 0.01), total yield (r = 0.891/2014, r = 0.877/2015, r
= 0.874/avg., p < 0.01), and fruits bur-1 (r = 0.951/2014, r = 0.865/2015, r = 0.801/avg., p
< 0.01) (Table 3).
Single-grain weight (g): The single- grain weight of chestnut was not significantly affected by the pollen source (Table 2). The highest single-grain weights, 6.04 and 8.82 g, were observed during 2014 and 2015 with self-pollination. The single-grain weight with natural pollination was next to last in 2014 and last in 2015. Natural pollination also was next to last in the 2-yr averages. Pollen sourc- es of YL, YSDZ, and ZP resulted in heavier grain weights in 2015. The crossing treatment with pollen of YL and ZP showed higher sin- gle-grain weights and significant differences compared to those from the pollen of QXZH, QXZL, YK, DBH, and YSDZ (p < 0.05) in 2015, but the pollen of YL and ZP did not show a higher single-grain weight compared Table 3. Pearson’s correlation coefficient for chestnut fruit productivity
Pollen source Fruit set Total yield Fruit number Kernel percentage 2014 2015 Avg. 2014 2015 Avg. 2014 2015 Avg. 2014 2015 Avg. 2014 2015 Avg.
Fruit set -0.371 -0.465* -0.389** 1 1 1
Total yield -0.582** -0.287 -0.317* 0.792** 0.690** 0.750** 1 1 1
Fruit -0.468* -0.640** -0.551** 0.703** 0.857** 0.692** 0.888** 0.752** 0.613** 1 1 1 number
Kernel -0.465* -0.556** -0.483** 0.712** 0.694** 0.719** 0.891** 0.877** 0.874** 0.951** 0.865** 0.801** 1 1 1 percentage
Single-grain 0.134 0.109 0.062 -0.332 -0.247 0.191 -0.474* -0.369 0.257 -0.539** -0.348 -0.290* -0.473* -0.607** -0.021 weight
Data from both study years are combined.
* Significant at p < 0.05; ** significant at p < 0.01.
to the other pollen sources in 2014. In 2014, self-pollination resulted in a higher single- grain weight than did cross-pollination (p <
0.05). In the 2-yr average, self-pollination had the highest single-grain weight, while the YK pollen source had the lowest weight. The single-grain weight was negatively correlated with fruits bur-1 (r = -0.539/2014, p < 0.01, r = -0.290/avg., p < 0.05), total yield (r = -0.474/2014, p < 0.05), and kernel percentage (r = -0.473/2014, p < 0.05, r = -0.607/2015, p < 0.01) (Table 3). The single-grain weight was not correlated with the pollen source, fruit set, total yield, or kernel percentage for the 2-yr average.
Fruit quality
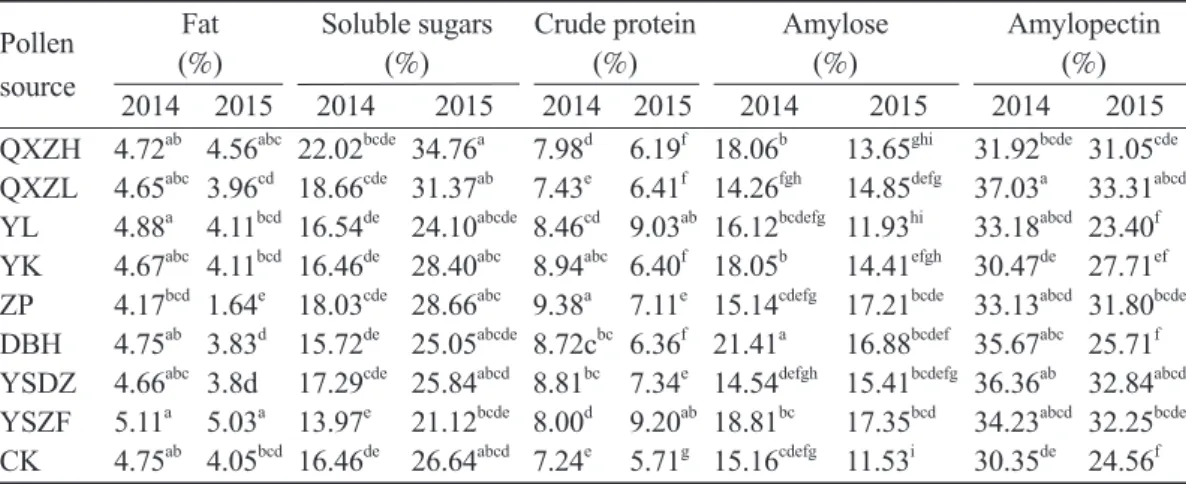
Analyses of fruit quality indicators showed that the pollen source played an important role in fat, soluble sugar, crude protein, amylose, and amylopectin contents (Table 4).
Fat ( ): Self-pollination resulted in the greatest fat percentage in 2014/2015 (5.11/
5.03%) compared to cross-pollination treat- ments (Table 4). ZP pollen had significantly
lower fat (4.17/1.64%) compared to the other treatments in both seasons. The fat percent- age of natural pollination was in the middle.
Interestingly, the fat percentage in 2014 was higher than that in 2015 from the same pollen sources. There was no significant relationship between fat contents and the pollen source (Table 5).
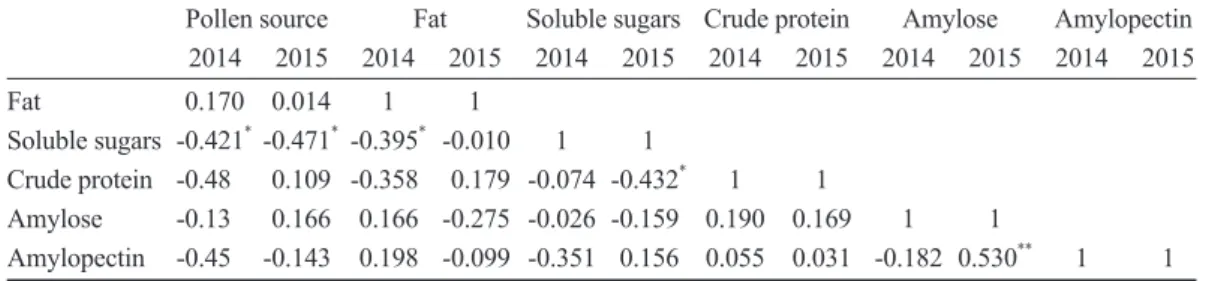
Soluble sugars ( ): Natural pollina- tion resulted a middle range of soluble sugar contents. QXZH pollen resulted in the highest percentages of soluble sugars in 2014/2015 (22.02/34.76%), while self-pollination re- sulted in the lowest soluble sugar percent- ages (13.97/21.12%). The soluble sugar content had negative correlations with the pollen source (r = -0.421/2014, p < 0.05; r
= -0.471/2015, p < 0.05), and with fat (r = -0.395/2014, p < 0.05) (Table 5).
Crude protein ( ): In 2014, ZP pollen resulted in the highest crude protein content (9.38%) among all treatments, whereas in 2015, self-pollination resulted in the high- est content (9.20%). Natural pollination resulted in the lowest crude protein contents in 2014/2015 (7.24/5.71%). Crude protein
Table 4. Effects of 8 pollen sources on chestnut fruit quality in 2014 and 2015
Pollen Fat Soluble sugars Crude protein Amylose Amylopectin (%) (%) (%) (%) (%) source 2014 2015 2014 2015 2014 2015 2014 2015 2014 2015 QXZH 4.72ab 4.56abc 22.02bcde 34.76a 7.98d 6.19f 18.06b 13.65ghi 31.92bcde 31.05cde QXZL 4.65abc 3.96cd 18.66cde 31.37ab 7.43e 6.41f 14.26fgh 14.85defg 37.03a 33.31abcd YL 4.88a 4.11bcd 16.54de 24.10abcde 8.46cd 9.03ab 16.12bcdefg 11.93hi 33.18abcd 23.40f YK 4.67abc 4.11bcd 16.46de 28.40abc 8.94abc 6.40f 18.05b 14.41efgh 30.47de 27.71ef ZP 4.17bcd 1.64e 18.03cde 28.66abc 9.38a 7.11e 15.14cdefg 17.21bcde 33.13abcd 31.80bcde DBH 4.75ab 3.83d 15.72de 25.05abcde 8.72cbc 6.36f 21.41a 16.88bcdef 35.67abc 25.71f YSDZ 4.66abc 3.8d 17.29cde 25.84abcd 8.81bc 7.34e 14.54defgh 15.41bcdefg 36.36ab 32.84abcd YSZF 5.11a 5.03a 13.97e 21.12bcde 8.00d 9.20ab 18.81bc 17.35bcd 34.23abcd 32.25bcde CK 4.75ab 4.05bcd 16.46de 26.64abcd 7.24e 5.71g 15.16cdefg 11.53i 30.35de 24.56f In each column, means followed by different superscript letters significantly differ at the 0.05 level according to Duncan’s multiple-range test.
Pollen sources are defined in Table 1.
showed a negative correlation with soluble sugars (r = -0.432/2015, p < 0.05) (Table 5).
Amylose and amylopectin ( ): QXZL pollen resulted in the highest amylopectin contents in 2014/2015 (37.03/33.31%), but low amylose contents (14.26/14.58%) (Table 4). Natural pollination resulted in the low- est amylose content in 2015 (11.53%) and amylopectin contents in 2014 and 2015 (30.35/24.56%). The same pollen sources re- sulted in higher amylopectin contents in 2014 than in 2015. A positive correlation was ob-
served between amylose and amylopectin (r = 0.530/2015, p < 0.01) (Table 5). Amylose and amylopectin were not significantly correlated with each other.
Rankings of comprehensive fruit pro- ductivity and fruit quality by the GRA
Referring to the results of the GRA (Table 6) method, because natural pollination (CK) was next to last, it is necessary to con- figure pollination for chestnut trees. Cross- pollination with pollen sources of DBH and Table 5. Pearson’s correlation coefficient for chestnut fruit quality
Pollen source Fat Soluble sugars Crude protein Amylose Amylopectin 2014 2015 2014 2015 2014 2015 2014 2015 2014 2015 2014 2015
Fat 0.170 0.014 1 1
Soluble sugars -0.421* -0.471* -0.395* -0.010 1 1 Crude protein -0.48 0.109 -0.358 0.179 -0.074 -0.432* 1 1 Amylose -0.13 0.166 0.166 -0.275 -0.026 -0.159 0.190 0.169 1 1
Amylopectin -0.45 -0.143 0.198 -0.099 -0.351 0.156 0.055 0.031 -0.182 0.530** 1 1 Data from both study years are combined.
* Significant at p < 0.05; ** significant at p < 0.01.
Table 6. Ranking of comprehensive chestnut fruit productivity and fruit quality by the gray relational analysis (GRA) method, and correlation coefficient and relational degree of all treatments
Y1 Y2 Y3 Y4 Y5 Y6 Y7 Y8 Y9 Y10 Rj Rank of Rj
λ1 0.98 0.62 0.90 0.81 0.72 0.82 1.00 0.67 0.69 0.79 0.83 4 λ2 0.75 0.81 0.83 1.00 0.66 0.72 0.77 0.65 0.62 1.00 0.84 3 λ3 0.87 0.88 1.00 0.89 0.76 0.77 0.58 1.00 0.59 0.67 0.86 2 λ4 0.47 0.70 0.82 0.89 0.59 0.74 0.65 0.76 0.72 0.69 0.68 7 λ5 1.00 0.64 0.65 0.68 0.82 0.48 0.69 0.87 0.72 0.84 0.80 5 λ6 1.00 1.00 0.90 0.97 0.67 0.72 0.58 0.74 1.00 0.75 0.94 1 λ7 0.73 0.59 0.87 0.75 0.76 0.70 0.62 0.84 0.64 0.96 0.76 6 λ8 0.33 0.37 0.31 0.46 1.00 1.00 0.51 0.96 0.83 0.87 0.52 9 λ9 0.66 0.68 0.58 0.73 0.60 0.75 0.62 0.63 0.56 0.64 0.67 8 wy 0.29 0.21 0.09 0.15 0.06 0.02 0.03 0.02 0.04 0.11
Y1, fruit set; Y2, total yield; Y3, fruits bur-1; Y4, kernel percentage; Y5, single-grain weight; Y6, fat percentage; Y7, soluble sugar percentage; Y8, crude protein percentage; Y9, amylose percentage; Y10, amylopectin percentage; λ1~λ9, correlation coefficients of pollen sources (QXZH, QXZL, YL, YK, ZP, DBH, YSDZ, self-pollination, CK, respectively); Rj, weighted correlation; wy, final weighting by the AHP method.
Pollen sources are defined in Table 1.
YL ranked first and second, which means that choosing DBH and YL as pollination trees can result in higher fruit productivity and bet- ter fruit quality. In this study, self-pollination was last, a manifestation of chestnut self- incompatibility.
DISCUSSION Fruit productivity
It is well known that successful fruit set in chestnut depends on both pollination and subsequent fertilization. Results of fruit set in the 2 seasons studied (Table 2) agreed with the findings of other authors (Fattahi et al. 2014). In a 2-yr average, self-pollination also had the lowest fruit set, total yield, fruits bur-1, kernel percentage, and highest single- grain weight. The reduced fruit set with self-pollination can be explained by self- incompatibility, a well-known phenomenon in chestnut. Fruit sets caused by all pollen sourc- es were higher in 2015 than in 2014, which may have been caused by biennial fruiting.
Self-incompatibility can seriously reduce chestnut production (Lv et al. 2013). In their study, self-pollination had the lowest yield.
Their study also configured pollination trees for YSZF, and they selected Qianxi 15 and DBH as pollination trees for YSZF. Results of the total yield also showed that the same pol- len source (DBH) led to higher yields.
Results of the number of fruits bur-1 showed that cross-pollination produced more fruits bur-1 than did self-pollination in 2014 and 2015, and for the 2-yr average. Self- pollination resulted in more unfertilized burs than did cross-pollination, which might have been a result of self-incompatibility. The ker- nel percentage is one of the most important parameters used in evaluating variables such as yield, variety, and pollination tree configu- ration. This result is similar to those shown
in previous studies on hazelnut and almond (Hossein-Ava et al. 2006, Bahmani et al.
2002). Single-grain weights in all treatments were lower in 2014 than in 2015, which might have been an effect of the biennial bearing of fruit or environmental conditions. In 2014, a lack of rain in August influenced the fruit- expansion process. Through a correlation analysis in Table 3, a significant or highly sig- nificant relationship existed among the pollen source, fruit set, total yield, fruits bur-1, and kernel percentage in 2-yr average values.
Fruit quality
Results of fat contents showed that chestnut has a low fat content (Table 4). This characteristic has led to its increased use in low-calorie diets (Anonymous 2012, Ertürk et al. 2006). Soluble sugar percentages change from 1 season to the next. Contents of soluble sugars in 2015 were generally higher than those with the same treatments in 2014 (Table 4). A higher protein content is an important parameter in chestnut production in terms of essential amino acids (Morrone et al. 2015).
ZP, QXZH, and YSZF pollen resulted in the highest crude protein contents in 2014 and 2015. Starch is the main constituent of chestnuts (Borges et al. 2008, Liu et al. 2015, Pereira- Lorenzo et al. 2006), and is deter- mined by assaying amylose and amylopectin contents. QXZL pollen resulted in the high- est amylopectin contents in 2014 and 2015, while natural pollination resulted in the low- est amylose content in 2015 and amylopectin contents in 2014 and 2015.
Rankings of comprehensive fruit pro- ductivity and fruit quality by the GRA
In chestnut production, farmers expect to get higher yields and improved quality to boost incomes. The GRA method had a score ranking to synthetically quantify and evaluate
the influence of different pollen sources on chestnut fruit productivity and fruit quality parameters. DBH and YL were selected as pollination trees for YSZF.
CONCLUSIONS
It is known that the pollen source affects fruit productivity and fruit quality in several kinds of nut crops. Proper selection of pollen sources has the potential to modify and improve fruit production from year to year as shown in previous studies. In this study, DBH and YL pollen sources ranked best in comprehensive fruit characteristics according to the GRA, whereas self-pollination ranked last. Thus, it can be concluded that pollen sources have xenia effects in chestnut, and self-pollination and cross-pollination influence the fruit quality and productivity. Moreover, this study helped choose DBH and YL as pollination trees for YSZF, a leading chestnut cultivar in China.
ACKNOWLEDGEMENTS
The authors would like to thank the help- ful comments and suggestions of the teach- ers and colleagues in the Key Laboratory for Silviculture and Conservation, Ministry of Education, Beijing Forestry Univ. We also thank Beijing Forestry Univ. for providing technical support in determining fruit quality.
We also acknowledge support for the project by the Special Funds of National Forestry Public Welfare Major Foundation of China (grant no. 201204401) and Twelfth Five- Year Plan in National Science Key Technol- ogy of Non-wood Cultivation (grant no.
2012BAS1B0402).
LITERATURE CITED
Abdullah L, Jaafar S, Taib I. 2013. Ranking
of human capital indicators using analytic hier- archy process. Proc Soc Behav Sci 107:22-8.
Anonymous. 2012. ‘Dr. Decuypere’s nutri- ent charts’ nuts and seeds chart. Available at https://www.health-alternatives.com/chestnuts- nutrients.html. Accessed on 05 09 2012.
AOAC. 1990. Official methods of analysis.
15th ed. Washington, DC: Association of Of- ficial Analytical Chemists.
Bahmani A, Gregorian A, Valizadeh M, Vez- vaei A. 2002. Effect of pollen type and nature on fruit size and certain tasting characteristics of almond kernel (Prunus amygdalus Btsch).
Iranian J Agric Sci 33:296-8. [in Persian].
Borges O, Goncalves B, Carvalho JLS, Cor- reia P, Silva P. 2008. Nutritional quality of chestnut (Castanea sativa Mill.) cultivars from Portugal. Food Chem 106:976-84.
Bounous G, Marinoni DT. 2005. Chestnut:
botany, horticulture and utilization. Horticult Rev 31:291-347.
Crane JC, Iwakiri BT. 1980. Xenia and metaxenia in pistachio. HortScience 15:184-5.
Deng J. 1989. Introduction to grey system theory. J Grey Syst 1(1):1-24.
Denney JO. 1992. Xenia includes metaxenia.
HortScience 27:722-8.
Ertürk Ü, Mert C, Soylu A. 2006. Chemi- cal composition of fruits of some important chestnut cultivars. Braz Arch Biol Technol 49(2):183-8.
FAOSTAT. 2016. Food and Agriculture Orga- nization of the United Nations. In: FAOSTAT Database. Available at: http://www.fao.org/
faostat/en/#data/QC. Accessed on 15 02 2017.
Fattahi R, Mohammadzedeh M, Khadivi- Khub A. 2014. Influence of different pollen sources on nut and kernel characteristics of hazelnut. Sci Horticult 174:15-9.
Focke WO. 1881. Die Pflanzen-Mischlinge:
ein Beitrag zur Biologie der Gewächse. Berlin, Germany: Borntraeger. p 510-8.
Guo SJ, Lv WJ, Xiong H, Zou F. 2013.
Changes in endogenous hormone contents of ovary after pollination of chestnut. J Northwest For Univ. 28(6):56-62 [in Chinese with Eng- lish abstract].
Guo SJ, Zou F. 2014. Observation on the pis- tillate differentiation of chestnut (Castanea) cultivar ‘Yanshanzaofeng’. J Chem Pharm Res 6(1):686-90.
Hebei Province Forestry Bureau 2016.
Available at http://www.hebly.gov.cn/list.
php?sortid=18. Accessed on 29 01 2016.
Hossein-Ava S, Imani A, Makhof M. 2006.
An investigation of percentage of dichogamy and selection of the best pollinizer for com- mercial varieties of hazel-nut. Iran J Agric Sci 37(2):370-80.
Hu Y, Deng L, Chen J, Zhou S, Liu S, et al.
2016. An analytical pipeline to compare and characterise the anthocyanin antioxidant ac- tivities of purple sweet potato cultivars. Food Chem 194:46-54.
Klinac DJ, Lelieveld JF, Knowles RD. 1995.
Time of flowering and pollination in some New Zealand chestnut selections, and intro- duced cultivars. New Zeal J Crop Hort 23:331- 40.
Kumar K, Das B. 1996. Studies on xenia in almond (Prunus dulcis (Miller) D. A. Webb). J Horticult Sci 71:545-9.
Li GH, Guo SJ, Zou F. 2013. Effect of foliage application of trace elements on chestnut yield.
Acta Agric Univ. Jiangxiensis 35(3):491-5. (in Chinese with English abstract).
Liu C, Wang SJ, Chang XD, Wang S. 2015.
Structural and functional properties of starches from Chinese chestnuts. Food Hydrocoll 43:
568-76.
Lv WJ, Guo SJ, Zou F, Xiong H, Li GH.
2013. Changes in polyamine contents of ovary during pollination and fertilization periods of chestnut. J Northwest For Univ. 28(5):109-14.
(in Chinese with English abstract).
Marquard RD. 1988. Outcrossing rates in pe-
can and the potential for increased yields. Am Soc Horticult Sci 113:84-8.
Martín MA, Herrera MA, Martín LM.
2012. In situ conservation and landscape ge- netics in forest species. Nat Resourc Devel 2:
1-5.
McKay JW. 1942. Self-sterility in the Chinese chestnut (Castanea mollissima). Proc Am Soc Horticult Soc 41:156-61.
McKay JW, Crane HL. 1939. The immedi- ate effect of pollen on the fruit of the chestnut.
Proc Am Soc Horticult Sci 36:293-8.
Morrone L, Dall’Asta C, Silvanini A, Cirlini M, Beghè D, Fabbri A, Ganino T. 2015. The influence of seasonality on total fat and fatty acids profile, protein and amino acid, and an- tioxidant properties of traditional Italian flours from different chestnut cultivars. Sci Horticult 192:132-40.
Nyeki J. 1972. Metaxenia studies of pear vari- eties. Acta Agron Budapest 21:75-80.
Payne JA, Jaynes RA, Kays SJ. 1983. Chi- nese chestnut production in the United States:
practice, problems and possible solutions.
Econ Bot 37(2):187-200.
Pereira-Lorenzo S, Ramos-Cabrer AM, Dıaz-Hernandez MB, Ciordia-Ara M, Rios- Mesa D. 2006. Chemical composition of chest- nut cultivars from Spain. Sci Horticult 107:
306-14.
Ruth MC, Williams RR. 1983. Comparison of the compatibility and metaxenia effects of several desert apple and ornamental (Malus) cultivars with Cox’s orange Pippin. J Horticult Sci 58:343-7.
Semih O, Llknur S. 2012. Phenolic com- pounds and antioxidant activities of chestnut (Castanea sativa Mill.) fruits. Quality Assur- ance Safety Crops Foods 4:199-205.
Shi Z, Stösser R. 2005. Reproductive biol- ogy of Chinese chestnut (Castanea mollissima Blume). Eur J Horticult Sci 70(2):S96-103.
Vavilov I. 1951. The origin, variation, im-
munity and breeding of cultivated plants. New York: Ronald.
Wang TK, Qi YS, Zhang JZ, Li C. 2008. A new chestnut cultivar ‘Yanlong’. Acta Horti- cult Sin 35(12):1851.
Wang X, Li Z, Xing Y. 2015. Assessing the response of yield and comprehensive fruit quality of tomato grown in greenhouse to defi- cit irrigation and nitrogen application strate- gies. Agric Water Manage 161:53-64.
Yang LQ. 2015. Effect of pollen xenia on the fruit quality of kiwifruit, ’Bruno’ and ‘White’.
Zhejiang, China: Zhejiang Normal Univ. p 10- 1. [in Chinese with English abstract].
Zhang YH, Liu L, Liang WJ, Zhang YM.
2005. Chinese fruit trees: chestnut and hazel- nut volume. Beijing: China Forestry Publish- ing House.
Zhang M, Chen H, Zhang Y. 2011. Physico- chemical, thermal, and pasting properties of
Chinese chestnut (Castanea mollissima Bl.) starches as affected by different drying meth- ods. Starch 63:260-7.
Zou F, Guo SJ, Xiong H, Peng JJ, Wang LY, Wang J, Xu C. 2015b. Changes of endog- enous hormone levels during ovary growth and development after self-and cross-pollination of chestnut (Castanea) cultivar ‘Yanshanzaofeng’.
Adv J Food Sci Technol 8(11):796-801.
Zou F, Guo SJ, Xiong H, Wang J, Zhang XN, Peng JJ, Peng YQ. 2015a. Effects of different pollination treatments on nutrition changes of the ovary in Chinese chestnut (Castanea mollissima Blume). Adv J Food Sci Technol 8(3):157-62.
Zou F, Guo SJ, Xiong H, Xie P, Lv WJ, Li GH. 2013. A morphological and histological characterization of male flower in chestnut (Castanea) cultivar ‘Yanshanzaofeng’. Adv J Food Sci Technol 5(9):1192-7.