CHAPTER FIVE DISCUSSIONS
5.1 Introduction
The aim of this study is to ascertain the specific work values held by active
interpreters in Taiwan, survey their current state of job satisfaction, and determine if
certain work values factors exhibit salient relationship with job satisfaction variables.
The results of this study have been presented in the previous chapter. This chapter
will discuss the findings and then provide implications for each subject in question.
Section 5.2 presents the analysis of the findings on work values and their implications
as given by the interpreters interviewed and related literatures. Section 5.3 follows
the similar framework and focuses on interpreters’ job satisfaction. The potential
relation between the work values and job satisfaction variables will also be discussed.
5.2 Interpreters’ Work Values
In Chapter Two, theories on work values were introduced, among which some of
the common factors they comprised included authority, co-workers, creativity,
independence, security, altruism, work conditions (Macnab, 1987). Later in Chapter
Three, a survey instrument based from Domestic Work Values Inventory (Wu et al.,
1996) was developed to investigate Taiwan interpreters’ work values. The
instrument included such dimensions as personal growth, self-actualization,
self-esteem, interaction with others, and sense of security and leisure. They will be
discussed along with the analysis results in the previous chapter and provide
implications.
5.2.1 Personal Growth
The Personal Growth Dimension of the survey questionnaire includes five
questions. They are: the job I do (5) allows me to constantly acquire new
information and skills; (6) gives me the chance to go into the depth of things; (7)
encourages me to be creative; (8) is full of prospects; and (9) is challenging and full of
variety. The respondents surveyed in this study in general assigned the items in this
category between moderately important and important, as indicated by a weighted
average of 3.90. Analysis of variance (ANOVA) and t-test show that the responses
of respondents as a whole and those classified by gender are statistically different.
Female respondents tended to score significantly higher than their male counterparts
in this dimension. A compilation of the statistics categorized by background
variables is as shown in Table 5.1, and the average scores for each question are
displayed in Table 5.2. On the whole, the two items that scored the highest are
“acquisition of new information and skills (Question 5)” and “challenge and variety
(Question 9)”, in descending order. In contrast, the one item that obtained the lowest
score is “creativity (Question 7)”. With regard to gender-specific results, the female
interpreters on average assigned higher scores than the male interpreters on the five
items.
Table 5.1
Interpreters’ Responses on Personal Growth (classified by background variables)
N Average F/T-value P-value
Male 12 3.567
Gender -2.207 0.034*
Female 24 4.067
20-29 10 3.900
30-39 13 3.769
40-49 11 4.091
Age 0.492 0.691
50-59 2 3.700
Single 19 3.895
Married 16 3.863
Marital 0.548 0.583
Status
Other 1 4.600
Bachelor’s 5 4.280
Master’s 28 3.779
Highest l
2.210 0.126 Degree Leve
Doctorate 3 4.400
Freelancer 18 3.800
Employed in another profession
14 4.114
Staff Interp Freelancer
reter + 3
4.000 Employment
rpreter 2.400
2.574 0.071 Status
Staff Inte 1
No experience 7 3.400
Freelancer 5 4.000
Prior Work Experience
2.603 0.089
Employee 24 4.025
1-5 15 4.013
Years of 0.848 0.403
Interpreting Experience
Over 5 21 3.819
Self-taught 3 3.867 Training program 4 4.350 Interpreter
udies
1.001 0.378 Training
Graduate st 29 3.841
0% 1 4.200
1-20% 9 4.022
21-40% 4 4.050
41-60% 9 3.933
61-80% 8 3.850
Inter Income
preter’s 0.430 0.824
81-100% 5 3.520
* p<.05
b study
Table 5.2
Interpreters’ Responses on Personal Gr h (b )
5 Questio Q Question 8 Question 9
Source: compiled y this
owt y question Question n 6 uestion 7
All (36) 4.31 3.67 3.47 3.89 4.17
Gender
Male (12) 4.08 3.5 2.83 3.42 4
Female (24) 4.42 3.75 3.79 4.13 4.25
Source: compiled by this study
Implications:
n amount of literatu o the of a c t
lesk 1978) out, tance, terpre t
n inborn curiosity and must have the ability to take an interest in each and
an activity.” David Bernet, director of the documentary film on
senior AIIC interpreters “Fascination for the Go-Betweens,” noted that there were
common characteristics among the interpreters he had interviewed, and an unending
curiosity and a boundless thirst for knowledge were included (AIIC, 2002). AIIC in Quite a re has been devoted t making ompeten
interpreter.
“have a
Se ovitch ( pointed for ins that in ters mus
every area of hum
its Advice to Students Wishing to Become Conference Interpreters also stressed a high
degree of intellectual curiosity to be one of the essential aptitudes in shaping an
interpreter. And as interpreters participate in conferences on a variety of subjects,
they are at the forefront of what is happening in the world politically, scientifically
and culturally, meaning that they are constantly enriched (Taylor-Bouladon, 2007).
The aforementioned points imply that the interpreting job entails interpreters’
constant effort in acquiring new information and skills, and the willingness to meet
challenges. And as Hung (1998) indicated out that job traits play a role in the
formation of one’s work values, it is no surprise that the respondents in this study,
who are all active interpreters, reported on average fairly high scores in this
dimension. In addition, the responses from Question One in the section of
open-ended questions supported the high marks in this dimension. Eight out of the
36 respondents replied that they chose to become an interpreter because of the variety
of the job and that they are always at the front to receiving new information. Four
interpreters indicated that they were drawn by its challenging nature. From the
findings above, it is clear that the pursuit of personal growth is a distinctive trait
characterizing the group of interpreters.
Interesting to note is the relatively lower score given to “creativity (Question
7)”. The respondents in general regarded creativity to be of minor importance as
opposed to other variables. A reason could be that although both intellect and
artistry are involved in producing interpretation, the freedom for creativity is often
limited. Interpreters are generally trained to be faithful to the original (Chiang,
ter place; and (14) combines my interest. The interpreters surveyed in
nce of the items in this category between important and
very im
2003), and so must try, in most cases, to make do with what they have at hand.
As to the reason why the female respondents in this study on average assigned
higher scores than their male counterparts in this dimension requires further
investigation. Nevertheless, as the research by Neil & Snizek (1987) pointed out,
women tend to value more the intrinsic aspects of work than men. Such intrinsic
aspects generally include a sense of achievement, self-determination and competence,
and personal development/growth (Kim, 2005). This gender difference may explain
why the female interpreters gave higher scores in Personal Growth than the male
interpreters.
5.2.2 Self-Actualization
The Self-Actualization Dimension of the survey questionnaire includes five
questions. They are: the job I do (10) maximizes my potential; (11) helps me realize
my life-long dream; (12) brings variety to life; (13) allows me to serve the society and
make it a bet
general placed the importa
portant, as indicated by a weighted average of 4.11. Analysis of variance
(ANOVA) shows that the responses of respondents as a whole are statistically
different. A compilation of the statistics categorized by background variables is as
shown in Table 5.3, and the average scores for each question are displayed in Table
5.4. On the whole, the three items that scored the highest and above 4 points on
average were “maximizes my potential (Question 10)”, “combines my interest
(Question 14)” and “brings variety to life (Question 12)”, in descending order. The
item that received the lowest score was “allows me to serve the society and make it a
better place (Question 13)”.
Table 5.3
Interpreters’ Responses on Self-Actualization (classified by background variables)
N Average F/T-value P-value
Male 12 3.933
Gender -1.010 0.329
Female 24 4.200
20-29 10 4.220
30-39 13 4.015
40-49 11 4.055
Age 0.464 0.709
50-59 2 4.500
Single 19 4.116
Married 16 4.100
Marital 0.012 0.988
Status
Other 1 4.200
Bachelor’s 5 4.240
Master’s 28 4.100
Highest el Degree Lev
Doctorate 3 4.000
0.149 0.862
Freelancer 18 3.978
Employed in rofession
another p
14 4.314
Staff Interpreter + r
Freelance
3 4.133 Emplo
Status
yment
reter
Staff Interp 1 3.600
0.980 0.414
No experience 7 3.686
Freelancer 5 4.480
Prior Work Experience
2.799 0.075
Employee 24 4.158
1-5 15 4.227
Years Interpreting
of 0.852 0.404
Experience
Over 5 21 4.029
Self-taught 3 4.667
Training program 4 4.050 Interpreter
Training
29 4.062
1.304 0.285
Graduate studies
0% 1 4.200
1-20% 9 4.444
21-40% 4 4.150
41-60% 9 4.156
61-80% 8 3.775
Interpreter’s Income
1.088 0.387
81-100% 5 3.920
Source: compiled by this study
Table 5.4
Interpreters’ Responses on Self-Actualization (by question)
Question 11 n 12 n 13 14 Question 10 Questio Questio Question
All (36) 4.44 3.97 4.06 3.69 4.39
Source: compiled by this study
Implications:
As discussed in the previous se n, a that distinguished interpreters
from practitione r profession lov wledge and information, and
the spirit to fa e challeng nd ties arising from every new
ssignment. Moreover, aside from proficiency in the working languages, mental and
ualities such as an analytical mind and intuition, quick thinking and ability ctio feature
rs of othe is a e for kno
ce up to th es a uncertain
a
physical q
to adapt immediately n a t
, an abov e phy nerv ina, an excellent m
acy are all crucial to the making of a successful conference
interpreter (Taylor-Bouladon, 2007). As the interpreting profession demands much
of its practitioners, those who stay in the line are mostly individuals who really like
the job and feel that interpreting maximizes their potential and brings color to their
lives. When translated into survey results, the average score of this dimension is
notably higher than all the other work values dimensions in this study. A further
evidence to the findings lies in the open-ended questions section which had thirteen
interpreters (over one-third of the total respondents) stating that self-actualization and
an interest for the job were their main incentives to become an interpreter. Such an
interest, as noted by the respondents, generally derived from the challenging nature of
the job, which allowed its practitioners to constantly enrich themselves by taking on a
wide variety of tasks.
5.2.3 Self-esteem
The Self-esteem Dimension of the survey questionnaire includes four
questions. They are: the job I do (15) is in line with family expectations; (16) is
understood and acknowledged by others; (17) is one that I have ample control over its
conditions and environment; and (18) helps me obtain reputation and status. The to different speakers, acce ts, situations nd subjects, he power
to concentrate e-averag sical and ous stam emory,
and tact and diplom
respondents surveyed in this study in general assigned the items in this category
between moderately important and important, as indicated by a weighted average of
3.74. Analysis of variance (ANOVA) shows that the responses of respondents as a
lly different. A compilation of the statistics categorized by
backgro
whole are statistica
und variables is as shown in Table 5.5, and the average scores for each
question are displayed in Table 5.6. On the whole, the two items that scored the
highest and over four points were “acknowledgement by others (Question 16)” and
“control over working condition (Question 17)”, in ascending order. In contrast, the
item that obtained the lowest score was “in line with family expectation (Question
15)”, which also happened to be the lowest in the entire work values section of the
survey questionnaire. With regard to the results classified according to marital status,
apparent discrepancies have been observed on the responses for Questions 15 and 16,
with the married placing higher importance on family expectations than the singles,
and the singles valuing more on the acknowledgement of others than the married
counterparts. In terms of the years of interpreting experience, the respondents
having worked less than five years in general scored significantly higher than those
who have worked more than five years on responses for Questions 15 and 16.
Regardless of marital status and years of interpreting experience, all have given
similar ratings to Question 18.
Table 5.5
Interpreters’ Responses on Self-esteem (classified by background variables)
N Average F/T-value P-value
Male 12 3.500
Gender
Female 24 3.865
-1.803 0.080
20-29 10 3.775
30-39 13 3.865
40-49 11 3.591
Age 0.444 0.723
50-59 2 3.625
Single 19 3.724
Married 16 3.833
Marital
Other 1 3.000
0.950 0.397 Status
Bachelor’s 5 3.550
Master’s 28 3.804
Highest
Doctorate
0.656 0.525 Degree Level
3 3.500
Freelancer 18 3.694
Employed in 14
another profession 3.839 Staff Interpreter +
3.417 Freelancer
3 Employment
erpreter
0.698 0.560 Status
Staff Int 1 4.250
No experience 7 3.536
Freelancer 5 3.700
Prior Exper
Work ience
Employee 24 3.813
0.598 0.556
1-5 15 3.867
Years of 1.064 0.295
Interpreting Experience
Over 5 21 3.655
Self-taught 3 3.583
Training program 4 3.688
Interpreter 0.145 0.866
Training
Graduate studies 29 3.767
0% 1 3.500
1-20% 9 4.000
21-40% 4 3.625
41-60% 9 3.889
61-80% 8 3.563
Interprete Income
r’s 0.901 0.493
81-100% 5 3.450
Source: compiled by this study
Table 5.6
Interpreters’ Responses on Self-Actualization (by question)
n 15 Quest Question 17 Question 18
Questio ion 16
All (36) 3.11 4.08 4.17 3.61
Source: compiled by this study
Implications:
It has been commonly agree at, rtz inted e
interpreting pro demanding one with considerable physical and intellectual
ing the interpreter’s physical and mental
quality of inte tatio s capture some
of the variables that are especially important to ers, and when broadly defined,
include compensation, benefits, hours and schedules, supervision, evaluation,
entoring/support, professional development and advancement, and physical
se, interpreters’ working
conditions in a given assignm re shaped e physica ironment, including
lated factors such as preparation, cognitive workload, and
arious input variables; and by inter-personal factors (e.g. relations with team
, 2004). Tietjen (1996) has stated in the d th as Swa (1999) po out, th
fession is a
stress. Many factors are involved, influenc
comfort at work and the rpre n. Working condition
interpret
m
environment (Swartz, 1999). In a more specific sen
ent a by th l env
time and place; by task-re
v
members, client feedback) (Pöchhacker
literature review of this study that these issues were what Locke (1976) referred to as
the “event factors” which influenced an individual’s job satisfaction.
It may not be coincident then that the respondents of this study assigned on
average a rating higher than four to “control over working condition (Question 17)”,
demonstrating considerable concern about the issue. Furthermore, as Garcez (2006)
asserted in a literature review, salient relationship exists between self-esteem and job
satisfaction. The notion is that a person who is satisfied at work has a higher
self-esteem than one who is not. Likewise, a person who has a high self-esteem is
likely to be more satisfied with the job (Garcez, 2006). Therefore when the
aforementioned factors of job satisfaction are addressed properly, the interpreters are
likely to feel more satisfied and acquire more self-esteem, creating positive chain
reactions.
In terms of the importance of reputation and status, the respondents surveyed
generally accorded with one another in this respect and gave a rather modest score to
it. From the findings in the aforementioned Personal Growth and Self-Actualization
Dimensions, it can be speculated that most of the subjects in this study became
interpreters for a pursuit of interest and psychological fulfillment, and so social
recognition plays a relatively minor role on the interpreters’ work values spectrum.
Interestingly, a study done by Hung (2004) discovered that along with four other jobs
- professor, engineer, nurse, journalist, interpreters enjoyed a professional standing
that was just higher than journalists. This was primarily due to the public’s lack of
understanding of interpreting as a profession. This perception might also have led to
interpreters’ reluctance to acknowledge reputation and status in an explicit manner.
5.2.4 Interaction with Others
re
hole, the item that received the highest rating in this
dimens
The Interaction with Others Dimension of the survey questionnaire includes
six questions. They include: the job I do (19) allows me to frequently collaborate
with others; (20) rarely sees conflicts between associates; (21) has co-workers that get
along quite well; (22) enables me to expand my personal network; (23) requires
efforts to be made to maintain relationship with my clients; and (24) can mostly be
done on my own; there is rarely a need to consult others. The respondents surveyed
in this study in general assigned the items in this category between moderately
important and important, as indicated by a weighted average of 3.78. Analysis of
variance (ANOVA) shows that the responses of respondents as a whole are
statistically different. A compilation of the statistics categorized by background
variables is as shown in Table 5.7, and the average scores for each question a
displayed in Table 5.8. On the w
ion was Question 21, while the lowest was Question 19, which was also the
second lowest score found in the entire work values section of the survey
questionnaire.
Table 5.7
Interpreters’ Responses on Interaction with Others (classified by background variables)
N Average F/T-value P-value
Male 12 3.667
Gender
Female 24 3.833
-0.635 0.530
20-29 10 3.800
30-39 13 3.949
40-49 11 3.742
Age 1.630 0.202
50-59 2 2.750
Single 19 3.754
Married 16 3.854
Marital
Other 1 3.000
0.641 0.533 Status
Bachelor’s 5 3.700
Master’s 28 3.821
Highest
Doctorate 3 3.500
0.279 0.758 Degree Level
Freelancer 18 3.796
Employed in 14
3.952
Employment 1.862 0.156
another profession Staff Interpreter + Freelancer
3 2.889 Status
Staff Interpreter 1 3.667
No experience 7 3.476
Freelancer 5 3.433
Prior Work e
38
1.777 0.185 Experienc
Employee 24 3.9
15 3.878 1-5
Years of terpreting
In
Experience
ver 5
0.684 0.499
O 21 3.706
Self-taught 3 3.278
Training program 4 3.875 Interprete
Training r
tudies
Graduate s 29 3.816
0.756 0.477
0% 1 4.333
1-20% 9 3.815
21-40% 4 3.708
41-60% 9 3.889
61-80% 8 3.667
Interpreter’s Income
81-100% 5 3.633
0.215 0.954
Source: compiled by this study
Table 5.8
Interpreters’ Responses on Interaction with Others (by question) n Question
2
Qu
2
Question 23
Question Questio
19 0
estion Question
21 2 24
All (36) 3.28 3.97 4.11 3.75 3.97 3.58
Source: compiled b
Implications:
y this study
Interprete employees, generally work outside of the
traditional nine- This is espec ith freelance interpreters, for
upon vice, and “colleagues” usually change from
titioners, eed office politics and the chance
en an assignme e th the attractions for taking the
ency toward work that can be done rather independently, without
ly with o , is reflected in the findings of this study,
where the respondents gave the lowest score on average to “the chance to frequently
it ers (Question 19)”. In y, t reter d
highly appreciated having nice and friendly colleagues, as shown by the high marks
given to “having co-workers that get along quite well (Question 21)”. This could be
cially those performing simultaneous interpreting tasks,
. Therefore having
partners that are easy to ge g with f ultimat addition st
interpreters surveyed agreed on the importance of customer relationship rs, unlike full-time
to-five routine. ially so w
whom attendance is required only ser
task to task. F
to work indep
job. The tend
or many prac the fr om from
dently on nt ar e some of
having to collaborate routine thers
collaborate w h oth terestingl he interp s surveye
because interpreters, espe
work in teams of two or three all throughout the assignment
t alon are o e importance. In , mo
of the
management, so that existing clients could be retained, and their lifetime value
maximized (as shown in Question 23). After all, the size of the clientele is in most
cases positively related to the number of incoming assignments. It is to interpreters’
interest to maintain a good relationship with their clients and to continue to expand
their personal network so that more customers could be acquired.
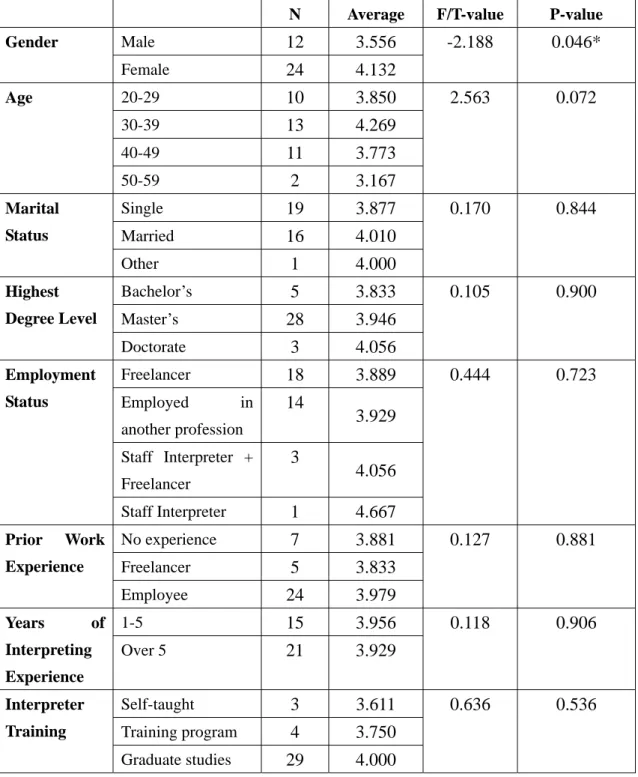
5.2.5 Sense of Security and Leisure
The Sense of Security and Leisure Dimension of the survey questionnaire
includes six questions. They are the job I do: (25) allows me to live comfortably on
just one income; (26) involves providing professional service only; I do not have to
tend to affairs outside interpreting; (27) seldom gives me feeling of uneasiness and
anxiety; (28) gives me a sense of security; I rarely have to worry about the future; (29)
has flexible work hours; and (30) seldom requires me to attend after-work networking
events. The respondents surveyed in this study in general assigned the items in this
category between moderately important and important, as indicated by a weighted
average of 3.94. Analysis of variance (ANOVA) shows that the responses of
respondents classified by gender are statistically different. Female respondents
tended to score significantly higher than their male counterparts in this dimension. A
compilation of the statistics categorized by background variables is as shown in Table
5.9, and the average scores for each question are displayed in Table 5.10. On the
whole, the items receiving the highest ratings in this dimension were Question 29 and
30, both scoring 4.17 on average. The lowest rating, on the other hand, fell on
Table 5.9 Question 28.
Interpreters’ Responses on Sense of Security and Leisure (classified by background variables)
N Average F/T-value P-value
Male 12 3.556
Gender
Female 24 4.132
-2.188 0.046*
20-29 10 3.850
30-39 13 4.269
40-49 11 3.773
Age 2.563 0.072
50-59 2 3.167
Single 19 3.877
Married 16 4.010
Marital
Other 1 4.000
0.170 0.844 Status
Bachelor’s 5 3.833
Master’s 28 3.946
Highest
Doctorate 3 4.056
0.105 0.900 Degree Level
Freelancer 18 3.889
Employed in 14
3.929 another profession
Staff Interpreter + 3
4.056 Freelancer
Employment 0.444 0.723
Status
Staff Interpreter 1 4.667
No experience 7 3.881
Freelancer 5 3.833
Prior Work
Employee 24 3.979
0.127 0.881 Experience
1-5 15 3.956
Years of
Experience
0.118 0.906 Interpreting Over 5 21 3.929
Self-taught 3 3.611
Training program 4 3.750
Interpreter 0.636 0.536
Training
0% 1 3.167
1-20% 9 4.000
In
21-40% 4 4.042
41-60% 9 4.148
61-80% 8 3.458
terpreter’s
81-100% 5 4.300
1.800 0.143 Income
* P<.05
Source: compiled b
Table 5.10
Interpreters’ Responses on Sense of Se an (by question) uestion
25
Question 2
Qu
2
Question 29
Question y this study
curity d Leisure Q
6
estion Question
27 8 30
All (36) 3.92 3.97 3.78 3.64 4.17 4.17
Gender
Male (12) 3.67 3.75 3.50 3.25 3.58 3.58
Female (24) 4.04 4.08 3.92 3.83 4.46 4.46
Source: compiled by this study
Implications:
For many interpreting profession, the variety in lifestyle is
probably one o ion Taylor ade it clear by
speaking on beh associates:
ce way of life, the independence it gives us
lity of saying “ o a ce doe
appeal for one reason or another. Most of us feel would not be happy in
r eeing sam ever ling
the same y day, knowing wher obably be next
who are in the
f the greatest attract
alf of her fellow
s. -Bouladon (2007) m
“Most of us prefer the free-lan
and the possibi no” t conferen offer that s not
a regula nine-to-five job s the e people y day, dea with
subject ever e we will most pr
month o
the unpre
r t the same . W the u ness
of the lifestyle (Taylo on, 2007).”
Therefore it is al that the freelancers surveyed in this study on average
work hours with the highest importance. The female
of this study showed an even more prominent sign by giving the highest
ores to t
r supp is fin n be n the ded s, w
many as eight interpreters cited “flexi urs” and “freedom” specifically as
sons to become an interpreter.
evertheless, freedom comes with a price. By keep away from traditional
reelance interpreters also give up a regular source of income, and in
sense of security. But it is also possible
that the subjects simply do not view such an issue as very important. This study is
not ab
the
interp g to
next year a time e enjoy nexpected and
dictability r-Boulad
not incident
credited having flexible
interpreters
sc his item, along with not having to attend after-work networking events. A
furthe ort to th ding ca found i open-en question here as
ble work ho
the main rea
N
work hours, f
most cases, benefit packages accompanying it. It is likely that out of the perception
of this reality, the freelance interpreters surveyed in this study on average assigned the
lowest score to having a job that provides a
le to further verify the real reason.
In addition to financial insecurity, the stressful nature underlying
reting profession is also loved and hated by interpreters. Accordin
Pöchh ainly
freela lated
fatigu and
speak ion as the most
important stressors. The uncertainty of the job also drove away some of those who
unpredictable nature. Taylor-Bouladon
and hear your own voice talking acker (2004), the AIIC Workload Study (2002) surveyed some 600 (m
nce) AIIC members, whose responses indicated high levels of work-re
e, exhaustion and mental stress, and pointed to different source texts
er delivery, poor booth conditions and insufficient preparat
were initially interested in the profession. Chiang (2003) exemplified in her book by
mentioning a student who performed quite well in a practicum later told her that he
did not enjoy himself at all while working, because it was simply too stressful. What
came next was always uncertain. He was not confident of handling all the incoming
messages properly and therefore would give second thought to becoming a
professional interpreter. On the contrary, to some interpreters, what is extremely
appealing about this job is precisely its
(2007) provided a vivid description of such a taste for challenge and excitement:
“When you are on the air you are in a special heightened mental state,
the adrenalin is pumping and as you look down at the rows of ear-phoned
heads listening to your words, you are suddenly capable of using words
you never thought you knew. It is an amazing experience to listen to
tapes of yourself, years later,
convincingly about things you know nothing of, using scientific
terminology with ease. As if you really understood (Taylor-Bouladon,
2007)....”
Four respondents also cited “challenge” as their main incentive to become an
interpreter. As a result of this love-hate relationship, the freelancers of this study on
average attached a rating between moderately important and important to the absence
of uneasiness and anxiety at work.
Interesting to note is that the freelancers surveyed in this study gave an average
of 4.00 to having to provide only professional service at work. However they detest
having to tend to affairs outside interpreting; interpreters, especially freelancers, are
unlikely to be able to fend off administrative matters like negotiating and collecting
fees if they do not have agents, as the Taiwan T&I Study (2004) pointed out.
Freelancers are bound to come face to face with their clients at a certain point. It is
therefore important for interpreters to develop a set of know-how to keep their
businesses running.
5.2.6
neral
descri this
Summary
Based on the analyses, a summary is drawn as follows to present a ge
ption of Taiwan interpreters’ work values. Overall, the respondents of
study ts of
their w ers,
on the
tudy
showed a strong need for constant intellectual input and pursued a challenging career.
t getting along well with teammates was vital, so
b Satisfaction
The definitions and theories of job satisfaction were presented in Chapter Two,
tecedents and consequences. In general the job satisfaction highly valued the personal growth, self-actualization and lifestyle respec
ork. Issues concerning self-esteem and opportunities to associate with oth
other hand, received relatively lower work values ratings.
By examining each facet, it is discovered that the interpreters of this s
In addition, the interpreters indicated that their job must greatly interest them,
maximize their potential, and bring variety to life. Having sufficient autonomy was
a must for the interpreters, in terms of the degree of control over working conditions.
The practitioners also believed tha
was maintaining good relationship with clients. Finally, flexible work hours meant a
lot to the interpreters while a sense of security did not seem to matter as much.
In short, the interpreters of this study could be characterized as an autonomous
group of professionals with a fervent passion for knowledge, who enjoy working in
small teams and stretching themselves to meet the myriad challenges of completing a
task.
5.3 Interpreters’ Jo
along with its an
constru
an interpreters’ job
dently;
8) the flexibility in work hours; and (39) the amount of time I can devote to my
mily. The respondents surveyed in this study in general assigned the items in this
ee, as indicated by a weighted average of 3.92.
ct includes dimensions such as the work itself, co-workers, supervision, pay,
working conditions, company policies and procedures, and opportunities for
promotion. In Chapter Three, a survey instrument based on the Minnesota
Satisfaction Questionnaire (MSQ, 1967) and Chen’s Job Satisfaction Questionnaire
for Interpreters (2005) was developed to investigate Taiw
satisfaction. The instrument included two facets, namely intrinsic satisfaction and
extrinsic satisfaction. They will be discussed along with the analysis results in the
previous chapter and provide implications while their correlation with the work values
variables are tested.
5.3.1 Intrinsic Satisfaction
The Intrinsic Satisfaction Dimension of the survey questionnaire includes nine
questions, which are nine dimensions themselves. They are: as an interpreter, I am
satisfied with (31) the current workload; (32) the opportunity to operate indepen
(33) the chance to do different things from time to time; (34) the chance to do things
for other people; (35) the chance to make use of my abilities; (36) the chance to try
my own methods of doing the job; (37) the sense of achievement I get from doing the
job; (3
fa
category between undecided and agr
Analysis of variance (ANOVA) shows that the responses of respondents as a whole
are statistically different. A compilation of the statistics categorized by background
variables is as shown in Table 5.11, and the average scores for each question are
displayed in Table 5.12. On the whole, the item that received the highest rating in
this dimension was “the chance to do different things from time to time (Question
33)”, which was also the highest score found in the entire job satisfaction section of
the survey questionnaire, while the lowest was “the current workload (Question 31).”
Table 5.11
Interpreters’ Responses on Intrinsic Satisfaction (classified by background variables)
N Average F/T-value P-value
Male 12 3.861
Gender
Female 24 3.944
-0.452 0.654
20-29 10 4.011
30-39 13 3.821
40-49 11 3.889
Age
2 4.222
0.484 0.696
50-59
Single 19 3.877
Married 16 4.007
Marital
Other 1 3.222
1.221 0.308 Status
Bachelor’s 5 4.000
Master’s 28 3.917
Highest
Doctorate 3 3.778
0.166 0.848 Degree Level
Freelancer 18 3.846
Employed in 14
4.016 another profession
Staff Interpreter + 3
3.926 Freelancer
Employment 0.292 0.831
Status
Staff Interpreter 1 3.778
No experience 7 3.794
Freelancer 5 4.133
Prior Work
Employee 24 3.907
0.630 0.539 Experience
1-5 15 3.948 Years of
Interpreting Experience
Over 5 21 3.894
0.278 0.784
Self-taught 3 4.370
Training program 4 3.833 Interpreter
Training
1.303 0.285
Graduate studies 29 3.881
0% 1 4.222
1-20% 9 4.099
21-40% 4 3.694
41-60% 9 4.000
61-80% 8 3.806
Interpreter’s 0.656 0.659
Income
81-100% 5 3.733
Source: compiled by this study
Table 5.12
Interpreters’ Responses on Intrinsic Satisfaction (by question)
Q31 Q32 Q33 Q34 Q35 Q36 Q37 Q38 Q39
All (36) 3.50 3.89 4.25 3.86 4.11 3.83 4.03 4.06 3.72
Source: compiled by this study
der rmine the rel hip w an c
ction vari son correlation was employed to discover the possible pairs.
Then Cohen’s (1988) interpretation of the strength of the relationship was adopted,
lue on correlation = .1 ind all corr ;
.49 edium correlation; and r= .50 to 1.0 indicating large
Ta ts the p that exhibit medium correlation and above.
ings s interpre ’ sa in terms of the sense of
nt be three items from the Personal Growth and
Self-Actualizati . The interpreters’ satisfaction in terms of the Correlation with Work Values Variables
In or to dete ations between ork values d intrinsi
satisfa ables, Pear
with the va
r= .30 to
of Pears (r) 0 to .29 icating sm elation
indicating m
correlation.
The find
ble 5.13 presen airs
how that the ters tisfaction
achieveme ars a positive relation w
on dimensions
ith
flexibility in w its it ion with heir need fo job
which has flexible work hours. Another work-hour-related item is the degree of
spent th fa The f ica is
on with int ’ need for flexible work hours
fter-work netwo eve e 5.13
een Intrinsic Satisfaction and Work Values Variables
er isfied h th of a nt I
ork hours also exhib a pos ive relat t r a
satisfaction in t
variable shows
erms of the time wi mily. indings ind te that th
a medium relati the erpreters
and the opting out Tabl
Correlation betw
of a rking nts.
37. As an int doing the job.
preter, I am sat wit e sense chieveme get from
5. The job I do allows me to constantly acquire new information and skills. 0.38 9. The job I do is challenging and full of variety. 0.37
14. The job I do combines my interest. 0.49
38. As an interpreter, I am satisfied with the flexibility in work hours.
29. The job I do has flexible work hours. 0.42 39. As an inter m satisfied w the amount of time I can devote to my family.
preter, I a ith
29. The job I do has flexible work hours. 0.49 30. The job I do seldom requires me to attend after-work networking 0.30 events.
Source: compiled by this study
Implications:
In gener e th y e
The chance al, the interpreters surv yed in is stud accord d fairly high ratings to
their satisfaction toward the intrinsic components of the interpreting job.
to do different things from time to time (Question 33), the chance to make use of
one’s abilities (Question 35), and the sense of achievement deriving from the job
(Question 37) are among the variables that had the impressive scores of between
agree and strongly agree.
Based on the findings and summary of the previous section, which
characterized the interpreters as professionals who were in constant pursuit of
intellectual input, challenge and variety, the subjects of this study can be said to have
their psychological needs for challenge, growth, and variety mostly fulfilled by
working as an interpreter. The aforementioned correlation test demonstrates that the
more the subjects of this study deemed it important to have a job that is constantly
challenging, full of variety, and provides intellectual input, the more they are satisfied
with these respects of the interpreting job. Further evidence can be found in the
open-ended questions section, where the respondents were asked the most gratifying
part about the interpreting job. Among the 36 subjects, ten of them mentioned it was
allenging natu
the constant intellectual input and the chance to work on interesting topics that had
them highly attracted to the profession. Five of the interpreters cited challenge and
still another five pointed to the sense of achievement as the most gratifying part to
working as an interpreter. Therefore as commented by more than one-third of the
participants of this study, what drove them to choose interpreting as a career was
really a genuine and strong interest for the profession and its ch re.
5.3.2 Extrinsic Satisfaction
The Extrinsic Satisfaction Dimension of the survey questionnaire includes
twelve questions, which represent twelve dimensions themselves. They are: as an
interpreter, I am satisfied with (40) the recognition I receive from this job; (41) how
interpreting provides for steady employment; (42) my pay and the amount of work I
do; (43) the general working conditions and environment; (44) the way my coworkers
get along with each other; (45) the variety of resources available when I need help in
work; (46) the range of means available to enhance professional knowledge and
managerial know-how; (47) the current welfare benefits and the protection of interests;
(48) the number of clients and cases I have right now; (49) the general affairs I have
to do in addition to providing interpreting service; (50) the opportunity to expand my
personal network; and (51) how my clients understand and appreciate the job. The
respondents surveyed in this study in general assigned the items in this category
between undecided and agree, as indicated by a weighted average of 3.08. Analysis
of variance (ANOVA) shows that the responses of respondents as a whole are
statistically different. A compilation of the statistics categorized by background
variables is as shown in Table 5.14, and the average scores for each question are
displayed in Table 5.15. Overall, no item in this facet received a rating higher than
four. The highest rating in the facet fell on “the recognition I receive from this job
(Question 40)”, while the lowest went to “the current welfare benefits and the
protection of interests (Question 47)”, which was also the lowest of the entire job
satisfaction section.
Table 5.14
Interpreters’ Responses on Extrinsic Satisfaction (classified by background variables)
N Average F/T-value P-value
Male 12 3.188
Gender
Female 24 3.024
1.002 0.323
20-29 10 2.883
30-39 13 3.122
Age
40-49 11 3.242
50-59 2 2.875
1.258 0.305
Single 19 2.912
Married 16 3.297
Marital
Other 1 2.750
3.817 0.032*
Status
Bachelor’s 5 3.233
Master’s 28 3.021
Highest
Doctorate 3 3.361
0.070 0.355 Degree Level
Freelancer 18 3.074
Employed in 14 3.238
Staff Interpreter + 3 2.611
Employment 2.853 0.053
Status
Staff Interpreter 1 2.333
No experience 7 2.929
Freelancer 5 2.917
Prior Work
Employee 24 3.156
1.022 0.371 Experience
1-5 15 3.011
Years of -0.739 0.465
Interpreting Over 5 21 3.127
Self-taught 3 3.194
Training program 4 3.021 Interpreter
Graduate studies 29 3.075
0.121 0.887 Training
0% 1 3.500
1-20% 9 3.037
21-40% 4 2.958
41-60% 9 3.000
61-80% 8 3.125
Interpreter’s 0.381 0.858
Income
81-100% 5 3.233
Source: compiled by this study