Feature Enrichment Based Convolutional Neural Network for Heartbeat Classification From
Electrocardiogram
QINGSONG XIE 1,3, SHIKUI TU2,3, (Member, IEEE),
GUOXING WANG 1,3, (Senior Member, IEEE), YONG LIAN 1,3, (Fellow, IEEE), AND LEI XU2,3, (Fellow, IEEE)
1Department of Micro-Nano Electronics, Shanghai Jiao Tong University, Shanghai 200240, China 2Department of Computer Science and Engineering, Shanghai Jiao Tong University, Shanghai 200240, China
3Centre for Cognitive Machines and Computational Health (CMaCH), School of SEIEE, Shanghai Jiao Tong University, Shanghai 200240, China
Corresponding author: Lei Xu ([email protected])
This work was supported in part by the National Science and Technology Innovation 2030 Major Project of the Ministry of Science and Technology of China under Grant 2018AAA0100700, in part by the Zhi-Yuan Chair Professorship Start-up Grant from Shanghai Jiao Tong University under Grant WF220103010, and in part by the National Natural Science Foundation of China under Grant 61874171.
ABSTRACT Correct heartbeat classification from electrocardiogram (ECG) signals is fundamental to the diagnosis of arrhythmia. The recent advancement in deep convolutional neural network (CNN) has renewed the interest in applying deep learning techniques to improve the accuracy of heartbeat classification. So far, the results are not very exciting. Most of the existing methods are based on ECG morphological information, which makes deep learning difficult to extract discriminative features for classification. Towards an opposite direction of feature extraction or selection, this paper proceeds along a recent proposed direction named feature enrichment (FE). To exploit the advantage of deep learning, we develop a FE-CNN classifier by enriching the ECG signals into time-frequency images by discrete short-time Fourier transform and then using the images as the input to CNN. Experiments on MIT-BIH arrhythmia database show FE-CNN obtains sensitivity (Sen) of 75.6%, positive predictive rate (Ppr) of 90.1%, and F1 score of 0.82 for the detection of supraventricular ectopic (S) beats. Sen, Ppr, and F1 score are 92.8%, 94.5%, and 0.94, respectively, for ventricular ectopic (V) beat detection. The result demonstrates our method outperforms state-of-the- art algorithms including other CNN based methods, without any hand-crafted features, especially F1 score for S beat detection from 0.75 to 0.82. This FE-CNN classifier is simple, effective, and easy to be applied to other types of vital signs.
INDEX TERMS Electrocardiogram, feature enrichment, short-time Fourier transform, convolutional neural network.
I. INTRODUCTION
Electrocardiogram (ECG) signal has become a promising source for monitoring the heart condition and function owing to the availability of wearable wireless ECG sensors, which are low cost, easy to use, and allow for long time recording.
Heartbeat classification based on ECG signals is a valuable tool for the detection of arrhythmias. Arrhythmias can be divided into harmless or life-threatening classes. It may incur tachycardia, bradycardia, or even sudden cardiac arrest. The diagnosis of arrhythmias depends on heartbeat classification.
The associate editor coordinating the review of this manuscript and approving it for publication was Panagiotis Petrantonakis .
However, automatic heartbeat classification is difficult because the variability in ECG signals can be significant between different patients. Furthermore, the morphology and rhythms of ECG signal generated by the same patient can be quite different over time [1].
The existing studies mostly concentrated on feature extrac- tion or selection for a small set of non-redundant, predic- tive features for ECG representation. For example, Hermite transform, discrete wavelet transform and, independent com- ponent analysis were adopted in [2]–[5]. Various means of feature extraction or selection were also combined or sequentially used to optimize a set of discriminant fea- tures for ECG arrhythmia classification [6]–[8]. Based on
TABLE 1. The recording number for DS1 and DS2.
the computed ECG features, many classifiers have been adopted, including mixture of experts (MOE) approach [1], blocked-based neural network (BBNN) [2], hidden Markov model [9], support vector machine [7], general regression neural network [10], genetic algorithm-back propagation neural network [11], deep belief networks [12], [13], and artificial neural network (ANN) [3], [14]. However, these methods need a certain amount of prior knowledge of the signals or require some expert’s input. The identification of characteristic points, such as P, Q, R, S, and T waves, may also be required for these methods. However, in the case of arrhythmia, these ECG features may not always be clearly defined and thus the extraction of these features becomes ambiguous. Moreover, the fixed and hand-crafted features may not reflect the optimal representation of the ECG signals. These make them tend to perform inconsistently when classifying new subjects’ ECG signals.
Recently, deep convolutional neural network (CNN) was introduced to analyze ECG signals [15], [16], or electroen- cephalogram (EEG) signals [17]. Unlike the conventional machine learning approaches, CNN is capable of obtaining useful representations from the raw data, and outputs the classification results without any hand-crafted feature engi- neering. However, 1-D signals were directly fed into CNN in [15], [16], i.e., the convolution on the input layer was operated on 1-D discrete vector. In such case, it is difficult for CNN to extract discriminant patterns from the ECG signals with sim- ilar morphology, because discrete time-series representation is too squash for convolutional layers to discern. For example, supraventricular ectopic (S) beats and normal (N) beats (in sinus mode) usually share similar ECG morphology and S beat is easy to be confused with N beat by not only conven- tional machine learning methods but also CNN based deep learning methods in [15], [16].
Inspired by feature enrichment (FE) [18] that proceeds along an opposite direction of feature extraction or selection and enriches extracted and compressed representations into enriched formats with squashed dependent structure restored, e.g., turn time series to two dimensional images by time- frequency analysis, we develop a FE-CNN classifier in this paper to exploit the advantage of deep learning for automatic diagnosis of arrhythmia. To well capture the discriminative pattern among the heartbeats, ECG signals are transformed into images by discrete short-time Fourier transform (STFT), and then the images that encode more detailed dependent structural patterns are fed into a CNN based architecture for the recognition of arrhythmia beats.
For common practice and benchmarking, the Asso- ciation for the Advancement of Medical Instrumenta- tion (AAMI) [19] provides criterion and suggests practices
for performance results of automated arrhythmia detection algorithms, which requires at most the first five minute seg- ment of the recording from each subject can be used as training data. Nevertheless, only a few approaches follow the AAMI standards to test the performance on the complete benchmark data, e.g., [2], [3], [15].
We follow the AAMI recommendations to evaluate the pro- posed method on a public benchmark dataset MIT-BIH [20].
Experiments demonstrate that the proposed method outper- forms state-of-the-art algorithms in heartbeat classification.
In particular, our results obviously reduce the false alarm of the existing S beat classification, which demonstrates that feature enrichment indeed works for facilitating deep learning on ECG signals, and suggests that it could be used in other related problems as well.
II. DATASET
The MIT-BIH dataset [20] is adopted as a source of ECG signal to evaluate the performance of the proposed algorithm.
Each heartbeat is converted into five heartbeats recommended by AAMI standard, i.e., beats originating in the sinus mode (N), supraventricular ectopic (S) beats, ventricular ectopic (V) beats, fusion (F) beats, or unclassifiable (Q) beats. S beats are premature narrow QRS beats resembling the N beats and V beats are wide bizarre QRS beats. S beats may indicate atrial dilatation as in left ventricular dysfunction. Isolated V beats are harmless, but are predictive of serious arrhythmias associated with heart disease. F beats occur when electrical impulses from different sources simultaneously act upon the same region of the heart.
Specifically, the MIT-BIH dataset consists of 48 recordings from 47 patients, where the recording 201 and 202 come from the same male patient. Each recording has dura- tion of 30 minutes, digitized at 360 Hz, and we only use the lead II channel. As in [15], [21], we also use 44 recordings, by excluding the four recordings (102, 104, 107, and 217) which contain paced heartbeats. They are divided into two groups, i.e., DS1 and DS2. The DS1 con- tain 20 recordings of a number of waveforms and motion artifacts that an arrhythmia detector might encounter in routine clinical use, and the DS2 include complex and clinically significant arrhythmias, e.g., ventricular, junc- tional, supraventricular arrhythmias, and conduction abnor- malities [22]. Table1gives the detailed recording number for DS1 and DS2.
III. METHODOLOGY A. OVERALL ARCHITECTURE
Fig.1shows the overall architecture of the proposed method for ECG heartbeat classification. First, the noise is removed
from raw ECG data to obtain preprocessed ECG. Then, 1-D ECG is converted to 2-D image through feature enrichment implemented by discrete STFT. The subtle features contained in image are automatically extracted by convolutional neural network. Fully-connected (FC) layer receives these features for ECG type recognition.
B. PREPROCESSING
In real applications, ECG signal is contaminated by various kinds of noises, including respiration signal, power line inter- ference, and muscle contraction. The 4th order Chebyshev type I bandpass filter is constructed for removing noises with cutoff frequencies of 6 and 18 Hz as used in [23]. Here, the fil- ter is designed in both the forward and reverse directions to avoid the phase shift.
C. FEATURE ENRICHMENT
Recently proposed in [18],1feature enrichment is to tackle the problem that the conventionally extracted, compressed representation of the raw data is difficult for deep learn- ing to learn the structural and discriminative information.
For examples, the tasks like traveling salesman problem and portfolio management are usually formulated in dis- crete, symbolic, and conceptual representations. Similar to financial time series, ECG signals are not good as direct input into deep network such as CNN. In a direction oppo- site to the feature extraction or selection which is usually required for conventional machine learning models, feature enrichment aims to enrich the simplified representation by restoring the structural information with details. Applying this FE principle, we turn the ECG time series into images through discrete STFT, for an image representation to encode dependent structures implied in the ECG vector represen- tation. Subtle variation in different heartbeats can be repre- sented in a way easy to be captured by CNN, facilitating the subsequent detection of ectopic heartbeats. The details are given below.
Same as in [15], [16], ECG signals are segmented into identical length for further analysis by CNN. A beat is thus segmented into 351 samples with center at the R peak as it corresponds to normal heartbeat rate. The timing information of R peak is provided by experts in the dataset. Note there are many R peak detection algorithms available with accuracy better than 99%.
STFT is a time-frequency analysis suited to non-stationary signals. It provides information about changes in frequency over time. In practice, the signal is multiplied by a window function which is non-zero for a short period of time such that a longer time signal is divided into shorter segments of equal length. The Fourier transform of each shorter segment is taken as the window is sliding along the time axis, resulting in a two-dimensional representation of the signal both in time
1See the last paragraph of its subsection ‘‘Deep learning, path consistency, and domain knowledge embedding’’.
and frequency as (1),
STFT(m, n) =
N −1
X
k=0
x(k)w(k − m)e−j2πnk/N, (1)
where w(k) is the Hamming window function, and x(k) is the signal to be transformed. It is noticed that STFT (m, n) is essentially the discrete Fourier transform (DFT) of x(k)w(k − m). It indicates the variation of the phase and frequency magnitude of the signal over time. The time index m is normally considered to be slow time. In this study, the length of window function is selected as 128. Zero- padding is used to increase frequency resolution and then the spectrogram is computed by 4096-points (N = 4096) DFT.
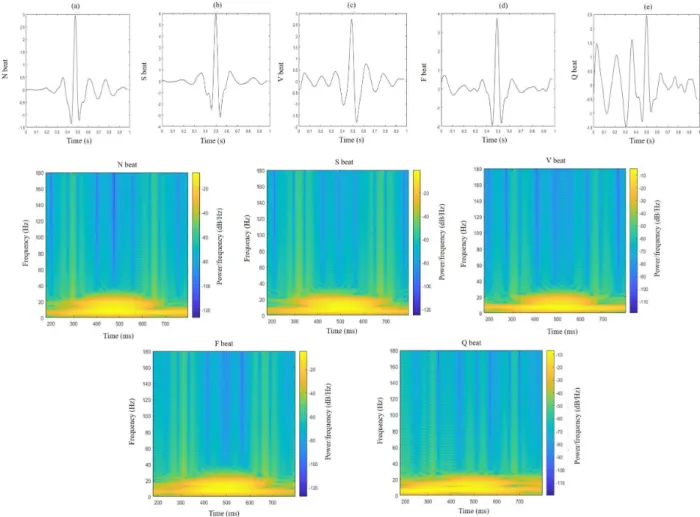
The first row of Fig.2 illustrates a typical example of the ECG signals of five classes of heartbeats, i.e., N, S, V, F, Q, and it could be observed that different classes of beats may share similar ECG morphology, especially N, S, V beats, making it hard to distinguish them just from morphological waveform. The second and the third rows of Fig.2show the corresponding image representations by discrete STFT. It can be seen that the discriminant patterns become more obvious than the original ECG signals, more suitable for convolutional layer to work. Only the frequencies within 0.3-20 Hz are maintained for further processing since DFT components of the preprocessed ECG multiplied by the window function mainly lie in this range. The final image is a 224×224 matrix containing both time and frequency response information.
D. CNN ARCHITECTURE
We design a network architecture to take the image repre- sentations of ECG signals which are normalized to be zero mean and unit standard deviation as input and then classify beats into N, S, V, F, Q classes. This FE based CNN for ECG heartbeat classification is shortly called FE-CNN classifier.
In order to make optimization of the deep neural network tractable, the shortcut connection is applied which propagates information well in deep neural networks, inspired by [24].
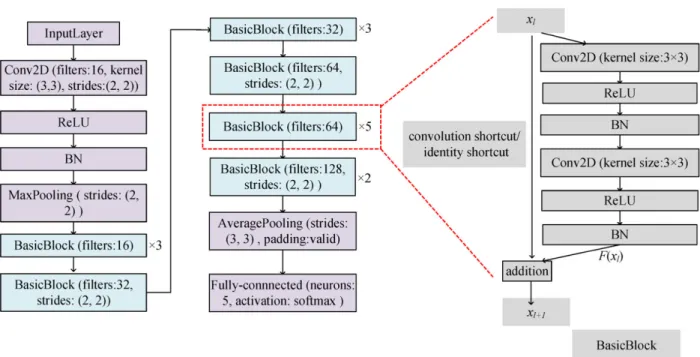
The architecture is given in Fig.3, with its BasicBlock illus- trated on the right side.
The BasicBlock is composed of two-layer convolution module. For every layer of BasicBlock, rectified linear unit (ReLU) [25] follows 2-D convolution (Conv2D) oper- ation, and then batch normalization (BN) [26] is applied to every feature map. The Conv2D represents the layer is convolved with kernel size (3, 3) using (2), where f is kernel.
y =
2
X
i=0 2
X
j=0
x(i, j)f (i, j) (2)
In addition, there are convolution and identity shortcuts that connect input and output. Convolution shortcut represents a 1 × 1 convolutional shortcut connection. Identity shortcut denotes the input is directly added to F (xl). It should be noted that the filter number of the first and second Conv2D and strides of the first Conv2D in BasicBlock are given in
FIGURE 1. The overview of the proposed method. Raw ECG is preprocessed to remove noise, then ECG is converted to image by feature enrichment, and the subtle features are extracted by CNN, finally ECG type is classified by fully-connected layer.
FIGURE 2. Morphological waveforms and the corresponding discrete STFT images with respect to N beat (a), S beat (b), V beat (c), F beat (d), Q beat (e).
overall CNN architecture, and stride of the second Conv2D is (1,1). The strides of first Conv2D all are (1, 1) if they are not given in overall CNN architecture. Convolution shortcut is used when strides are not (1, 1) in BasicBlock to make dimension match between xl and F (xl), otherwise identity shortcut is adopted. The BasicBlock with the same param- eters is multiplied by a number to represent the times of the BasicBlock repeated. For example, BasicBlock (filter:
128, strides:(2,2))×2 means filter number for both Conv2D and strides for the first Conv2D are 128, (2,2), convolution shortcut is adopted, and this block is repeated 2 times. It can
be inferred accordingly for the remaining BasicBlocks. The padding is the same if it is not given in the proposed CNN and pooling sizes are (3,3) for all.
IV. EXPERIMENTAL RESULTS
In this section, we will first present the training procedure of the proposed method. Then, we will present the per- formance metrics for the test and evaluation of the pro- posed FE-CNN classifier for heartbeat classification. Finally, we will compare the overall results achieved by the pro- posed algorithm with several state-of-the-art techniques in
FIGURE 3. The details of the proposed FE-CNN classifier. The overall CNN architecture is shown in the left which primarily contains one 31-layer CNN for feature extraction and one FC layer for type classification, whereas the BasicBlock mainly composed of two convolutional layers with shortcut connection is shown in the right. BasicBlock (filter: 64)×5 means the filter numbers for Conv2D is 64, strides of the convolution is (1, 1), identity shortcut is adopted and this block is repeated 5 times.
this field and analyze the impact of image sizes on FE-CNN for heartbeat classification.
A. TRAINING
The data used for training a patient-specific classifier are composed of two parts: common part and patient-specific part as [2], [3], [15], [21]. The common part comes from DS1 and is used for each patient. Common part consists of a total of 593 representative beats, including 191 type- N beats, 191 type-S beats, and 191 type-V beats, and all 13 type-F beats and 7 type-Q beats, which are randomly selected from each class from DS1. It contains a relatively small number of typical beats from each type of beats and is favorable to construct classifier to learn other arrhythmia patterns which are not included in the patient-specific data.
For patient-specific part, we follow the AAMI recommen- dations, it contains all the beats from the first 5 minutes of the corresponding patient’s ECG recording as [2], [3], [15], [21]. The remaining 25 minutes of data in DS2 are used as the testing data.
We trained the FE-CNN classifier with Adam [27] algo- rithm using an open source toolbox Keras with Tensor- Flow [28] as backend. During the training procedure, we used learning rate of 0.00035, batch size of 30 and epochs of 12 based on common data and learning rate of 0.00035, batch size of 12 and epochs of 12 based on patient-specific data to train CNN.
B. PERFORMANCE METRICS
Four statistical indicators are adopted to evaluate the per- formance of the FE-CNN classifier, i.e., classification
accuracy (Acc) which is the ratio of the number of correctly classified beats among the total number of beats, sensitiv- ity (Sen) which is the rate of correctly classified beats to all true events, specificity (Spe) which is the rate between cor- rectly classified non-events and all non-events, and positive predictive rate (Ppr) which is the rate of correctly classified events in all recognised events. Also, we adopt area under the curve (AUC) of receiver operating characteristic (ROC) and F1 score which is the harmonic mean of the Sen and Ppr.
Mathematically, the metrics are calculated as follows:
Acc = TP + TN
TP + TN + FP + FN, (3) Sen = TP
TP + FN, (4)
Spe = TN
TN + FP, (5)
Ppr = TP
TP + FP, (6)
F1 = 2Sen × Ppr
Sen + Ppr, (7)
where TP is true positive, TN is true negative, FP is false positive, and FN is false negative. Acc measures the over- all accuracy of the proposed method on all types of beats.
The other metrics measure the capability of the system per- formance to respective certain events. Complementary to the AUC, the F1 score, ranging from 0 to 1, is especially useful for multi-class prediction to optimize both Sen and Ppr simultaneously when the sample sizes of classes are imbalanced [29].
C. COMPARISON WITH OTHER METHODS
The 24 recordings of testing dataset in DS2 from the MIT-BIH arrhythmia database are used to evaluate the perfor- mance of the proposed FE-CNN for heartbeat classification.
The results are compared with all existing works [2], [3], [15], [21] that use the same training and testing data and conform to the AAMI recommendations.
Table2summarizes the confusion matrix by FE-CNN for all testing beats in DS2. The Kappa coefficient is calculated as 0.89 according to Table2, whereas the Kappa coefficients for [2], [3], [15], [21] are 0.79, 0.77, 0.82, 0.86, respec- tively, according to their confusion matrices. Thus, FE-CNN achieves the highest Kappa coefficient, which indicates bet- ter consistency between the classification result and ground truth.
TABLE 2. Confusion matrix of the ECG beat classification results for the 24 test recordings in the MIT-BIH arrhythmia database.
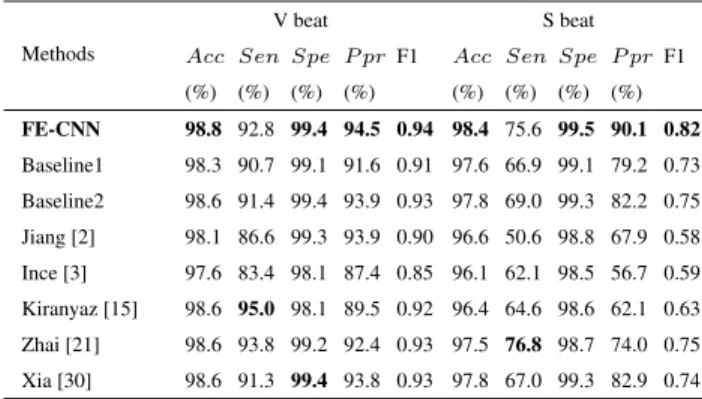
The performance metrics of FE-CNN as well as previous state-of-the-art works [2], [3], [15], [21], [30] are computed in Table3. It can be viewed that FE-CNN generally outper- forms other methods in most of the indicators. Especially, FE-CNN improves Ppr of S beats from the previous best 82.9% [30] to 90.1%. In terms of Sen, our method is a little bit below, but still comparable to, the highest one, and better than most of the other methods. Considering both Sen and Ppr simultaneously as F1 score, FE-CNN improves the previous best 0.75 [21] to 0.82 for S beat.
TABLE 3. The comparative performance for V beat and S beat classification between the proposed method and former studies (24 testing recordings).
To explicitly show the effect of feature enrichment, we also implement two baselines for comparisons. One baseline (Baseline1) is implemented by feeding ECG signals directly
into the network in Fig.3with input layer modified accord- ingly. The Baseline1 is similar to Kiranyaz et al.’s method [15], but there are still two differences, i.e., the Base- line1 employs a newly designed CNN network architecture but removes the 1-D DFT that is fused with the ECG series as input in Kiranyaz et al.’s method [15]. Comparing the Baseline1 with Kiranyaz et al.’s method [15] in Table3, for V beat, the F1 score of Baseline1 is slightly lower than Kiranyaz et al.’s network that has the best Sen score among all the meth- ods, but for S beat the Baseline1 shows better performance than Kiranyaz et al.’s network for all evaluation indicators, especially a much higher F1 score. The results indicate that the proposed network architecture in Fig.3is more powerful to learn ECG representations for S beat recognition, possibly due to shortcut connections which make information well propagated through deep neural networks.
Another baseline (Baseline2) is implemented by still keep- ing the network input as a vector, but the vector is formed by concatenating the frequency values in each time window which is calculated by feature enrichment using discrete STFT. It can be observed from Table3that the Baseline2 out- performs the Baseline1, which indicates that it is helpful for ECG recognition by introducing distinguishable information through feature enrichment. The Baseline2 is still not so good as FE-CNN, meaning that the 2-D image input works better than the 1-D vector input for CNN.
The method in [30], which aims to detect atrial fibrilla- tion by combining STFT and general convolutional layers, is also implemented for comparison. It can be observed from Table3 that, for V beat classification, the method in [30]
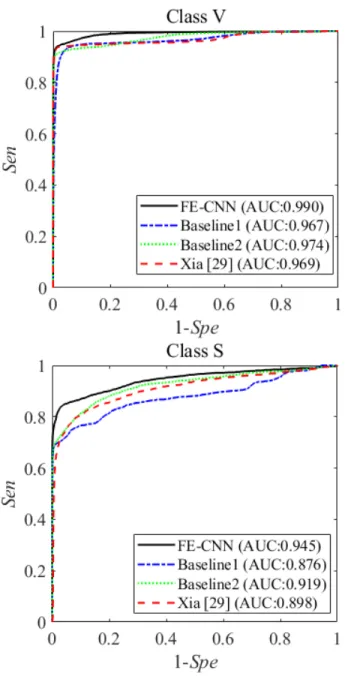
is comparable to the Baseline2 but surpassed by FE-CNN, whereas for S beat detection FE-CNN show advantage over the method in [30] in terms of Sen and Ppr. The ROC curves for V and S beats are plotted for further comparisons in Fig.4.
The corresponding AUCs for V beat in regard to FE-CNN, Baseline1, Baseline2, and [30] are 0.990, 0.967, 0.974, 0.969, respectively, and they are 0.945, 0.876, 0.919, 0.898 for S beat, respectively. FE-CNN again outperforms the method in [30], indicating that the feature enriched residual network is more suitable for ECG classification.
More detailed observations from Table3 are as follows.
First, the values of Sen and Ppr for V beat detection are higher than those for S beat detection. One possible reason is that S type is not well characterized in the training set due to the fact that the number of training samples is much smaller in S beat class than in N beat class. Therefore, more S beats are misclassified into N class. Another possible reason is that the morphologies of the beats, in particular, S beats, vary significantly from one beat to another under different circumstances or among different patients, and thus the beats in the first 5 minutes from patient-specific data and the beats from common data which are selected randomly can not suc- cessfully represent S beats even in time-frequency domain.
For several patients, there are no S beats belonging to patient- specific part in the training dataset, and hence S beats in the testing data can be wrongly classified into other classes, such
FIGURE 4. The comparative ROC curves for several methods with respect to V and S beats.
as N beats, owing to their strong resemblance to the pattern of N beats. The algorithms which are not consistent with AAMI standards use the S beats from specific patient after the first 5 minutes, and it is why these algorithms perform better than those in accordance with AAMI standards, as verified by Chen et al. [7]. Meanwhile, Sen and Ppr for V beat detection are both high above 92%, probably because V beats are usually well distinguished from other beat types.
The AAMI also suggests that the recognition of V beat and S beat can be addressed separately. In agreement with their recommendations, for V beat detection, the testing dataset contains 11 recordings (200, 202, 210, 213, 214, 219, 221, 228, 231, 233, and 234) and for S beat detection, the testing dataset contains 14 recordings (200, 202, 210, 212, 213, 214, 219, 221, 222, 228, 231, 232, 233, and 234). Following the
TABLE 4. The comparative performance for V beat and S beat classification between the proposed method and previous studies (11 recordings for testing V beat detection and 14 recordings for testing S beat detection).
above procedure, the corresponding results are summarized in Table4for comparisons. Our FE-CNN again performs the best with respect to most indicators, except for two cases.
For S beat detection in Table4, the method by [21] has the highest Sen value, whereas our method achieves the highest Ppr. Considering both Sen and Ppr by F1 score, our method is the best. Also, it should be noted that the method in [21]
adopts beat selection to yield common part, which is an unfair advantage over the other methods including FE-CNN without beat selection. Compared to [15] in terms of F1 score, the Baseline1 is slightly not so good as the method in [15] for V beat classification but becomes better for S beat detection.
The performance is improved by enriching the 1-D input with discrete STFT by the Baseline2, and further improved by FE-CNN. Therefore, we have demonstrated that FE-CNN achieves generally high performance for heartbeat classifi- cation in ECG signal. The improvement compared with the state-of-the-art works largely comes from the classification of S beats, for which the corresponding Ppr scores are low in other works [1]–[3], [15], [21].
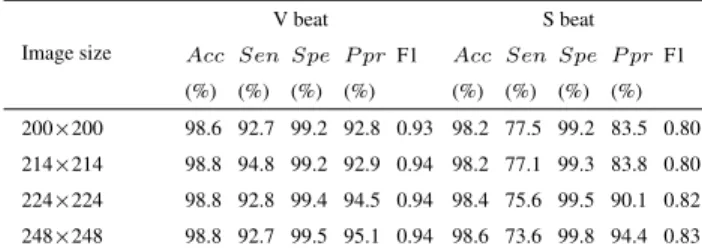
D. IMPACT OF IMAGE SIZE ON CLASSIFICATION
We conduct experiments by varying the window length and the number of spectrogram points to study their impact on the performance of FE-CNN. The image sizes are changed according to different values of window length and the num- ber of spectrogram points. We report the results for S and V beat detection on all 24 testing recordings in DS2 in Table5.
Generally, Acc and Spe are not very sensitive to the values of image size, whereas Sen and Ppr change in a coupled way as the image size varies. Increasing in Sen and decreasing in Pprusually happen at the same time, and vice versa.
The Sen is a very important indicator of the relative amount of false negatives. For the case of disease diagnosis, false- negative patients might miss the best time for appropriate treatment. To obtain the best Sen score, the image size of FE-CNN could be set at 214 × 214. Then, the obtained Senscore 94.8% for V beat is very close to 95.0% which
TABLE 5. V beat and S beat classification performance with different image sizes on 24 testing recordings.
in Table3is the highest Sen by Kiranyaz et al.’s method [15], whereas the obtained Sen score 77.1% for S beat is better than 76.8% which in Table 3 is the highest Sen by Zhai et al.’s method [21].
The Ppr is also important in clinical diagnosis, indicating the relative amount of false positives. The false-positive cases are healthy persons that are wrongly diagnosed to have the disease. Unnecessary further diagnosis or treatment might be conducted on the false-positive healthy persons, which not only results in extra time and medical cost for the healthy persons, but also leads to unnecessary workload for limited medical resources. To obtain the best Ppr score, the image size of FE-CNN could be set at 248 × 248. Then, the obtained Ppr scores, i.e., 95.1% for V beat and 94.4% for S beat, are better than the highest ones (i.e., 94.5% and 90.1%, respectively) in Table3both by FE-CNN using 224 × 224.
The F1 score is the tradeoff between Sen and Ppr by con- sidering their harmonic mean. In terms of F1 score, FE-CNN is slightly getting better or at least equally good as the image size grows, and the F1 scores of FE-CNN in Table5are all better than those by other methods in Table3.
To summarize, the image size, determined by the window length and the number of spectrogram points, mainly affects the values of Sen and Ppr for FE-CNN. The F1 score is relatively stable as the image size changes. The image size is a hyperparameter for training FE-CNN, and it could be adjusted according to the favor over Sen or Ppr in practical use while keeping the F1 score at a high level.
V. DISCUSSION
It is very challenging to identify arrhythmia beat due to large variation and similar pattern among different types of beats.
In order to differentiate them from each other, 1-D CNN was used in [15] to automatically extract ECG representations for classification. It shows superior performance than MOE [1], BBNN [2], and ANN [3] with manually extracted features as input. The performance is further improved by 2-D CNN [21].
We propose to use feature enrichment to introduce discrim- inant information to describe ECG beats, which is imple- mented by discrete STFT that converts 1-D morphological waveform into 2-D image. The images represent ECG beats from two dimensions with the variation of frequency over time and are good at encoding dependent structural patterns such as topological information, neighborhood information and so on. The recognition of arrhythmia beat becomes better
because the image patterns show to be more discrimina- tive. Compared to the existing works [2], [3], [15], [21], [30], our method achieves the comparable performance for V beat detection, and shows advantage for S beat detection in terms of Ppr and F1 score. Additionally, it deserves a further investigation on automatically determining an appro- priate image size for the tradeoff between Sen score and Ppr score, and explainability on misclassified samples can be fur- ther explored according to explainable artificial intelligence framework [31], e.g., Local Interpretable Model-Agnostic Explanations.
Feature enrichment is a general strategy for making deep learning more efficient for problem solving tasks in simpli- fied representations. As suggested in [18], turning ECG time series into images is just one possible direction, which is suitable for exploiting the powerful performance of deep net- works, whereas other possible directions include a manifold, a convex set, or a cluster of points, in high dimensional space.
Therefore, there is still room to explore other possibilities for further improvements and to generalize to other data in the field of health care, for accurate and early diagnosis of life- threatening diseases.
It should be noted that the common data for all the experi- ments in this paper are selected randomly. However, beat mor- phology shows significant variations from person to person and even in the same person under different circumstance, and hence it can potentially improve classifier performance through covering the most representative beats into the com- mon data intentionally instead of random selection as dis- cussed in [15], [21], [32].
VI. CONCLUSION
We have proposed to use feature enrichment to enhance the advantage of deep learning for patient-specific heartbeat classification, serving as a valuable tool for the detection of arrhythmias which are the electrical disorders of the heart.
Evaluations on the MIT-BIH arrhythmia database have shown that feature enrichment indeed improves the performance of deep learning.
We develop FE-CNN classifier with ECG signals enriched into images by discrete STFT. Compared to previous methods [2], [3], [15], [21], our FE-CNN classifier largely reduces false alarms and improves F1 score for S beat detection, while still maintaining comparable performance for V beat detec- tion. Actually, Acc, Sen, Spe, and Ppr for V beat detection are all well above 92%. These results support that this FE-CNN classifier is an effective and promising tool for automatic heartbeat classification without explicit ECG feature extrac- tion or postprocessing.
REFERENCES
[1] Y. H. Hu, S. Palreddy, and W. J. Tompkins, ‘‘A patient-adaptable ECG beat classifier using a mixture of experts approach,’’ IEEE Trans. Biomed. Eng., vol. 44, no. 9, pp. 891–900, Sep. 1997.
[2] W. Jiang and S. G. Kong, ‘‘Block-based neural networks for personalized ECG signal classification,’’ IEEE Trans. Neural Netw., vol. 18, no. 6, pp. 1750–1761, Nov. 2007.
[3] T. Ince, S. Kiranyaz, and M. Gabbouj, ‘‘A generic and robust system for automated patient-specific classification of ECG signals,’’ IEEE Trans.
Biomed. Eng., vol. 56, no. 5, pp. 1415–1426, May 2009.
[4] C. Ye, B. V. K. V. Kumar, and M. T. Coimbra, ‘‘Heartbeat classification using morphological and dynamic features of ECG signals,’’ IEEE Trans.
Biomed. Eng., vol. 59, no. 10, pp. 2930–2941, Oct. 2012.
[5] R. J. Martis, U. R. Acharya, and L. C. Min, ‘‘ECG beat classification using PCA, LDA, ICA and Discrete Wavelet Transform,’’ Biomed. Signal Process. Control, vol. 8, no. 5, pp. 437–448, Sep. 2013.
[6] T. Mar, S. Zaunseder, and J. P. Martínez, M. Llamedo, and R. Poll,
‘‘Optimization of ECG classification by means of feature selection,’’ IEEE Trans. Biomed. Eng., vol. 58, no. 8, pp. 2168–2177, Apr. 2011.
[7] S. Chen, W. Hua, Z. Li, J. Li, and X. Gao, ‘‘Heartbeat classification using projected and dynamic features of ECG signal,’’ Biomed. Signal Process.
Control, vol. 31, pp. 165–173, Jan. 2017.
[8] T. Teijeiro and P. Félix, J. Presedo, and D. Castro, ‘‘Heartbeat classification using abstract features from the abductive interpretation of the ECG,’’
IEEE J. Biomed. Health Informat., vol. 22, no. 2, pp. 409–420, Mar. 2018.
[9] S.-T. Pan, T.-P. Hong, and H.-C. Chen, ‘‘ECG signal analysis by using hidden Markov model,’’ in Proc. Int. Conf. Fuzzy Theory Appl., Nov. 2012, pp. 288–293.
[10] P. Li, Y. Wang, J. He, L. Wang, Y. Tian, T.-S. Zhou, T. Li, and J.-S. Li,
‘‘High-performance personalized heartbeat classification model for long- term ECG signal,’’ IEEE Trans. Biomed. Eng., vol. 64, no. 1, pp. 78–86, Jan. 2017.
[11] H. Li, D. Yuan, X. Ma, D. Cui, and Y. Cao, ‘‘Genetic algorithm for the opti- mization of features and neural networks in ECG signals classification,’’
Sci. Rep., vol. 7, Jan. 2017, Art. no. 41011.
[12] S. M. Mathews, ‘‘Dictionary and deep learning algorithms with applica- tions to remote health monitoring systems,’’ Univ. Delaware, Newark, DE, USA, Tech. Rep., 2017.
[13] S. M. Mathews, C. Kambhamettu, and K. E. Barner, ‘‘A novel application of deep learning for single-lead ECG classification,’’ Comput. Biol. Med., vol. 99, pp. 53–62, Aug. 2018.
[14] G. Sannino and G. D. Pietro, ‘‘A deep learning approach for ECG-based heartbeat classification for arrhythmia detection,’’ Future Gener. Comput.
Syst., vol. 86, pp. 455–466, Sep. 2018.
[15] S. Kiranyaz, T. Ince, and M. Gabbouj, ‘‘Real-time patient-specific ECG classification by 1-D convolutional neural networks,’’ IEEE Trans.
Biomed. Eng., vol. 63, no. 3, pp. 664–675, Mar. 2016.
[16] U. R. Acharya, S. L. Oh, Y. Hagiwara, J. H. Tan, M. Adam, A. Gertych, and R. S. Tan, ‘‘A deep convolutional neural network model to classify heartbeats,’’ Comput. Biol. Med., vol. 89, pp. 389–396, Oct. 2017.
[17] U. R. Acharya, S. L. Oh, Y. Hagiwara, J. H. Tan, H. Adeli, and D. P. Subha,
‘‘Automated EEG-based screening of depression using deep convolu- tional neural network,’’ Comput. Methods Programs Biomed., vol. 161, pp. 103–113, Jul. 2018.
[18] L. Xu, ‘‘Deep bidirectional intelligence: AlphaZero, deep IA-search, deep IA-infer, and tpc causal learning,’’ Appl. Informat., vol. 5, no. 1, Dec. 2018.
[19] Recommended Practice for Testing and Reporting Performance Results of Ventricular Arrhythmia Detection Algorithms, Assoc. Adv. Med. Instrum., Arlington, VA, USA, 1987.
[20] R. Mark and G. Moody MIT-BIH Arrhythmia Database Directory. Cam- bridge, MA, USA: MIT Press, 1988.
[21] X. Zhai and C. Tin, ‘‘Automated ECG classification using dual heartbeat coupling based on convolutional neural network,’’ IEEE Access, vol. 6, pp. 27465–27472, 2018.
[22] G. B. Moody and R. G. Mark, ‘‘The impact of the MIT-BIH arrhythmia database,’’ IEEE Eng. Med. Biol. Mag., vol. 20, no. 3, pp. 45–50, May/Jun. 2001.
[23] M. S. Manikandan and K. P. Soman, ‘‘A novel method for detecting R-peaks in electrocardiogram (ECG) signal,’’ Biomed. Signal Process.
Control, vol. 7, no. 2, pp. 118–128, 2012.
[24] K. He, X. Zhang, S. Ren, and J. Sun, ‘‘Identity mappings in deep residual networks,’’ in Proc. Eur. Conf. Comput. Vis., 2016, pp. 630–645.
[25] V. Nair and G. E. Hinton, ‘‘Rectified linear units improve restricted boltz- mann machines,’’ in Proc. 27th Int. Conf. Mach. Learn. (ICML), 2010, pp. 807–814.
[26] S. Ioffe and C. Szegedy, ‘‘Batch normalization: Accelerating deep network training by reducing internal covariate shift,’’ Feb. 2015, arXiv:1502.03167. [Online]. Available: https://arxiv.org/abs/1502.03167 [27] D. P. Kingma and J. Ba, ‘‘Adam: A method for stochastic
optimization,’’ Dec. 2014, arXiv:1412.6980. [Online]. Available:
https://arxiv.org/abs/1412.6980
[28] M. Abadi, P. Barham, J. Chen, Z. Chen, A. Davis, J. Dean, M. Devin, S. Ghemawat, G. Irving, and M. Isard, ‘‘Tensorflow: A system for large- scale machine learning,’’ in Proc. OSDI, vol. 16, 2016, pp. 265–283.
[29] Y. H. Awni, P. Rajpurkar, M. Haghpanahi, G. H. Tison, C. Bourn, M. P. Turakhia, and A. Y. Ng, ‘‘Cardiologist-level arrhythmia detection and classification in ambulatory electrocardiograms using a deep neural network,’’ Nature Med., vol. 25, pp. 65–69, Jan. 2019.
[30] Y. Xia, N. Wulan, K. Wang, and H. Zhang, ‘‘Detecting atrial fibrillation by deep convolutional neural networks,’’ Comput. Biol. Med., vol. 93, pp. 84–92, Feb. 2018.
[31] S. M. Mathews, ‘‘Explainable artificial intelligence applications in NLP, biomedical, and malware classification: A literature review,’’ in Proc.
Intell. Comput.-Proc. Comput. Conf., Jul. 2019, pp. 1269–1292.
[32] M. M. Al Rahhal, Y. Bazi, H. AlHichri, N. Alajlan, F. Melgani, and R. R. Yager, ‘‘Deep learning approach for active classifica- tion of electrocardiogram signals,’’ Inf. Sci., vol. 345, pp. 340–354, Jun. 2016.
QINGSONG XIE received the B.S. degree in elec- tronic information engineering from the University of Electronic Science and Technology of China, Chengdu, China, in 2015. He is currently pursuing the Ph.D. degree in microelectronics with Shang- hai Jiao Tong University, Shanghai, China.
His research interests include machine learning and signal processing.
SHIKUI TU received the B.Sc. degree from Peking University, in 2006, and the Ph.D. degree from The Chinese University of Hong Kong, in 2012. He was a Postdoctoral Associate with UMass Worcester, from December 2012 and Jan- uary 2017. He is currently a tenure-track Associate Professor with the Department of Computer Sci- ence and Engineering, Shanghai Jiao Tong Uni- versity (SJTU), and the Academic Secretary of the Center for Cognitive Machines and Computa- tional Health (CMaCH). He has published more than 30 academic articles in top conferences and journals, including Science, Cell, and NAR, with high impact factors. His research interests include machine learning and bioinformatics.
GUOXING WANG (M’06–SM’13) received the Ph.D. degree in electrical engineering from the University of California at Santa Cruz, Santa Cruz, CA, USA, in 2006.
He was a member of the Technical Staff in Agere Systems, San Jose, CA, USA, from 2006 to 2007. From 2007 to 2009, he joined the Second Sight Medical Products, Sylmar California, where he designed the integrated circuits chip that went into the eyes of blind people to restore vision. He is currently a Professor with the School of Microelectronics, Shanghai Jiao Tong University, Shanghai, China. He has published in various peer-reviewed journals and conferences. His current research interests include biomedical electronics and bio-inspired circuits and systems.
Dr. Wang was the local Chair for the first IEEE Green Circuits and Systems (ICGCS), in 2010, and for the second Asia Pacific Conference on Postgraduate Research in Microelectronics & Electronics (PrimeAsia), in 2010. He was the Technical Program Chair for the IEEE Conference on Biomedical Circuits and Systems, in 2016. He was an Associate Editor for the IEEE TRANSACTIONS ONCIRCUITS ANDSYSTEMS—II (TCAS-II), from 2012 to 2015, and the Guest Editor for the IEEE JOURNAL ONEMERGING AND
SELECTEDTOPICS INCIRCUITS ANDSYSTEMS(JETCAS), in 2014, and the IEEE TRANSACTIONS ONBIOMEDICALCIRCUITS ANDSYSTEMS, in 2014. He has been the Deputy Editor-in-Chief of the IEEE TRANSACTIONS ONBIOMEDICALCIRCUITS ANDSYSTEMS(TBioCAS), since 2016, and the Vice President of the IEEE Circuits and Systems Society, since 2019.
YONG LIAN (M’90–SM’99–F’09) research inter- ests include biomedical circuits and systems and signal processing.
Dr. Lian is a Fellow of the Academy of Engineering Singapore, a member of the IEEE Periodicals Committee, a member of the IEEE Biomedical Engineering Award Commit- tee, and a member of Steering Committee of the IEEE TRANSACTIONS ON BIOMEDICAL CIRCUITS AND SYSTEMS. He was a recipient of more than 15 awards for his research including, the IEEE Circuits and Systems Society’s Guillemin-Cauer Award, the IEEE Communications Society Mul- timedia Communications Best Paper Award, the Institution of Engineers Singapore Prestigious Engineering Achievement Award, and the Winning of the Design Contest Award in ISLPED 2015. He is currently the President of the IEEE Circuits and Systems (CAS) Society, the Chair of the IEEE Periodicals Partnership Opportunities Committee. He was the Editor-in- Chief of the IEEE TRANSACTIONS ONCIRCUITS ANDSYSTEMSPART—II for two terms. He served as the Vice President for Publications and the Vice President for Region ten of the IEEE CAS Society, and many other roles in the IEEE. He is also the Founder of the IEEE Biomedical Circuits and Systems Conference (BioCAS) and the Asia Pacific Conference on Postgraduate Research in Microelectronics and Electronics (PrimeAsia).
LEI XU (SM’94–F’01) received the Ph.D. degree from Tsinghua University, in March 1987.
He joined Peking University as a Postdoctoral Researcher, in 1987, and promoted exceptionally to an Associate Professor, in 1988. He was a Postdoctoral Researcher and a Visiting Scientist in Finland, Canada, and USA (including Prof. A.
Yuille team in Harvard and Prof. M. Jordan team in MIT), from 1989 to 1993. He joined CUHK has been a Senior Lecturer, since 1993, a Professor, since 1996, and the Chair Professor, form 2002 to 2016. He also joined SJTU has been the Zhiyuan Chair Professor, since summer 2016. He is currently an Emeritus Professor of computer science and engineering with the Chinese University of Hong Kong (CUHK), the Zhiyuan Chair Professor with the Computer Science and Engineering Department, Chief Scientist of AI Research Institute, Chief Scientist of Brain Sci & Tech Research Centre, Shanghai Jiao Tong University (SJTU), the Director of the Zhang Jiang National Lab, Neural Computation Research Centre, Brain and Intelligence Science-Technology Institute. He has Published more than 400 articles, and internationally known with well-cited contributions on RHT, RPCL, clas- sifier combination, mixture models, Lmser, nonlinear PCA, BYY harmony, and bidirectional learning, with more than 5500 citations (more than 3900 by top-ten articles with 1319 for top-one and 119 for tenth) according to Web of Science versus more than 13500 citations (more than 8200 by top-ten articles with 2773 for top-one and 298 for tenth) according to Google Scholar.
Dr. Xu is a Fellow of the International Association for Pattern Recognition, in 2002, and the European Academy of Sciences (EURASC), in 2003.
He was a recipient of several national and international academic awards, including the 1993 National Nature Science Award, the 1995 Leader- ship Award from International Neural Networks Society (INNS), and the 2006 APNNA Outstanding Achievement Award. He has given over dozens keynote /invited lectures at various international conferences. He received the Ph.D. degree thesis from Tsinghua University, in 1986. He has served as the Editor-in-Cheif and an Associate Editor of several academic journals, including, Neural Networks, from 1994 to 2016, Neurocomputing, from 1995 to 2017, and the IEEE TRANSACTIONS ONNEURALNETWORKS, from 1994 to 1998. He has taken various roles in academic societies, e.g., member of the INNS Governing Board, from 2001 to 2003, the INNS Award Committee, from 2002 to 2003, a Fellow Committee of the IEEE Computational Intelli- gence Society, from 2006 to 2007, a EURASC Scientific Committee, from 2014 to 2017, and the APNNA Past President, from 1995 to 1996, and the General Cochair, the PC Cochair, the Honorary Chair, the International Advi- sory Committee Chair, as well as program/organizing /advisory committee member on major world conferences on Neural Networks, additionally, a nominator for the prestigious Kyoto prize, in 2004, 2008, 2012, 2016, and 2020, and for the LUI Che Woo Prize, in 2016, 2017, 2018, and 2019.