Research Express@NCKU Volume 7 Issue 6 - February 6, 2009 [ http://research.ncku.edu.tw/re/articles/e/20090206/3.html ]
Assembly Behavior and Monolayer
Characteristics of OH-Terminated Alkanethiol
on Au(111): in situ STM and Electrochemical
Studies
Ching-Fa Chi, Yuh-Lang Lee
*and Huang-Shan Weng
Department of Chemical Engineering, College of Engineering, National Cheng Kung University
Nanotechnology, 19, 065609 (2008)
I
ntroductionSelf-assembled monolayers (SAMs) on metal surfaces have attracted much attention during the past twenty years, motivated by their potential applications in corrosion protection , wetting, friction, adhesion,
microelectronics, and sensors. SAMs are known to be an effective method to modify the surface property of a material. The interfacial property of a material with the environment it contacts can be adjusted by controlling the functional group of a SAM pending outside the surface. The specific thiol/metal interaction provides a force to anchor an organic molecule via chemical bond to the metal surface. In addition, the Van der Waals
(VDW) interaction between the thiol molecules plays an important role to obtain a closely packed and ordered adlayer. Most of the studies regarding the SAMs were performed on methyl-terminated alkanethiols adsorbed on gold substrates, and only few have been conducted on the structure
characteristics of alkanethiols with specific functional head groups, such as COOH, NH2, and OH. In a previous study, in-situ STM with electrochemical system was used to study the adsorption behavior of an OH-terminated alkanethiol, 11-mercapto-1-undecanol [HS(CH2)11OH, MUO], on the Au(111) surface. In this work, an OH-terminated alkanethiol with shorter chain length, 6-mercapto-1-hexanol [HS(CH2)
6OH, MHO], was used instead of the MUO to study the effect of the chain length on the adsorption behavior of the OH-terminated alkanethiol.
Experimental Section
The STM used was a Nanoscope E (Digital Instruments, Santa Barbara, CA.) equipped with an electrochemical system and a high-resolution scanner (maximum scan size ca. 500 nm). In the STM system, a Pt wire was used as a quasi-reference electrode and the measured potential was calibrated to the RHE in this work. The tip was made of tungsten wire (diameter 0.25 mm) chemically etched in a 2 M KOH solution. The tip was further insulated with transparent nail polish to cut off the faradic current. In the imaging process, the tip was controlled at a potential positive than the working sample and the potential difference between tip and sample was expressed as Ebias. The STM imaging was operated at the constant-current mode throughout this study.
Results and Discussion
Cyclic Voltammetry. To investigate how an organic adlayer affects electron transfer across an interface, potassium hexacyanoferrate(II) (K4[Fe(CN)6] ) was used as a probe to study the redox reaction on the gold electrode. For the bare Au(111) electrode (Figure 1a), the anodic and cathodic peaks appear, respectively, at ca. 0.78 and 0.57 V, attributed to one electron redox couple of ferro/ferricyanide. The small hump at ca. 0.67 V in the positive scan of the CV curve is probably caused by the reconstruction of Au(111) surface, which can be associated with the adsorption of the anions, ClO4-. The perchlorate adlayer may give resistance to the charge transfer, resulting in a higher oxidation potential of Fe(CN)64-. When the Au(111) electrode was modified by MHO, the hump corresponding to the surface
reconstruction disappears in the CV profile (Figure 1b). Besides, the separation of the anodic and cathodic peaks decreases slightly (∆Ep = 0.15 V), as shown in Figure 1b. These results indicate that the MHO adlayer does not block the charge transfer in the ferro/ferricyanid redox process. On the other hand, a slight promotion was observed. This result is contrary to the blocking effect commonly found for monolayers of long alkanethiols. This promoting effect could be partially attributed to the adsorption of MHO molecules, which inhibited the adsorption of ClO4- or species produced in the redox reaction. For comparing the effect of chain length on the charge transfer, the CV experiment was also performed on a MUO-modified Au(111) electrode, and the result was shown in Figure 1c. Apparently, the MUO adlayer has a significant resistance to the charge transport, attributed to its longer chain length and the closer- packed structure, which will be described in a later section of this paper. The inset in Figure 2 is a plot of peak current (ip) vs. (scan rate)1/2, and the linear correlation implies the reversible and diffusion-
controlled characteristics of this redox reaction.
Figure 1. Cyclic voltammograms obtained for bare Au(111) electrode (a), and the electrode modified by MHO (b), or MUO (c) SAM in a 0.1 M HclO4 solution containing 1 mM K4[Fe(CN)6].
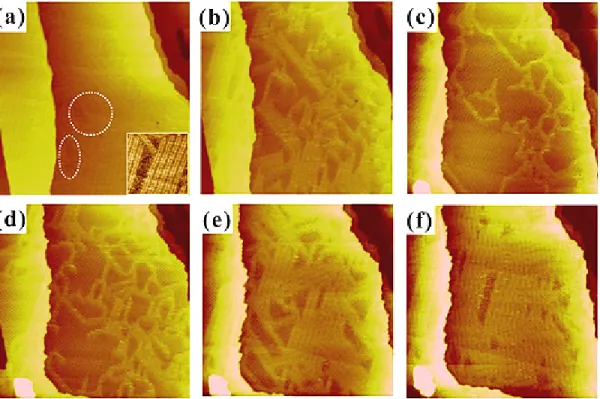
In-Situ STM Study. Before the introduction of MHO, the Au(111) electrode was held at 0.15 V in a 0.1 M HclO4 solution. The observation of the herringbone feature by high resolution scan (not shown here) indicated the formation of a well-defined Au(111) surface. After introducing about 10 μM MHO, in-situ STM imaging was used to examine the adsorption of MHO. No adsorption phase could be imaged at 0.15 V. The potential was positively swept, and an adsorbed MHO phase was observed at 0.28 V. Therefore, the evolution of the adsorbed structure was studied at 0.28 V, and the time-dependent in-situ STM images are shown in Figure 2. Within the initial 5 min of the MHO dosing, the reconstructed
herringbone structure of the Au(111) surface was the main phase that appeared on the terraces (Figure 2a). However, dark regions of low contract and small area, corresponding to the adsorbed phase of MHO, were also observed near the step (marked by the dotted circles). A higher resolution image of the adsorbed region, shown in the inset of Figure 2a, indicates that the phase is disordered in the initial
stage. With further increase of the adsorption time, dark patches corresponding to an ordered adsorbed structure of MHO appear gradually, and an image acquired 7 min after MHO introduction was shown in Figure 2b. A closer examination indicates that the adsorbed domain has a striped structure, growing initially on the face-centered-cubic (fcc) stacking region rather than on the hexagonal-centered-packed (hcp) one. These results are similar to the initial adsorption behavior of MUO on the Au(111) surface.
Figure 2. Wide-area STM images (200 × 200 nm2) showing the adsorption behavior of MHO on an Au (111) surface. The potential was held at 0.28 V in 0.1 M HclO4.
By prolonging the adsorption time, the adsorbed striped structure grows gradually. In an STM image acquired 10 min after MHO introduction (Figure 2c), the adsorbed domains extend over the whole scan area. However, the herringbone feature of the Au(111) surface does not disappear completely in Figure 2c, nor in the following adsorption process performed at 0.28 V. (Figures 2d and 2e). The herringbone phase can be recovered almost completely, as shown in an STM image obtained 32 min after MHO dosing (Figure 2f). The recovery of the reconstructed feature of an Au(111) surface indicates the
desorption of MHO from the substrate, which also implies that the weak interaction between MHO and Au substrate. The adsorbed layer is unstable at the applied voltage. The reversible adsorption-desorption found at this potential is attributed to the effect of tunneling current during the STM imaging process.
Such effect is especially important when the adlayer has weak interaction to the substrate. It is
noteworthy that, when the adsorption is performed at a more positive potential, the adsorbed layer does not desorb and will undergo a structural evolution which will be discussed later in this paper. Compared to the adsorption behavior of MUO reported in a previous paper1, a higher voltage is required for the adsorption of the shorter thiol molecules, MHO. It is known that the Van der Waals (VDW) interaction between adsorbed thiol molecules is an important factor in the formation of an ordered and stable adlayer. Since MHO has a shorter chain length, the VDW interaction between MHO is weaker and the interaction between MHO and electrolyte solution is higher, both are unfavorable to the adsorption of MHO on to a solid substrate. Therefore, a more positive applied voltage (higher driving force) is required to induce the adsorption.
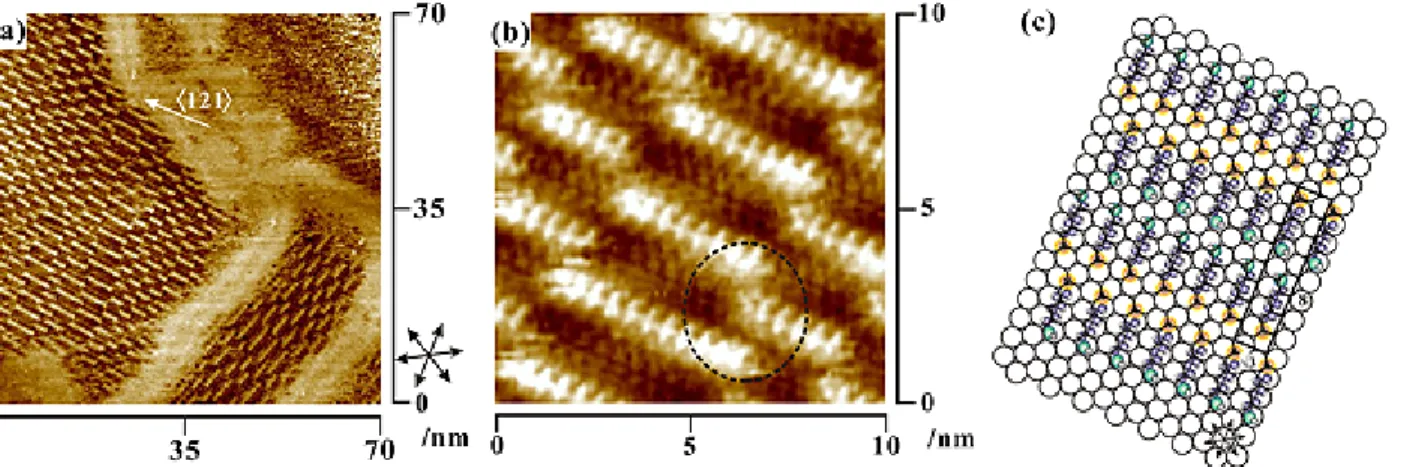
Figure 3. High-resolution STM images (a, b) and the corresponding model proposed (c) for the striped phase of the MHO adlayer on Au(111).
The molecular arrangement of MHO for the striped structure shown in Figure 2 was analyzed by high- resolution scan and the images are shown in Figure 3. The striped structure is clearly demonstrated by the short bright lines which align parallel to the <121> direction of the underlying Au(111) lattice. The bright lines are attributed to the S atoms of MHO molecules which take a head-to-head configuration in the striped structure. The molecular length of MHO measured from the high-resolution scan is about 0.90 ± 0.01 nm, equivalent to the theoretical length of a MHO molecule (ca. 0.89 nm). The dark region centered between two bright lines is the location of the hydrocarbon chains and the end groups (-OH), which demonstrate as spots of weak brightness in the 10 × 10 nm2 scan (Figure 3a). The lengths of the stripes for the MHO SAM are short, ranging between 2 and 7 nm. Compared with the long stripe length found for the MUO SAM, the short striped structure on the MHO SAM is attributed to the short chain length, which leads to a weaker VDW interaction. Figure 3a shows that alternate bright and dark lines form a striped column, and the MHO SAM is composed by columns of striped lines. At the column- column interface, the stripped lines of one column may penetrate into a neighboring column, as
indicated by the circle. At this region, the distance between bright lines is only about half of the distance in the column. Therefore, overlapping of the molecular chains is expected in this region. The distance between two bright rows in the <110> direction was measured to be 2.30 ± 0.2 nm, which is about eight times of the gold diameter (a = 0.289 nm). The intermolecular distance in the <121> direction was measured to be about 0.5 nm, equivalent to √3 times of the Au lattice constant. Therefore, the ordered lattice of the striped structure is determined to be (8 × √3), as proposed in Figure 3b. Two thiol
molecules were contained in a unit cell and the corresponding surface coverage was 0.125. This structure is similar to the one reported for MUO SAM, (12 × √3).
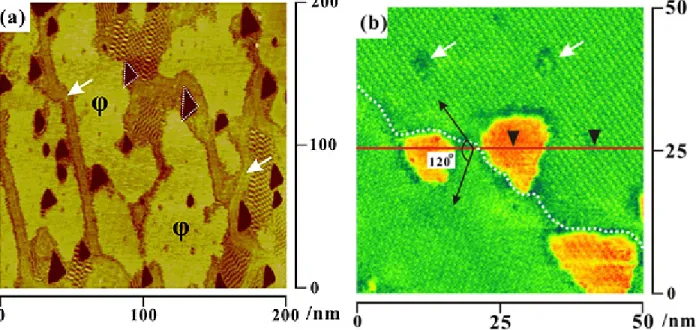
Figure 4. MHO adlayer from striped phase to a more condensed structure (φ phase) after elevating the potential from 0.28 to 0.35 V. Figure (b) is a higher resolution image.
To obtain a stable adlayer of striped phase without re-desorption of MHO, the potential was stepped from 0.28 to 0.35 V when the desorption was inspected. After this action, the herringbone structure disappears gradually and, furthermore, a phase transition from striped phase to a new structure occurs as indicated by the appearance of dark pits. Figure 4a shows the STM image acquired after 5 min of potential elevation. The new-formed phase, termed the φ phase, and the striped structure, as well as few herringbone lines (indicated by the arrows), are observed simultaneously in Figure 4a. The dark pits are known to be the etching structure caused by the thiol adsorption on the gold surface and their
appearance is always associated with the formation of a more condensed adlayer. It is interesting to find that most of the dark pits in Figure 4a appeared as triangular-like shapes, indicating the anisotropy of the transition energy at the step-edge interface2. The new-formed phase in the initial transition stage appears as domains of higher brightness (Figure 4a), inferred to be an orientation with the molecular axis lifting off the gold surface. By prolonging the adsorption time, an ordered lattice of the φ phase gradually developed at the expense of the striped phase and herringbone structure. At about 15 min after elevation of potential, the scanning area is completely covered by ordered domains of φ phase (Figure 4b). A higher resolution image (Figure 4b), obtained by zooming in the dashed square indicated in Figure 4b, shows two ordered domains oriented 120o with respect to each other. A close examination of the dark patches located on the boundary of the ordered domains shows an ordered lattice of MHO adlayer inside the etching patches. A depth profile analysis across the etching patches (Figure 4b) indicates that the etching patch has a depth of 0.23 ± 0.02 nm, corresponding to the single-atom step height of Au(111).
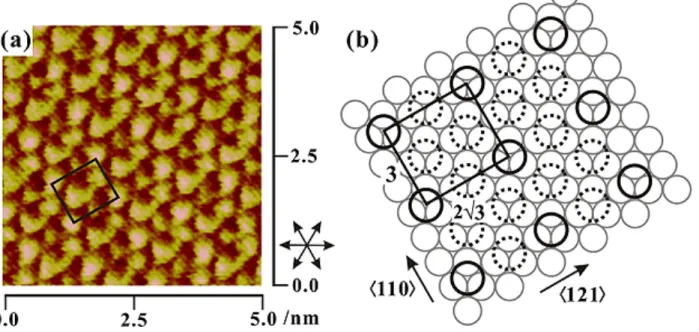
Figure 5. High-resolution STM images (a) and a ball model proposed (b) for the φ phase of MHO adlayer.
Figure 5 shows a high resolution STM image for the φ phase in Figure 4. This figure shows that the image was composed of spots with different contrasts. Each spot is attributed to an individual MHO molecule.
The distance between two neighbor spots, regardless of the brightness, is about 5 ± 0.2 Å, corresponding to √3 times of the Au lattice constant. This lattice parameter indicates that the MHO molecules adsorb as a (√3 × √3)R30° pseudo-hexagonal lattice, which is commonly found for SAMs of long alkanethiols and for MUO. However, the modulation in intensity reflects that the adsorbed molecules do not have
identical conformation. The unit cell corresponding to the moiré pattern is a rectangle, as superimposed in Figure 5a. Four spots of higher brightness are located at the corners of the rectangle and two weaker spots are positioned on two opposite sides of the rectangle. Inside the unit cell, two spots of different brightness were located. The two vectors of the unit cell align along the close-packed direction (the
<110> direction) and the <121> direction of the Au(111) substrate. The periodicities in the two directions are measured to be about 0.87 and 1.01 nm, respectively, corresponding to 3 and 2√3 times the
intermolecular spacing of the Au(111) substrate. Therefore, this structure is assigned to be c(3 ×2√3), as the model proposed in Figure 5b. The unit cell contains 4 molecules, corresponding to a surface coverage of 0.33. The reasons leading to different contrasts of a molecule in the STM image include the molecular conformations (gauche or trans) and the adsorption sites (3-fold, 2-fold bridge, or top sites)3. For the present case, the MHO molecules are found to have identical adsorption sites (the 3-fold sites are supposed) and the modulation of intensity should be attributed to the difference in the molecular conformation.For the MUO that has longer chain length, an adsorbed lattice of (√3 ×√3)R30˚ without intensity modulation was reported. Certainly, the structure difference between MHO and MUO
monolayers arises from the difference in the molecular length. It is inferred that the shorter molecular chain of MHO gives a weaker intermolecular interaction between adsorbed MHO, which leads to a higher flexibility of the molecular chains and, therefore, a different conformations of the adsorbed molecules.
Figure 6. Cyclic voltammograms for MHO- (solid line) and MUO- (dash line) modified Au(111) electrodes recorded at 50 mV/s in 1 M KOH.
Electrochemical reductive desorption of MHO SAM in alkaline electrolyte. The strength of the Au-S bond and the coverage of a SAM on an Au(111) surface can be evaluated by electrochemical reductive desorption in a basic solution. The peak potential is related to the strength of an SAM bound to the substrate while the charge of the peak corresponds to the coverage of thiol molecules. A MHO SAM was first prepared at a potential of 0.4 V for about 40 min to confirm the formation of a full covered monolayer. The CV analysis was then performed in a 1 M KOH solution at a scan rate of 50 mV/s. Figure 6 shows the cyclic voltammogram obtained from the MHO SAM, as well as from the MUO for
comparison. For the MHO SAM, a sharp reductive peak appears at -0.65 V, and a smaller peak occurs at a more negative potential (-0.82 V). The charges corresponding to the reduction peaks at (-0.65 V) and (- 0.82 V) were measured to be 78.5 ± 0.5 μC/cm2 and 21.2 ± 0.5 μC/cm2, respectively, equivalent to surface coverage ratios of 0.33 and 0.096. The surface coverage measured from the CV analysis (0.33 ± 0.05) is consistent to the value deduced from the STM image (0.33). For the splitting reductive peaks of MHO SAM, it is very possible that distinct ionic permeabilities, different substrate binding site (such as terraces, step edges and thiol defect boundaries). Therefore, the strength of the adsorbed molecules bound to the substrate is not identical in the MHO SAM, leading to the appearance of splitting reductive peaks. Other possible reasons proposed in the literature to explain this phenomenon include different degrees of ordered structure and different hybridization of the Au/S bond.The stripping behavior of a MUO monolayer was also shown in Figure 6 for comparison. The desorption peak of MUO SAM is negatively shifted compared to that of MHO, indicating more energy is needed to cleave the Au-S bond.
Apparently, this result is also attributed to the stronger intermolecular interaction due to the longer molecular length of MUO.
Conclusion
The adsorption behavior of MHO on an Au(111) surface was studied by in-situ STM in an electrochemical system. The results show that an applied potential of 0.28 V is required to initiate the adsorption of MHO molecules on an Au(111) surface, forming an ordered stripped phase with a molecular
arrangement of (8 ×√3). However, the striped phase is not stable at 0.28 V, and it may transfer back to the herringbone structure of Au(111) surface due to the desorption of MHO. At a higher potential (0.35 V), a stable MHO adlayer was obtained and the adlayer can undergo a phase evolution from the striped phase to a more condensed structure (the φ phase), identified as c(3 ×2√3). High resolution STM image reveals a modulation of intensity on the condensed structure, reflecting the presence of various
conformations of adsorbed molecules. The reductive desorption experiment shows that MHO SAM has a smaller stripping potential compared to that of MUO, attributed to the weaker VDW interaction between MHO molecules. Compared with the adsorption behavior of MUO SAM, the differences caused by the shorter chains of the MHO include the adsorption potential, lattice structure, charge permeability across the SAM, and the stripping behavior.
(1)Yang, Y. C.; Chang, T. Y.; Lee, Y. L. J. Phys. Chem. C 2007, 111, 4014-4020.
(2)Zhang, J.; Chi, Q. J.; Ulstrup, J. Langmuir 2006, 22, 6203-6213.
(3)Poirier, G. Chem. Rev. 1997, 97, 1117-1128.
![Figure 1. Cyclic voltammograms obtained for bare Au(111) electrode (a), and the electrode modified by MHO (b), or MUO (c) SAM in a 0.1 M HclO 4 solution containing 1 mM K 4 [Fe(CN) 6 ]](https://thumb-ap.123doks.com/thumbv2/9libinfo/9039153.325011/2.918.106.829.594.770/figure-voltammograms-obtained-electrode-electrode-modified-solution-containing.webp)