各類高空短暫發光現象的超低頻與極低頻至甚低頻電波特性
176
0
0
全文
(2) II.
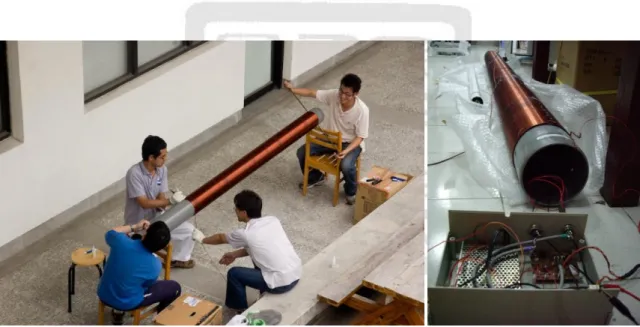
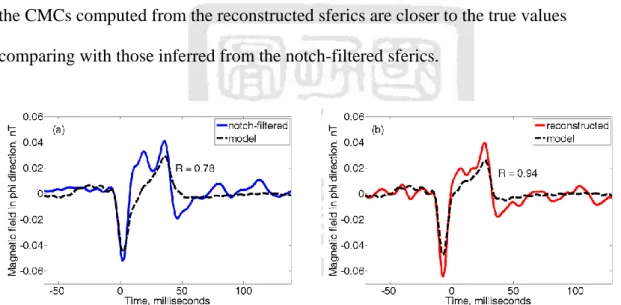
(3) 摘要 高空短暫發光現象(Transient Luminous Events, TLEs)是近十年來成功大學天 文實驗室的重點研究項目,自 2001 年起團隊每年在台灣進行例行的地面觀測,捕捉 鄰近地區的高空短暫發光現象,2004 年台灣的第二顆自主衛星”福爾摩沙衛星二號” 升空,除了搭載白天遙測用的光學觀測設備,在夜晚也有一套科學酬載"高空閃電 影像儀"(ISUAL) ,自太空觀測全球高空短暫發光現象的光學和光譜訊號。直到現 在,地面和星載觀測仍在進行,並累積了數萬筆的觀測結果。但是,這些光學和光 譜資料,並不能直接對應於引發紅色精靈(sprite) 、精靈暈盤(halo)和淘氣精靈(elve) 等事件的閃電放電,或更進一步反演如:紅色精靈電流(sprite current)和巨大噴流 (gigantic jet)等事件本身自有的放電現象。因此,拓展觀測的資料類型是必要地; 另一方面,閃電放電中能量最高的回擊電流,因為通道長度(數公里到十數公里) 和放電時間(數十微秒內)的關係,輻射的主要能量集中在超低頻(ULF)至甚低頻(VLF) 的無線電頻帶中。這波段的電磁場訊號,恰小於電漿頻率,而可以在地表和低電離 層間不斷反射前進,達到遠距偵測訊號的效果。綜合上述論點,量測超低頻至甚低 頻的電磁場訊號,已成為團隊的首要目標。第一座超低頻磁場量測系統,建立於 2003 年,並在 2009 年重新進行校正和系統改進;第二座極低頻(ELF)至甚低頻電磁場量 測系統,則於 2009 設立,提供了我們較高頻率的電磁場訊號,以解析不同性質的放 電現象。 超低頻磁場紀錄系統於 2009 年進行改進前,有安裝一訊號調節器,將紀錄的頻 段限制於較低頻(<100 赫茲)的部分,雖然可偵測的距離因此增加,調節器本身卻有 不連續的相位變化。由訊號產生器實際驗證後,發現有約 9 毫秒的時間誤差,這對 於以毫秒為發光時間單位的高空短暫發光現象是有相當地影響。因此,我們以一基 礎的訊號重建法進行修正,發現不論是訊號產生器的輸出波形或 ISUAL 觀測的紅色. III.
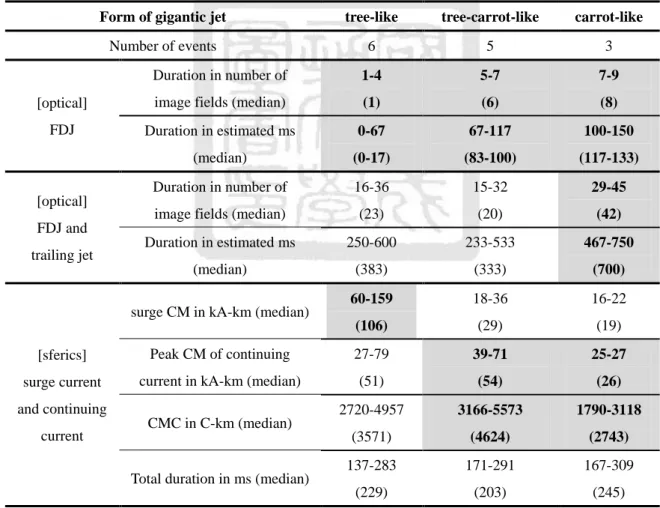
(4) 精靈磁場訊號,都能將這時間偏差予以修正。此外,修正後的紅色精靈訊號,有著 較短的放電時間和較強的振幅,當由訊號反演的電荷矩和影像亮度進行線性比較時, 也有著更接近真實的截止電荷矩和較高的相關係數。 2010 年 8 月時,我們的地面光學觀測系統在 6 小時內紀錄到超過 100 個高空短 暫發光現象,其中,14 個事件被確認為巨大噴流,且有著清楚的光學影像和超低頻 與極低頻至甚低頻的電磁場訊號紀錄。這是第一次有機會對巨大噴流進行詳細的訊 號分析,在與光學畫面比對後,我們發現每個光學階段都有對應的放電訊號,包含: 起始閃電、前導噴流、完整噴流和後續噴流,且除了光學型態外,也可以從發光時 間,完整噴流與後續噴流的電流強度來判斷巨大噴流的型態。此外,除了 Su et al. [2003]中辨識的樹型(tree-like)和蘿蔔型(carrot-like)巨大噴流,在這次觀測裡,不論光 學型態、發光時間或電磁場訊號,都顯示了一種新型的混合型(tree-carrot-like)巨大 噴流。 最後,我們比對了 2009 年 6 月至 2012 年 6 月,這三年間的所有 ISUAL 高空短 暫發光現象的電磁場訊號,藉此來探討各種事件的基本電磁場特性。從對應的訊號 中,發現紅色精靈電流(sprite current)的比例在所有紅色精靈中達到 19%,約是過 去研究的 2 倍[Cummer et al. 2003],推測可能當閃電強度越強時,紅色精靈電流出 現的比例也越高,因此,ISUAL 較高的觸發條件,導致了較高比例的紅色精靈電流。 另外,我們發現在距離測站 6 千公里的範圍內,約有 38%的藍色噴流有相關的甚低 頻電磁場輻射,並類似於 narrow bipolar events。在探討各類型高空短暫發光現象的 訊號特性上,我們以三種方法定量、定性地討論了它們的差異。首先是可偵測率, 基本上,大部分類型的事件,可偵測範圍差異不大(90%的可偵測範圍約達 4 到 6 千 公里),只有精靈暈盤的相關事件,有著明顯較遠的偵測距離(90%的可偵測範圍達 1 萬公里)。在分析了它們的波形後,發現是因較強的訊號振幅,導致較遠的可偵測範 圍。第二點的極性分析上,負閃電比例由 0%的紅色精靈上升至 96%的淘氣精靈。. IV.
(5) 淘氣精靈居然由如此高比例的負閃電造成,這在過去的文獻中,是不曾出現過的。 更特別的是,事件發生於陸地和海洋與海陸交界的比例,也會隨著不同類型的高空 短暫發光現象而變化。最後,我們以每 1 千公里為單位,取出區間內的各種事件, 分別計算其訊號的平均波形,以此探討在相同區間下,不同類型的高空短暫發光現 象在放電特性上的不同。結果出乎意料,幾乎所有類型的事件,都擁有類似的訊號 波形,只有紅色精靈的放電訊號,有著較長的上升和下降時間,並反應在 200 赫茲 以下的頻譜分布。. 關鍵字:高空短暫發光現象、閃電、超低頻磁場訊號、極低頻至甚低頻電磁場訊號。. V.
(6) Abstract In the past decade, transient luminous events (TLEs) have been the main research focus of the TLE group at the Physics Department, NCKU. Since 2001, we have routinely carried out ground TLE campaigns in Taiwan and have performed a global survey of TLEs using the ISUAL payload onboard the FORMOSAT-2 satellite since 2004. Till now, most of TLE research efforts have mainly concentrated on analyzing the large number of the ground and the ISUAL recorded TLEs using the optical and the spectral data. The occurrence of TLEs, including sprite, elve, halo, blue jet and gigantic jet, is known to be closely linked to the electric discharges in thunderclouds. However, the optical and spectral analyses provide little insight into the characteristics of the electric discharge processes that induce the TLEs. Because the lightning discharges are known to radiate the bulk of electromagnetic energy between the ultra low frequency (ULF) and the very low frequency (VLF) bands, the sferics emitted by lightning in these wavelengths can propagate in the Earth-ionosphere waveguide over a long distance with low attenuation. Therefore, in order to facilitate a better understanding of the electric discharges behind the TLE phenomena and to expand our observational capability, an ULF and an ELF/VLF radio recording systems have been installed in low electromagnetic noise sites, which locate at the Lulin Observatory and the Cingcao Elementary School in Tainan City, respectively.. In 2009, we re-built and re-calibrated the previous existing Lulin ULF station and expand the detection frequency range of the system to better monitor the sferics from the lightning return strokes and the continuing current. Shortly, a second Cingcao ELF/VLF recording system was added in late 2009 to obtain a higher time resolution sferic data for. VI.
(7) resolving the electric processes in TLE-associated discharges. With both systems, we have the capability to monitor the sferics emitted by the electric discharges that produced the observed TLEs and to infer their electromagnetic signatures. The Lulin ULF sferics recorded before 2009 suffered from phase distortions that imparted by a hardware signal modulator, which was used to filter out the usually intense 60 Hz power grid noise. In our in laboratory testing, it was found that the signal modulator incurred ~9 milliseconds of time delay on the sferics. In order to render the hardware notch-filtered sferic data being useful again, a simple signal reconstruction method was used to re-process the notch-filtered sferics. After the reconstruction, the sferics were found to contain less ringing, regain some of their lost amplitude, and more importantly have the correct event time. The fairness and reliability of the signal reconstruction method were checked using a few laboratory-generated waveforms and the results indicate that method is quite robust. With the reconstructed sprite-associated sferics, we also found a tight linear correlation between the charge moment change of the sprite-inducing CGs and the brightness of sprites. Furthermore, the threshold of the CG discharges needed to initiate sprites is also inferred and the result is generally in agreement with the accepted value.. With the renovated Lulin ULF and the newly installed Cingcao ELF/VLF sferic recording systems operate concurrently with the ground TLE observation campaigns and the ISUAL experiment onboard the FOMOSAT-2 satellite, valuable TLE-associated data are collected. The first notable opportunity was the observation of typhoon Lionrock on 31August 2010. About one hundred TLEs were observed to occur over this typhoon, among them fourteen negative gigantic jets were found to have clearly analyzable optical, ULF, and ELF/VLF data. For each GJ sferic, the signals associate with the observed optical processes, including the initiating lightning, the leading jet, the fully-developed jet. VII.
(8) (the surge current), and the trailing jet (the continuing current) were found. Furthermore, quantitative parameters of the initiating lightning, the surge current and the continuing current were inferred. These physical parameters are found to be closely linked to the morphologies, including the “tree-like”, the “carrot-like” and a newly found hybrid form called the “tree-carrot-like, of the negative gigantic jets.. Finally, to obtain the electromagnetic signatures of the TLE-associated discharges, the sferics associate with various groups of TLEs are analyzed in detail. In the global survey of TLEs, ISUAL has recorded more than ten thousand events since late 2009. From analyzing the sferics and the ISUAL spectrophotometer/array photometer data associate with pure sprites, the percentage of sprites with a sprite current is found to twice of the previous reported value [Cummer et al. 2003]. We also discovered the sferics associate with blue jets for the first time. The impulsive characteristics of the blue jet-associated sferics indicate that they may be closely linked to the narrow bipolar events (NBEs). In depth analyses, the detectability, the polarity distribution, and the characteristics of waveforms are all studied. The sferic detectability range for each group of TLEs is quite similar; the 90% sferic detectable range is 4-6 Mm typically. Among the TLE groups, only the sferics associate with halo have the farthest detectable range, since they tend to have larger amplitude. The results for the TLE polarity distribution are quite surprising. The elves are dominated by negative discharges (96%). In the well-organized Table 5-3, the negative event ratio increases monotonically across the TLE groups from 0% for the sprites to 96% for the elves. Furthermore, the polarity distribution of the causative discharges was also found to be related to their occurrence ratios over the land, the oceanic and the coastal areas. Finally, the average sferic waveforms for various TLE groups in the same 1 Mm bin are computed. The rise and decay time as well as the. VIII.
(9) spectra of the average sferics are analyzed. Except for pure sprites, other group of TLEs have a similar average waveform. Only the averaged sferics associate with sprite have the longer signal duration and the energy concentrates mainly below 200 Hz.. Keywords: Transient Luminous Events, Lightning, ULF magnetic field, ELF/VLF electromagnetic field.. IX.
(10) 誌謝 首先,要非常感謝許瑞榮老師、蘇漢宗老師和陳炳志老師,以及他們帶領的成 功大學紅色精靈研究團隊,當我在成功大學物理系一年級時,只是因為愛搞電腦, 加入了團隊的數據中心,跟著中心的工程師們(黃天祥、王璽鈞、江致宇和蘇進財) 以及大學部的同學(黃偉軒、吳宜軒和張淑鈞) 、學長們(賴偉辰和黃胤傑)學習, 培養了堅強的程式能力,而足以應付碩、博士班時大量的資料紀錄與分析。 進入研究所後,要非常感謝許瑞榮老師,他孜孜不倦的教誨、嚴以律己的研究 態度與不放過任何細節的標準,更是讓我敬佩,也使我對自己的成果,一定要再三 檢視,思考各種細節,探索可能的機制。接下來要感謝蘇漢宗老師,他不厭其煩地 修改我的文章和英文語句,特別是我的跳躍性(不連續)思考和敘述,常讓老師頭 大,也多虧了蘇老師的不斷提醒,才讓我能寫出完整的文章。最後要感謝陳炳志老 師,對於物理系畢業的我,儀器完全是門外漢,但老師帶領我度過最困難的入門階 段,甚至讓我到美國學習進階的技術,如果不是這些經驗,我沒有自信在五年裡完 成這麼多工作。 還要感謝團隊裡來來去去的多位助理(吳慧玲、江致宇、黃胤傑、陳昭敏、李 宜臻、林雅紅、劉家彰) ,如果沒有你們,我沒辦法專心工作,特別是楊國良和陳彥 彰,在儀器和電腦上的幫助,實在太大了,沒有你們,我的研究會困難許多。也感 謝團隊中的學長姊(郭政靈老師和周榮光學姊) 、同學(李立柔和張淑鈞)和學弟妹 們(吳彥蓉和彭康銘) ,和你們這幾年來一起工作、討論和觀測的各種回憶仍歷歷在 目,希望你們將來都能找到適合自己的道路,繼續發揮所長。最後,要謝謝我的家 人,如果不是父母與妹妹無條件的支持,我不可能走到現在,希望他們能繼續健健 康康的享受生活,並原諒我無法常常陪伴他們。. X.
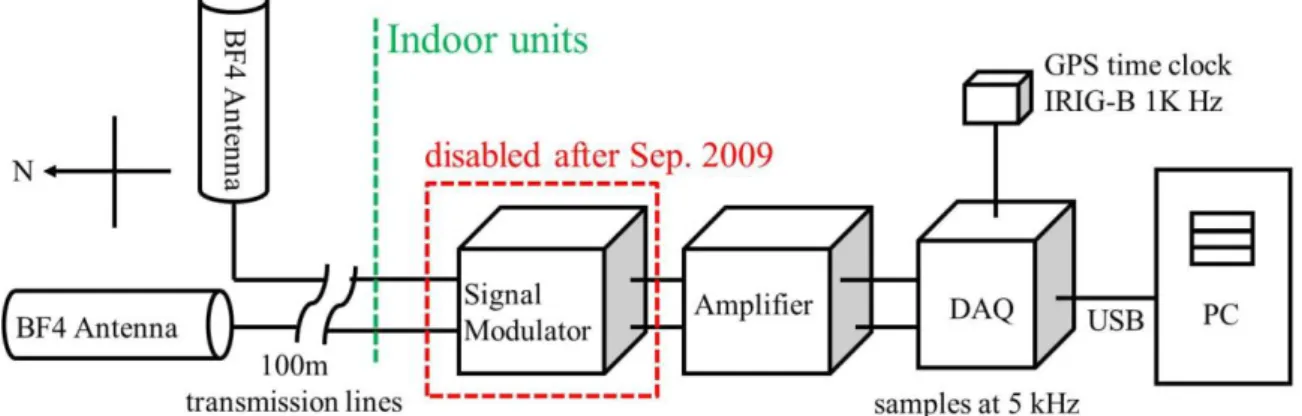
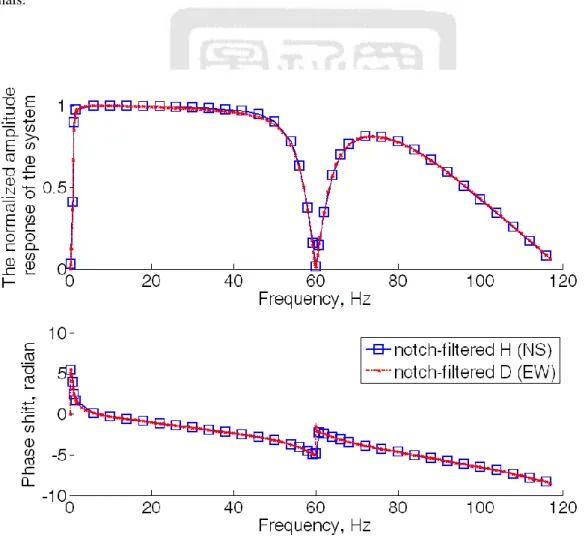
(11) Tables of Contents Chapter 1 1.1. Introduction ..................................................................................................... 1 Transient Luminous Events, TLEs .................................................................... 1 1.1.1 Overview ................................................................................................ 1 1.1.2 Sprites ..................................................................................................... 2 1.1.3 Halos ....................................................................................................... 5 1.1.4 Elves ....................................................................................................... 7 1.1.5 Blue Jets .................................................................................................. 8 1.1.6 Gigantic Jets ..........................................................................................11 1.2 Radio Atmospheric Signals, Sferics ................................................................ 14 1.2.1 Overview .............................................................................................. 14 1.2.2 Lightning and Sferics............................................................................ 14 1.2.3 Sferics Associate with Sprites............................................................... 18. 1.2.4 Sferics Associate with Halos ................................................................ 21 1.2.5 Sferics Associate with Elves ................................................................. 21 1.2.6 Sferics Associate with Blue Jets and Gigantic Jets............................... 22 1.3 Motivations and Contributions ........................................................................ 24 Chapter 2 Instruments .................................................................................................... 26 2.1 Optical TLE Ground Campaigns..................................................................... 26 2.1.1 Overview .............................................................................................. 26 2.1.2 Portable Platforms ................................................................................ 28 2.1.3 Remote-Controllable Platform ............................................................. 29 2.2 ISUAL Payload onboard the FORMOSAT-2 Satellite .................................... 30 2.2.1 Overview .............................................................................................. 30 2.2.2 The ISUAL Imager ............................................................................... 31 2.2.3 The ISUAL Spectrophotometer (SP) .................................................... 32 2.2.4 The ISUAL Array Photometers (AP).................................................... 33 2.3 ULF Magnetic Field Recording System.......................................................... 33 2.3.1 Overview .............................................................................................. 33 2.3.2 2.3.3. Re-build the ULF Magnetic Field Recording System .......................... 34 The Magnetic Coil Calibration ............................................................. 38. XI.
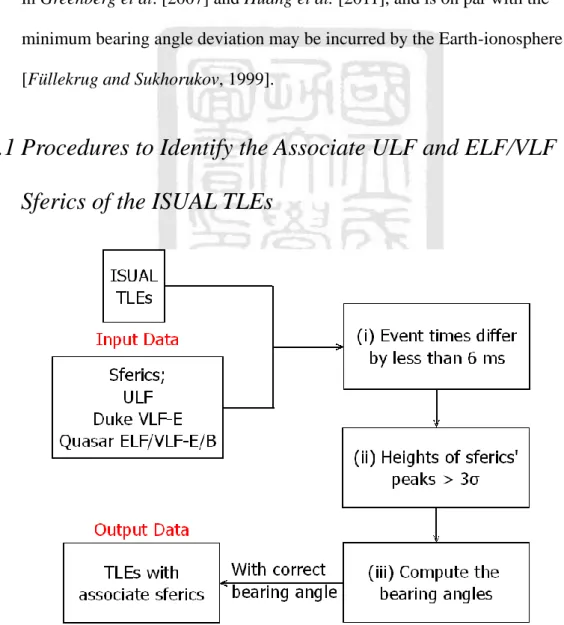
(12) 2.4 Chapter 3 3.1 3.2. ELF/VLF Magnetic and Electric Field Recording System ............................. 40 Effects of Notch-Filtering in the Lulin ULF Recording System ................... 44 Overview ......................................................................................................... 44 The Reconstruction of the ULF Sferics........................................................... 45. 3.2.1 An Elementary Signal Reconstruction Method .................................... 45 3.2.2 Limitations of the Signal Reconstruction ............................................. 46 3.3 The Physical Characteristics of the Sprite-Inducing Discharges .................... 49 3.3.1 Associate ULF Sferics of the ISUAL Sprites ....................................... 49 3.3.2. Formulae for Extraction Current Moment Amplitude ( ), Time Constant (τ), and CMC ......................................................................... 50. Current Moment Amplitude ( ), Time Constant (τ), and CMC Inferred From the Reconstructed Sferics .............................................. 51 Time‐Integrated Total Photons of the Coincident ISUAL Sprites ................... 55. 3.3.3 3.4 3.5 Chapter 4 4.1 4.2 4.3. Conclusion ....................................................................................................... 57 Optical and Radio Signatures of Negative Gigantic Jets ............................... 59 Overview: Negative Gigantic Jets From Typhoon Lionrock (2010) ............... 59 Occurrence of GJs in Typhoon Lionrock (2010)............................................. 61 The Optical Features of the Negative Gigantic Jets ........................................ 65 4.3.1 The Initiating Lightning of Gigantic Jets ............................................. 65 4.3.2 The Morphology and the Luminous Duration of Gigantic Jets ............ 67. 4.4. The ULF and ELF/VLF Features of the Negative Gigantic Jets..................... 71 4.4.1 Radio Signals Associate with the Initiating Lightning (the Gigantic Jet Initiation) .............................................................................................. 72 4.4.2 Radio Signals Associate with the Leading Jet ...................................... 73 4.4.3 Radio Signals Associate with the Fully-developed Jet (the GJ-Ionosphere Connection, the Surge Current).................................... 74 4.4.4 Radio Signals Associate with the Trailing jet (the Continuing Current)75 4.5 Discussion: GJ Morphology and the Underlying Discharge Parameters ........ 76 4.6 Conclusion ....................................................................................................... 78 Chapter 5 Coordinated TLE Campaign using the ISUAL, the NCKU ULF and the ELF/VLF Stations ............................................................................................................... 80 5.1 Overview ......................................................................................................... 80 5.2 Criteria to Look for Associate ULF and ELF/VLF Sferics of ISUAL TLEs .. 81 5.2.1 Procedures to Identify the Associate ULF and ELF/VLF Sferics of the ISUAL TLEs ......................................................................................... 82 5.3. Waveforms of the TLE-associated Sferics ...................................................... 88 5.3.1 Waveforms of the Elve-associated Sferics ........................................... 88. XII.
(13) 5.3.2 Waveforms of Sferics that Associate with Sprites and Sprite Currents 89 5.3.3 Waveforms of the Halo-associated Sferics ........................................... 92 5.3.4 Waveforms of the Blue Jet-associated Sferics ...................................... 92 5.4 Detectability and Validation of the NCKU ULF/ELF/VLF Recording Systems........................................................................................................................ 94 5.5 Polarity Distribution of the TLE-associated Discharges ................................. 97 5.6 Signatures of Sferic Waveforms from the TLE-associated Discharges ........ 105 5.6.1. The Average ULF Sferic Waveforms of the TLE-associated Discharges........................................................................................... 106 5.6.2. The Rise and Decay Time of the Sferics ............................................. 111 5.6.3. The Frequency Spectra of Sferics ........................................................114 5.7 Conclusion ......................................................................................................117 Chapter 6 Summary and Future Work .......................................................................... 120 6.1 Summary ....................................................................................................... 120 6.2 Future Work ................................................................................................... 128 6.2.1 The Short Interval TLEs ..................................................................... 128 6.2.2 Terrestrial Gamma-ray Flashes ........................................................... 131 6.2.3 Extension of Our Sferic Recording Frequency Range to Low Frequency ........................................................................................... 132 Appendix A Time Drift of the ISUAL Clock ............................................................... 133 References ......................................................................................................................... 138. XIII.
(14) List of Figures Figure 1-1. Representative images of sprites ........................................................................ 4 Figure 1-2. Representative images of pure halos .................................................................. 6 Figure 1-3. Representative images of elves .......................................................................... 8 Figure 1-4. Representative images of blue jets ................................................................... 10 Figure 1-5. Representative images of GJs ........................................................................... 13 Figure 1-6. Lightning sferics recorded by the NCKU stations ........................................... 18 Figure 1-7. A representative sferics associate with sprite ................................................... 20 Figure 2-1. Map for the vicinity of Taiwan ......................................................................... 27 Figure 2-2. FOVs of the ISUAL Imager, SP and AP........................................................... 31 Figure 2-3. Photographs of the Lulin ULF magnetic field recording system ..................... 36 Figure 2-4. Block diagram of the Lulin ULF recording system.......................................... 36 Figure 2-5. Block diagram of the Lulin notch-filtering signal modulator .......................... 37 Figure 2-6. The frequency responses of the signal modulator ............................................ 37 Figure 2-7. Sferic associates with an ISUAL sprite ............................................................ 38 Figure 2-8. Photographs taken during the EMI-BF4 coil calibration processes ................. 39 Figure 2-9. Calibrating curves for the two repaired EMI-BF4 antennas ............................ 40 Figure 2-10. Photographs taken during the construction of Cingcao ELF/VLF station ..... 42 Figure 2-11. Photographs of the Cingcao ELF/VLF recording system .............................. 42 Figure 2-12. Block diagram of the Cingcao ELF/VLF recording system ........................... 43 Figure 3-1. Reference waveforms used to clarify the limitations of the signal reconstruction ................................................................................................. 48 Figure 3-2. Comparison of the notch-filtered sferics and the model sferics ....................... 54 Figure 3-3. Correlation between the charge moment charge (CMC) of the causative discharges and the brightness of sprites ......................................................... 56 Figure 4-1. MTSAT-2 infrared map .................................................................................... 62 Figure 4-2. Selected R-camera image fields, ULF sferics, and the ELF/VLF spectrogram of the tree-like GJ ........................................................................................... 66 Figure 4-3. Selected R-camera image fields, ULF sferics, and the ELF/VLF spectrogram of the carrot-like GJ ....................................................................................... 67 Figure 4-4. Selected R-camera image fields, ULF sferics, and the ELF/VLF spectrogram. XIV.
(15) of the hybrid tree-carrot-like GJ..................................................................... 69 Figure 4-5. The peak current moment versus the charge moment change diagram for the initiating lightning of the fourteen negative GJs ............................................ 72 Figure 5-1. The block diagram for the procedures to identify the associate sferics of ISUAL TLEs. ................................................................................................. 82 Figure 5-2. An ISUAL elve with a trigger time of 30 May 2010 18:19:32.721.................. 84 Figure 5-3. Histograms of the bearing angle deviations relative to the ISUAL TLEs in the Lulin ULF sferics and the Quasar ELF/VLF sferics ...................................... 86 Figure 5-4. The distribution of the bearing angle deviations versus the distances and the distribution of the bearing angle deviations versus the sferics’ SNR............. 87 Figure 5-5. Representative sferics of the elve-inducing negative and positive lightning ... 89 Figure 5-6. Representative sferics of sprite-inducing positive lightning ............................ 90 Figure 5-7. Representative sferics of halo-inducing negative lightning ............................. 92 Figure 5-8. Representative sferics which were associated with blue jets ........................... 93 Figure 5-9. Detectability of the elve-associated sferics ...................................................... 96 Figure 5-10. Geographic distribution of the polarity of the TLE-associated discharges .. 100 Figure 5-11. Geographic distribution of the discharging polarity of sprite-inducing lightning ....................................................................................................... 103 Figure 5-12. Geographic distribution of the discharging polarity of elve-inducing lightning ....................................................................................................... 103 Figure 5-13. ULF sferic waveforms of the elve-inducing discharges (Method 1) ............ 106 Figure 5-14. ULF sferic waveforms of the elve-inducing discharges (Method 2) ............ 108 Figure 5-15. The average waveforms computed using Method 1 and Method 2 .............. 108 Figure 5-16. Seven ISUAL sprite-associated sferics from the 3-4 Mm bin ...................... 109 Figure 5-17. The average ULF sferic waveforms for all the TLE groups in the 0-1 Mm bin..................................................................................................................110 Figure 5-18. The average ULF sferic waveforms for all the TLE groups in the 1-2 Mm bin..................................................................................................................110 Figure 5-19. The rise and decay time of all kinds of TLEs in negative and positive polarity ..........................................................................................................112 Figure 5-20. The normalized frequency spectra in percentage of all kinds of TLEs in negative and positive polarities from 0 to 1 Mm ..........................................115 Figure 5-21. The same results as in Figure 5-20, but they are not normalized in magnitude and shown in raw results ...............................................................................116 Figure 6-1. A stitched image contains 83 image strips from a tree-like negative gigantic jet occurred on August 31, 2010 ..................................................................... 129 Figure 6-2. The ULF sferics associate with the GJ and TLEs in Figure 6-1..................... 129. XV.
(16) Figure 6-3. The histogram of the short interval TLEs ....................................................... 130 Figure 6-4. Representative sferics associate with the TGFs from 2010 to 2012............... 131 Figure 6-5. Snapshots of the LF antennas. ........................................................................ 132 Figure A-1. Times of an event according to the ISUAL and Lulin ULF station ............... 134 Figure A-2. The drift of the ISUAL event time relative to the associate ULF/ELF/VLF sferics in milliseconds and the histograms of the time offsets after correcting for the ISUAL time drift ................................................................................. 135. XVI.
(17) List of Tables Table 1-1. Salient characteristics of sprites ........................................................................... 4 Table 1-2. Salient characteristics of halos ............................................................................. 7 Table 1-3. Salient characteristics of elve ............................................................................... 9 Table 1-4. Salient characteristics of blue jets .......................................................................11 Table 1-5. Salient characteristics of gigantic jets ................................................................ 13 Table 3-1. The current moment amplitude, the time constant, and the charge moment change of the 6 coincident pure sprites and the 12 coincident sprites with halos and/or elves ......................................................................................................... 53 Table 4-1. The duration of the FDJ, the combined duration of FDJ and trailing jet, the current moment, and the charge moment change of the surge current and the continuing current for the three forms of negative gigantic jets ......................... 70 Table 5-1. Observability of the sprite current and the time delay relative to the sprite-inducing lightning ..................................................................................... 91 Table 5-2. The event distances at the 90% and 50% sferic detectability ............................ 95 Table 5-3. The fraction of negative polarity discharges and event number ...................... 100 Table 5-4. The fraction of negative polarity discharges and event number within 90% ULF sferic detectability .................................................................................... 102 Table 5-5. The rise and decay time of sferis associate with different groups of TLEs occurring within 5 Mm ......................................................................................113 Table 6-1. The electromagnetic signatures of basic groups of TLEs. ............................... 125. XVII.
(18) Abbreviation AD. Anno Domini. AP. Array Photometer. BFB. Bolt-from-the-Blue. CAPE. Convective available potential energy. CCD. Charge-coupled Device. CG. Cloud-to-ground. CI. Cloud-to-ionosphere. CIN. Convective inhibition. CM. Current moment. CMC. Charge moment change. ELF. Extremely Low Frequency. ELVES. Emissions of Light and VLF perturbation due to EMP Sources. EMP. Electromagnetic Pulse. FDJ. Fully-developed jet. FFT. Fast Fourier transform. FOV. Field of View. FWHM. Full Width at Half Maximum. FPS. Frames per Second. GJ. Gigantic jet. IC. Inter-cloud lightning. XVIII.
(19) IC. Intra-cloud lightning. ISUAL. Imager of Sprites and Upper Atmospheric Lightning. kR. Kilo- Rayleigh. LF. Low frequency. MR. Mega-Rayleigh. NBEs. Narrow Bipolar Events. NCKU. National Cheng Kung University. NLDN. National Lightning Detection Network. NSPO. National Space Program Office. NTSC. National Television System Committee. QE. Quasi‐Electrostatic. SNR. Signal-to-Noise ratio. SP. Spectrophotometer. TGF. Terrestrial Gamma-ray Flash. TLEs. Transient Luminous Events. TOA. Time of Arrival. ULF. Ultra Low Frequency. UTC. Coordinated Universal Time. VHF. Very High Frequency. VLF. Very Low Frequency. WWLLN. Worldwide Lightning Location Network. XIX.
(20) Units C. Coulomb. dBz. decibels relative to Z. K. Kelvin. kHz. Kilohertz. km. Kilometer. m. meter. Mm. Million meters, equals to thousand kilometers. mm. Millimeter. nm. Nanometer. s. Second. XX.
(21) Chapter 1 Introduction 1.1 Transient Luminous Events, TLEs 1.1.1 Overview C. T. R. Wilson [1925] pointed out that a thundercloud is a great electric generator in which the potential difference between its poles may reach values of the order of a million kilovolts. He also predicted that a thundercloud may cause ionization at great heights and may produce discharges between the cloud and the upper atmosphere. The first observation of these predicted discharges may date back to the lightning figures of the Australian aboriginal figurative paintings in the Kimberley and the Northern Territory around 1000 AD [Ploum, 2012; Maxime, 2012]. In 1885, the meteorological phenomena described by MacKenzie and Toynbee [1886] were probably the first formal documentation which can be identified as transient luminous events (TLEs) [Lyons, 2006, and references therein; Lyons et al., 2000]. Although there were many eyewitnesses, even by Wilson [1956] himself, the first image (video) of TLEs was not recorded until 1989. Franz et al. [1990] captured an image of unusual luminous electrical discharge over a thunderstorm, which was at 250 kilometers away, using a low-light-level television camera. Soon after, researchers realized it is the “sprite” [Sentman et al., 1995], a type of. 1.
(22) TLEs. During the ensuing observations, several kinds of TLEs were observed and classified as blue jet/starter [Wescott et al., 1995], elve [Fukunishi et al., 1996], halo [Barrington-Leigh, 2000; Barrington-Leigh et al., 2001], and gigantic jet [Pasko et al., 2002; Su et al., 2003]. The National Cheng Kung University (NCKU) group has performed routine ground campaigns in Taiwan, Asia since 2001 [Su et al., 2002; Hsu et al., 2003; Su et al., 2003], and has operated the first long-term space-borne payload (Imager of Sprites and Upper Atmospheric Lightning; ISUAL) onboard the FORMOSAT-2 satellite since 2004 [Chern et al., 2003; Chen et al., 2008]. After more than twenty years of worldwide investigations, a great many TLEs has been captured and some of the samples will be shown in the following sections.. 1.1.2 Sprites Sprites (see Figure 1-1) are the first documented type of TLEs [Franz et al., 1990] that occur above active thunderstorms [Sentman et al., 1995; Chen et al., 2008; Pasko, 2010, and references therein]; their salient physical parameters are summarized in Table 1-1. Sentman et al. [1995] recorded the first color imagery and triangulated the physical dimensions of sprites in the Sprite94 dual-aircraft campaign. The red main body spans the altitude range of 50-90 km, and the lateral dimension ranges from 5 to 30 km. Faint bluish tendrils often extended downward from the main body of sprites, occasionally appeared to reach the cloud tops near 20 km; Figure 1-1 (a)-(c) and (f). Takahashi et al. [1995] and Adachi et al. [2005] further reported that sprites generally began at ~70-75 km and then propagated upward and downward simultaneously. In the ISUAL space campaign, Chen et al. [2008] used a database that contains 633 sprites from July 2004 to June 2007 to infer the sprite global detection rate to be ~0.5 events per minute, while Kuo. 2.
(23) et al. [2008] used 155 sprites with clean or subtractable lighting emissions to estimate the sprite brightness is around 1.5 MR (maximum 27.4 MR). In addition to the classical sprites, Wescott et al. [1998] observed another distinctive form of sprites. Through the three dimensional triangulation, this form of sprites were characterized by vertical columns of about 10 km in length (the lower and upper altitudes were 76.2 and 86.7 km, respectively) and less than 1 km in diameter; thus they are named as the “columniform sprites or C-sprites”. As shown in Figure 1-1 (a)-(c) and (f), the classical carrot sprites are very different from the columniform sprites (Figure 1-1 (d) and (e)) morphologically. Fukunishi et al. [2002] used high-speed array photometers and image-intensified CCD cameras to clarify the possible causes behind this kind of morphological difference. They found that columniform sprites were always accompanied by preceding elves and initiated and developed downward from ~ 80-90 km. Finally, the time delay between the causative lightning and the sprite was very short (~1 millisecond) for columniform sprites, but relatively long (2-150 milliseconds) for carrot sprites.. 3.
(24) (a). (b). (c). (d). (e). (f). Figure 1-1. Representative images of sprites obtained by the NCKU group during the ground campaigns in Taiwan, (a)-(e), and by ISUAL from the space, (f). (a)-(c): carrot sprites captured on 27 June 2003, 25 July 2003, and 13 May 2004 respectively; (d) and (e): columniform sprites recoded on 7 July 2006 and 25 July 2003; (f): carrot sprite occurred over the central Pacific Ocean on 10 June 2006. Table 1-1. Salient characteristics of sprites. The red main body spans 50-90 km altitudes and the faint bluish tendrils may Occurring altitude. extend downward to 20 km [Sentman et al., 1995]. Initiation altitude. ~70-75 km [Takahashi et al., 1995; Adachi et al., 2005]. Lateral dimension. 5-30 km [Sentman et al., 1995] Several to tens of milliseconds [Sentman et al., 1995; Barrington-Leigh et al.,. Luminous duration Brightness. 2001; Miyasato et al., 2002; Kuo et al., 2005; Cummer et al., 2006a] ~ tens of kR to MR [Sentman et al., 1995; Kuo et al., 2008] Most are positive CGs (>99%) [Boccippio et al., 1995; Williams, 2006;. Polarity of causative CG. Williams et al., 2007]. Generating mechanism. Quasi-electrostatic (QE) field [Pasko et al., 1997]. CMC of causative CG. >350-1000 C-km [Hu et al., 2002]. Global detection rate. ~0.5 events per minute [Chen et al., 2008]. Sprites with. ~10% [Cummer et al., 1998; Cummer et al., 2006b]. sprite current. 4.
(25) 1.1.3 Halos Before the 21st century, halos were often believed to be a part of sprites. As shown in Figure 1-2 (d) and (e), a dim and diffuse glow with the upward-caving shape can sometimes be clearly observed on the top of sprite owing to heating from the quasi‐ electrostatic (QE) field [Pasko et al., 1997; Barrington-Leigh et al., 2001]; it usually was recognized as the “hair” of sprites. However, because of its distinct characteristics [Barrington-Leigh et al., 2001], this type of glow has since been viewed as an independent type of TLEs and carries the name “halo” or “sprite halo”. Their key characteristics are summarized in Table 1-2. In the high-speed observations [Barrington-Leigh et al., 2001; Moudry et al., 2003; Frey et al., 2007], halo was a descending transient glow with a lateral extent of the order of 40-70 km. Wescott et al. [2001] performed a three-dimensional triangulation observation to detail the spatial structures and the temporal development of halos. The average values of the halo diameter, thickness, and the altitude of the brightest zone were ~66 km, ~4 km, and ~78 km, respectively. Using National Lightning Detection Network (NLDN; a nation-wide lightning detection network in the USA), they found that halos located directly above the underlying parent lightning (~4.6 km). In a similar observation [Miyasato et al., 2002], 35 complex halos were recorded including 26% of pure halos, 3% of halos with preceding elves, 34% of halos with preceding elves and follow-up sprites, and 37% of halos with follow-up sprites. They deduced the average values of the halo diameter, altitude, time delay relative to the cloud-to-ground lightning (CGs), duration, and the peak current intensity of parent CGs respectively are 85.5 km (50-110 km), 80.4 km (87.2 km descended to 73.0 km in altitude), 0.85 ms (0.45-1.5 ms), 1.0 ms (0.6-2.2 ms), and 98.6 kA (50-180 kA). In the ISUAL space survey, Chen et al. [2008] deduced the global. 5.
(26) detection rate of halos to be ~0.39 events per minute, while Kuo et al. [2008] inferred the halo brightness to be ~0.3 MR (maximum 0.75 MR).. (a). (b). (c) Dim halo. (d). (e) Halo Dim halo. Figure 1-2. Representative images of pure halos (a) & (b) and sprite-with-halo events (d) & (e) obtained by the NCKU group during the ground campaigns in Taiwan, and (c) an ISUAL recorded pure halo. (a) & (b) were recorded on 2 August 2010; (c) a dim halo observed over the northeast Australia on 15 November 2006; (d) observed on 27 June 2003; (e) recorded on 25 July 2003.. 6.
(27) Table 1-2. Salient characteristics of halos. ~70-85 km [Barrington-Leigh et al., 2001; Wescott et al., 2001; Miyasato et Occurring altitude Height (brightest glow). al., 2002] with a ~4 km thickness [Wescott et al., 2001] ~78 km [Wescott et al., 2001] 40-110 km [Barrington-Leigh et al., 2001; Wescott et al., 2001; Miyasato et. Lateral dimension Luminous duration Delay relative to the. al., 2002; Moudry et al., 2003; Frey et al., 2007]. Several to tens of milliseconds [Miyasato et al., 2002; Frey et al., 2007] 0.48-1.5 ms [Miyasato et al., 2002]. causative CG Brightness. ~ tens to several hundreds of kR [Kuo et al., 2008] Quasi-electrostatic (QE) field [Pasko et al., 1997; Barrington-Leigh et al.,. Generating mechanism. 2001] Most are negative CGs with a fractional of 50% to 80% [Barrington-Leigh et. Polarity of causative CG. al., 2001; Bering et al., 2002, Bering et al., 2004a; 2004b; Bhusal et al., 2004; Newsome and Inan 2010]. Global detection rate. 0.39 events per minute [Chen et al., 2008]. 1.1.4 Elves Emissions of Light and VLF perturbation due to EMP Sources (ELVES; in the current literature, elve and elves respectively are the singular and the plural forms) was first recognized by Boeck et al. [1992] in the space shuttle video data, and was initially termed as optical “air-glow” enhancements. Fukunishi et al. [1996] reported the first ground observation during the SPRITE’95 campaign and named this type of TLE emissions “ELVES”. The generating mechanism of elve is the heating of the lower ionospheric boundary by the electromagnetic pulse launched by lightning discharge [Inan et al., 1991; Inan et al., 1996a; Inan et al., 1997]. The key characteristics of elve are summarized in Table 1-3. As shown in Figure 1-3, an elve often shows up as a ring-shaped diffuse glow near the bottom of the ionosphere (airglow altitude; around 75-95 km). A significant difference between halo and elve is that most halos are more. 7.
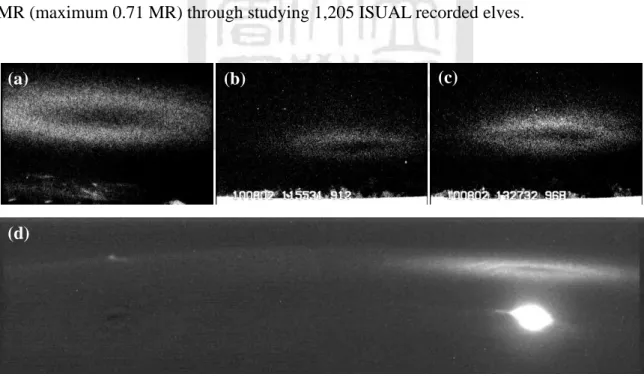
(28) easily identifiable in a 17 milliseconds video field, while elves generally are not [Barrington-Leigh et al., 2001; Chen et al., 2008; Newsome and Inan, 2010]. Barrington-Leigh et al., [2001] further reported that elves are only 8% as bright as halo when integrated over 2 milliseconds. Typically, the luminous duration of elves is less than several milliseconds with a thickness of a few kilometers and a lateral extent of ~200-600 kilometers [Boeck et al., 1992; Fukunishi et al., 1996; Inan et al., 1997; Barrington-Leigh and Inan, 1999; Dial and Taylor, 1999; Moudry et al., 2003; Israelevich et al., 2004; Mende et al., 2005]. Due to the fleeting and dim nature of elves, they are hard to observe using the normal video recorders often deployed in the ground campaigns. However, the situation for space surveys is quite different, Chen et al. [2008] found elves to be the dominant type of TLEs (>81%) with the global detection rate of ~3.23 events per minute after analyzing 5,434 elves. Kuo et al. [2008] inferred the brightness of elves is ~0.17 MR (maximum 0.71 MR) through studying 1,205 ISUAL recorded elves.. (a). (c). (b). (d). Figure 1-3. Representative images of elves: (a)-(c) elves observed in the Taiwan TLE ground campaigns and (d) an event observed from space by ISUAL. (a) elve observed on 22 July 2002; (b) & (c) elves observed on 2 August 2010; (d) elve occurred over the central Pacific Ocean on 6 September 2005.. 8.
(29) Table 1-3. Salient characteristics of elve. 75-95 km (airglow altitude; lower. [Boeck et al., 1992; Fukunishi et al.,. ionosphere boundary) ; a few. 1996; Inan et al., 1997; Barrington-Leigh. kilometers in thickness. and Inan, 1999; Dial and Taylor, 1999;. Lateral dimension. 200-600 km. Moudry et al., 2003; Israelevich et al.,. Luminous duration. less than several milliseconds. 2004; Mende et al., 2005]. Occurring altitude. Brightness. ~ hundreds of kR [Kuo et al. 2008] Electromagnetic Pulse (EMP) [Inan et al., 1991; Inan et al., 1996a; Inan et al.,. Generating mechanism. 1997] Induced by both polarities; -CG elves account for 50% to 84%. Polarity of causative CG. [Barrington-Leigh and Inan, 1999; Frey et al., 2005; Newsome and Inan 2010]. Global detection rate. ~3.23 events per minute [Chen et al., 2008]. 1.1.5 Blue Jets Wescott et al. [1995] reported the observation of 56 blue luminous columns, called the blue jets, occurring over a thunderstorm in a 22 minute period on 1 July 1994. Blue jets (for examples see Figure 1-4) were so named because of their upward-propagating motion and color. Moreover, Chou et al. [2011] demonstrated that the red-band emissions were detectable from blue straters and jets, while the blue emissions were not recorded due to severe atmospheric scattering in the ground campaign. Blue jets propagated from the anvil cloud top (~15 km), terminated at ~40-50 km with a fountain‐like cone shape (~15°), and radiated optical emissions for ~200-300 milliseconds. The characteristics are summarized in Table 1-4. It was also reported that blue jets often occurred in group and within a short period [Wescott et al., 1995; Boeck et al., 1995; Lyons et al., 2003; Tsai et al., 2009; Chou et al., 2011]. For example, Chou et al. [2011] observed 33 blue jets/starters in a 5 minute period on 22 July 2007, and ISUAL recorded 155 blue jets over Typhoon Fungwong within 4 minute period on 27 July 2008 [Tsai et al., 2009]. Some. 9.
(30) researches have shown that [Wescott et al., 1996; Chou et al., 2011] the lightning occurring rate increased before the jets occurred but fell silent subsequently for a short period of time. Besides, Chou et al. [2011] reported other three patterns of lightning activities (lightning paused before the jets occur but increased after; jets induced by nearby lightning; standalone blue jets/starters). (a). (b). (f). (d). (c). (e). (g). Figure 1-4. Representative images of blue jets: (a)-(d) & (e) events recorded in Taiwan on the night of 22 July 2007 and 1 August 2010; (f) & (g) events recorded by ISUAL near Indonesia on 4 April 2009 and over central Africa on 14 May 2007 respectively.. 10.
(31) Table 1-4. Salient characteristics of blue jets. Occurring altitude. ~15 – 50 km (from cloud top) [Wescott et al., 1995] 200 – 300 milliseconds [Wescott et al., 1995; Boeck et al., 1995; Lyons et al.,. Luminous duration Brightness. 2003] ~500 kR [Wescott et al., 1995] Primarily blue, but also had red emission [Wescott et al., 1995; Chou et al.,. Color Morphology. 2011] Fountain‐like cone shape [Wescott et al., 1995] Tens to a hundred jets occurred within several minutes [Wescott et al., 1995;. Occurring interval. Boeck et al., 1995; Lyons et al., 2003; Tsai et al., 2009; Chou et al., 2011] Pattern 1: Increased before the jets occur but fell silent subsequently for a short period of time [Wescott et al., 1996; Chou et al., 2011] Pattern 2: Lightning paused before the jets occur but increased after [Chou et. Lightning activity. al., 2011] Pattern 3: Jets induced by nearby lightning [Chou et al., 2011] Pattern 4: Standalone blue jet/starter [Krehbiel et al., 2008;Chou et al., 2011]. 1.1.6 Gigantic Jets Gigantic jet (GJ) is the latest member of TLEs [Pasko, 2008, 2010; Pasko et al., 2011] and was first observed by Pasko et al. [2002] near Puerto Rico to propagate out from a thundercloud to an altitude of ~70 km. The characteristics of GJ are summarized in Table 1-5. In the following year, Su et al. [2003] observed five GJs near Philippines that directly linked the thundercloud top at ~16 km and the ionosphere at ~90 km. From the recorded optical images (see Figure 1-5 (a)-(d)), Su et al. [2003] noted that the evolution of these GJs can be divided into three stages: the leading jet, the fully-developed jet (FDJ), and the trailing jet, but whether there were cloud flashes before these events was not clear since the lower field-of-view (FOV) was blocked by a roof in the foreground. Su et al. [2003] also reported that there are two morphological forms (the tree-like and the carrot-like) for the FDJs. In a recent observation by Huang et al. [2012],. 11.
(32) a new intermediate type called the tree-carrot-like GJs is identified, based on their optical and radio signatures; the details will be discussed in Chapter 4. From the ISUAL survey, Chen et al. [2008] estimated that the global detection rate is ~0.01 events per minute. Chou et al. [2010] analyzed and categorized ISUAL GJs into three types, where type I is the brightest, type II is the dimmest and the brightness of intermediate type III is in between, according to their generating sequence and spectral features. As inferred from the associate ULF sferics, the type I GJs are negative cloud-to-ionosphere discharges (-CIs). Type II GJs begin as blue jets and then developed into GJs in ~100 milliseconds. Although no identifiable ULF sferics for the type II GJs was found at that time, a partially-obstructed GJ appears to be a type II event and has positive CI ULF signature; this classification has independently confirmed by an observation carried out in Mediterranean Sea [van der Velde et al., 2010]. Type III GJs were preceded by lightning, and a GJ subsequently occurred near this preceding lightning. Critically depending on the type of the charge imbalance induced by the preceding lightning, the type III GJs can either be negative or positive CI. The brightness of the streamer region (~50-90 km) in GJs is between 0.1 and 0.7 MR for a frame integration time of 29 milliseconds [Kuo et al., 2009].. 12.
(33) (a). (b). (c). (d). (e). (f). (g). (h). Figure 1-5. Representative images of GJs: (a)-(d) & (e)-(f) events observed in Taiwan on 22 July 2007 and 31 August 2010 respectively; (g) & (h) events recorded by ISUAL that occurred over the northern Indian Ocean on 30 September 2005 and over the southern Pacific Ocean on 3 July 2008 respectively. Table 1-5. Salient characteristics of gigantic jets. Occurring altitude. ~16 – 95 km (from cloud top to the ionosphere) [Su et al., 2003]. Luminous duration. hundreds of milliseconds [Huang et al., 2012]. Brightness. hundreds of kR [Kuo et al., 2009] GJs are upward discharge between thunderclouds and the ionosphere; GJs can. Polarity of GJs. either be negative or positive CIs 1,000 to 12,000 C-km [Su et al., 2003; Cummer et al., 2009; van der Velde et. CMC Global detection rate. al., 2010; Huang et al., 2012] ~0.01 events per minute [Chen et al., 2008] Type I: negative cloud-to-ionosphere discharge (-CI) [Chou et al., 2010] Type II: began as blue jet and then developed into GJ in ~100 milliseconds. Generating sequence and features. (+CI) [Chou et al., 2010; van der Velde et al., 2010] Type III: GJ was preceded by lightning, and a GJ subsequently occurred near this preceding lightning (both polarities depend on the preceding lightning) [Chou et al., 2010]. 13.
(34) 1.2 Radio Atmospheric Signals, Sferics 1.2.1 Overview In the lowest frequency range of radio signal propagation, such as very low frequency (VLF, 3-30 kHz), extremely low frequency (ELF, 3-3000 Hz), or ultra low frequency (ULF, less than 3 Hz), the propagation paths of the radio signals are reflected between the ground surface and the lower ionospheric D layer (60-90 kilometers, depending on the time of a day), which are both highly conductive boundaries and form the “Earth-ionosphere cavity.” The attenuation and dissipation of the lowest frequency radio waves in the cavity are so low (~0.3 dB per 1,000 km at 10Hz and 2-3 dB per 1,000 km in VLF range) [Jones 1967; Burke and Jones, 1996; Hunsucker and Hargreaves, 2002] that the radio atmospheric signals (sferics in short) can propagate over a long distance (a few to ten thousand kilometers), sometimes even circumnavigates the Earth a few times.. 1.2.2 Lightning and Sferics Lightning are electric discharges between electrically-charged regions within cloud (intra-cloud lightning, IC), between clouds (inter-cloud lightning, IC), or between a cloud and the surface of the Earth (cloud-to-ground lightning, CG). During a lighting stroke, a broadband electromagnetic wave with a frequency range of a few Hz to tens of MHz is also generated [Burke and Jones, 1992; Weidman et al., 1986]. However, due to the briefness of the lightning discharge (~10 microseconds) and the lengthy current channel (a few to ten kilometers), most of the energy in the electromagnetic band is distributed in the ELF and VLF ranges. Furthermore, the global occurrence rate and total number of. 14.
(35) lightning discharges are around 40-50 flashes per second and ~1.4 billion flashes per year respectively [Christian et al., 2003; Oliver, 2005]. The huge occurring number and the large energy of lightning render it being the dominant radiation source of sferics. However, if the far field (farther than hundreds kilometers) of lightning sferics is considered, only the horizontal magnetic field as well as the vertical electric field would survive and the source current channel of the sferics can be approximated by a vertical discharge.. In a simplified model, there are two main charge regions (a large positive charge region locates above a large negative charge region near the center of the cloud) in a normal-polarity thundercloud, and often there is a weaker positive charge in the lower altitude [Williams, 1989; Krehbiel et al., 2008]. This triple structure favors the occurrence of negative CG over positive polarity counterparts, and is believed to be the cause behind the ratio of the negative and positive ground flashes being nearly 10 to 1 [Rakov and Uman, 2007, and references therein; Williams et al., 2007]. A lightning stroke will move a certain amount of charge over a distance, and thus a physical quantity called the charge moment change (CMC) is defined as the charge removed times the relocated distance. Hence in the electromagnetic field, how to infer the CMC for a discharge event from its associate ULF/ELF/VLF band sferics is one of the most important tasks. Two methods have been used to extract CMC from the recorded sferics. One is a time domain deconvolution method introduced by Cummer and Inan [1997], which is usually applicable to relatively nearby events (~5000 kilometers or less). The other is by solving frequency-dependent normal mode equations commonly and is often applicable to distance events [Huang et al., 1999; Sato and Fukunishi, 2003; Huang et al., 2011]. Also, in order to find the association between a lightning discharge and a detected sferic, a. 15.
(36) proper bearing angle inferred from two horizontal magnetic field components often is the first step toward establishing their connection.. For illustration, sferics from several negative CG lightning which were recorded by the Lulin ULF and the Cingcao ELF/VLF stations are shown in Figure 1-6. These events were chosen from the Worldwide Lightning Location Network (WWLLN; [Dowden et al., 2002; Hutchins et al., 2012]) database for they have a similar intensity – both discharges contain around ten thousand joules of radiation energy. For the sferics depicted in Figure 1-6 (a) and (b), they are from two separated lightning sources (blue-line denoted event occurred at 14:04:02.554536; red-dotted line denoted event occurred at 13:52:20.499247 UTC; both occurred on 3 August 2012). These sferics were from vastly separated sources and were so chosen to illustrate the effects in the signal propagation and attenuation; the sferic denoted by the blue line has a source distance of ~1 Mm, while the sferic represented by the red dotted line has a source distance of ~10 Mm. Comparing with the blue line denoted sferic that was radiated by a source at one thousand kilometers away, the strength of the red dotted denoted sferic is so weak that it has to be scaled up by ten folds to be properly displayed in the figures. The source of the red dotted sferic shown in Figure 1-6 (a) and (b) was located in the middle of Africa, and the propagation path to Taiwan would cross the day and night terminator. In order to show the condition to resemble the typical Taiwan TLE campaign during the night, the red dotted event in Figure 1-6 (c) is chosen. The source discharge of the red dotted sferics shown in Figure 1-6 (c) occurred at 17:25:38.541361 UTC on 3 August 2012, and was also located in the middle of Africa. Due to the difference event time, the propagation path to the stations in Taiwan was all in the night hemisphere. The bearing angle for the discharge sources of these sferics can be inferred by constructing Lissajous figures. The pointing differences. 16.
(37) of the Lulin ULF and the Cingcao ELF/VLF sferics from 1 and 10 Mm are 1.73° (blue Lulin ULF event in Figure 1-6 (a) and (c)), 6.89° (blue Cingcao ELF/VLF event in Figure 1-6 (b)), 2.89° (red dotted Lulin ULF event in Figure 1-6 (c)), and none (red dotted events in Figure 1-6 (a) and (b)). The closer set is precise enough, but the farther set has a low signal-to-noise ratio (SNR) for the signal to be confidently analyzed. However, it is surprised that the ULF sferics from 10 Mm (red dotted line in Figure 1-6 (a) and (c)) is still recognizable, even in ELF/VLF band (red dotted line in Figure 1-6 (b)). This great advantage of sferics that can propagate over a long-range will be further used and studied in the following chapters.. 17.
(38) Figure 1-6. Lightning sferics recorded by the NCKU stations: (a) the Lulin ULF band signals and (b) the Cingcao ELF/VLF band signals; the source of the more distant sferics and the stations straddled the terminator; and (c) Lulin ULF band signals; the source of the more distant sferic was in the night hemisphere. These events were chosen from the WWLLN database for they have a similar intensity - both have around ten thousand joules of radiation energy, while they respectively are 1 Mm (blue solid line) and 10 Mm (red dotted-line) away. The sferics from 10 Mm lightning strokes suffered severe attenuation and their amplitudes have to be scaled up 10 folds in the figures.. 1.2.3 Sferics Associate with Sprites Soon after the discovery of sprites, they were found to be mostly induced by positive cloud‐to‐ground lightning (+CG) [Boccippio et al., 1995], which also radiates intense electromagnetic energy in the ULF band as shown in Figure 1-7 (a). Although thousands of sprites have been observed in the ensuing decades, only a few of sprites were reported to be triggered by negative lightning [Barrington-Leigh and Inan, 1999; Taylor et al., 2008; Lyons et al., 2010; Li et al., 2012]. Besides the polarity asymmetry [Williams, 2006,. 18.
(39) and references therein; Williams et al., 2007, and references therein], the vertical CMC (see Figure 1-7 (b)) is found to be another important characteristic in gauging the potential of lightning discharges to produce sprites [Cummer and Inan, 1997; Bell et al., 1998; Cummer et al., 1998; Cummer and Stanley, 1999; Huang et al., 1999; Füllekrug and Constable, 2000; Cummer and Füllekrug, 2001; Hobara et al., 2001; Hu et al., 2002; Sato et al., 2003; Li et al., 2008; Newsome and Inan, 2010; Hunag et al., 2011]. For example, Hu et al. [2002] reported that the probability of sprite initiation is greater than 90% for positive lightning with a CMC larger than 1,000 C-km, while the probability is less than 10% for lighting with a CMC smaller than 600 C-km. Therefore, the electromagnetic measurements have been used extensively in the studies of sprites; a partial list of the examples include the campaigns carried out in North America [Cummer and Inan, 1997; Bell et al., 1998; Reising et al., 1999; Cummer and Stanley, 1999; Huang et al., 1999; Cummer and Inan, 2000a; Cummer and Inan, 2000b; Füllekrug et al., 2001; Cummer and Füllekrug, 2001; Hu et al., 2002; Sato et al., 2003; São Sabbas et al., 2003; Cummer et al., 2006a; Li et al., 2008; Newsome and Inan, 2010], South America [Pinto et al., 2004; Taylor et al., 2008; São Sabbas et al., 2009], western Europe [Neubert et al., 2005; Arnone et al., 2008], central Europe [Bór et al., 2009], eastern Mediterranean [Greenberg et al., 2007; Yair et al., 2009], Japan [Hobara et al., 2001; Sato and Fukunishi, 2003], Africa [Williams et al., 2010], and Taiwan [Su et al., 2003; Huang et al., 2011].. 19.
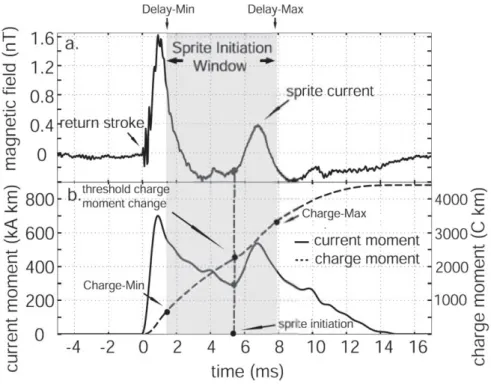
(40) Figure 1-7. A representative sferics associate with sprite including the causative lightning discharge (first peak) and sprite current (second peak); Adapted from Hu et al. [2002].. Besides optical observations, monitoring the perturbations in the VLF beacon signals has also been proposed to be a way to remote sense the occurrence of TLEs [Inan et al., 1995; Hobara et al., 2001; Marshall et al., 2006; Inan et al., 2010, and references therein]. Furthermore, ~10% of sprites were found to have electric current flowing inside luminous columns [Cummer et al., 1998; Reising et al., 1999; Cummer and Stanley, 1999; Füllekrug et al., 2001; Hu et al., 2002; Cummer, 2003], and radiated electromagnetic pulses showed up as the second peak in Figure 1-7 (a). The signature of sprite currents is very different from that of normal lightning, because the pulses do not contain radiation energy above ~1 kHz [Cummer et al., 1998; Hu et al., 2002; Cummer et al., 2006b]. The data collected in the balloon [Thomas et al., 2005] and the space campaigns [Cummer et al., 2006b] produced results that agree with the previous ground measurements. The largest strength of sprite current moment is ~1,000 kA-km, and the integrated CMC is ~1,200 C-km [Hu et al., 2002].. 20.
(41) 1.2.4 Sferics Associate with Halos In opposite to the rarity of negative lightning-induced sprites, halos are more frequently triggered by negative CGs. Frey et al. [2007] analyzed 31 pure halos from ISUAL with unambiguous sferics and found 25 cases were induced by negative lightning. Williams et al. [2012] also uncovered a consistent result and noted that 98 out of 121 ISUAL halos are caused by negative lightning. Negative lightning induced more than 80% of recorded pure halos, and seems to be a singular feature that characterizes halos [Barrington-Leigh et al., 2001; Bering et al., 2002, Bering et al., 2004a; 2004b; Bhusal et al., 2004]. However, Newsome and Inan [2010] used a high-speed array photometers, an wide‐field‐of‐view video‐rate camera, and a pair of ELF/VLF receivers to observe 166 halos from six storms and get nearly equal number of halos in both polarity groups.. 1.2.5 Sferics Associate with Elves In contrast to the polarity asymmetry associating with sprites and halos [Williams et al. 2012], elve can be initiated by either the negative or the positive lightning [Barrington-Leigh and Inan, 1999]. Frey et al. [2005] used 593 ISUAL elves and the Duke ELF/VLF data, and showed ~50% of elve-inducing CGs possess a three-step signature which usually associates with a -type negative lightning. During the EuroSprite2003 ground campaign, Mika et al. [2006] observed three elves triggered by strong positive CGs (peak current intensities: +217, +110, and +119 kA). Montanyà et al. [2010] captured several elves through a high-speed camera and found that the associate lightning comprises of 8 positive CGs (mean peak current: +193 kA) versus 6 negative CGs (mean peak current: -155 kA); the elve-inducing CGs feature a high peak current and with a polarity symmetry, which are consistent with previous findings. Newsome and. 21.
(42) Inan [2010] also used high-speed array photometers to carry out investigations on elves, and observed 637 pure elves and 166 elve-with-halo events in 2008. The fractions of negative elve-inducing lightning are 84.1% and 55.4% respectively. They also reported that 464 observed elves also have concurrent NLDN-detected CG lightning; while the peak current of the causative CGs were mostly lower than 75 kA. However, they also noted that, when the peak current of CGs was over 50 kA, the probability for the intense lightning to produce elve rose significantly.. 1.2.6 Sferics Associate with Blue Jets and Gigantic Jets The previously discussed TLEs (sprite, halo and elve) are closely related to lightning discharges, whereas the blue jets and GJs are quite different and are the upward-propagating counterparts of the cloud-to-ground discharges [Su et al., 2003; Krehbiel et al., 2008; Cummer et al., 2009; Huang et al., 2012]. Due to the rarity of blue jets observations, it is very hard to study the associate sferics of blue jets. The most important blue jet-associated sferics data thus far was recorded by Krehbiel et al. [2008] during the STEPS 2000 campaign [Lang et al., 2004] through a three-dimensional very high frequency (VHF) lightning mapping array [Rison et al., 1999]. However, the low frequency band sferics was not detected.. Most of observed GJs were found to occur over severe weather systems such as tropical cyclones or typhoons [Tsai et al., 2009; Huang et al., 2012; Meyer et al., 2013]. The studies of GJs have been fruitful since the early days of discovery, for most of GJs were found to have clearly discernible associate sferics [Su et al., 2003]. They tend to transfer a large amount of negative charge from cloud to ionosphere (-CI) and the CMC ranges between 1000 C-km and 12,000 C-km [Su et al., 2003; Cummer et al., 2009; van. 22.
(43) der Velde et al., 2010]. The CMC in GJs are substantially larger than the threshold of CMC needed for lighting to initiate sprites (600 C-km; [Hu et al., 2002]). However, the actual charge transferred from the thunderstorm to the ionosphere is less than 150 C due to the unusually long channel length in GJ (75 km [Cummer et al. 2009] to 85 km [van der Velde et al., 2010]). The charge transfer in GJs is comparable with the amount of charge removed from intense lightning strokes that contain significant continuing currents [Cummer et al. 2009, and references therein]. These large scale CI discharges are a global phenomenon, as deduced from the ground campaigns carried out in the North America [Pasko et al., 2002; van der Velde et al., 2007; Cummer et al., 2009; Lu et al., 2011; Meyer et al., 2013], Europe [van der Velde et al., 2010], Indian Ocean [Soula et al., 2011], Asia [Su et al., 2003; Chou et al., 2011; Huang et al., 2012; will be discussed further in Chapter 4], and the space [Chen et al., 2008; Kuo et al., 2009; Chou et al., 2010; Lee et al., 2012]. Except for two positive GJs [Chou et al., 2010; van der Velde et al., 2010; Meyer et al., 2013], most of the GJs observed thus far are negative CIs.. 23.
(44) 1.3 Motivations and Contributions The motivation of this dissertation is to systematically examine the electromagnetic signatures of various types of TLEs. The events were observed either in the Taiwan ground TLE campaigns or recorded globally by the ISUAL experiment onboard the FORMOSAT-2 satellite. Sferics that are associated with TLEs in the ULF to ELF/VLF bands form the foundation of this dissertation in the study of the characteristics of the causative discharges. The contributions of this thesis work are the followings: . An earlier, lightning-damaged Lulin ULF recording system are repaired, re-calibrated and improved to achieve a broader recording frequency range (up to ~1 kHz). A new Cingcao ELF/VLF recording system is installed with the aims to closely examine the TLE-associated discharges and with a higher time resolution. Data from both recording systems are used for the cross-checking and the deduction of the electromagnetic signatures of TLE-associated discharges.. . A simple method for signal reconstruction is introduced to properly re-analyze the dataset recorded by the previous notch-filtered Lulin system. From examining the response of the notch-filtered system to the synthetic waveforms from a signal generator and 20 sferics associate with ISUAL sprites, the reconstructed method were found to consistently recovers the phase and the part of amplitude that are most critical for the data analyses. Using the reconstructed sferics, a tighter linear relationship between the CMCs of the sprite-inducing CGs and the brightness of sprites is found.. . With the renovated Lulin ULF and the newly-constructed Cingcao ELF/VLF recording stations, many associate sferics of the TLEs observed in the ground TLE. 24.
(45) campaigns are recorded. Among them, ULF and ELF/VLF sferics of fourteen negative gigantic jets occurring near the southern Taiwan are recorded and analyzed. The features in the associate ULF and ELF/VLF sferics could be used to clearly identify the discharging sources are from cloud discharges or gigantic jets themselves. Furthermore, the variations of features in the sferics from the negative GJs can be divide into three types as “tree-like”, “carrot-like” and “tree-carrot-like" GJs and correspond well with the stages discerned in the optical images, which include the initiating lightning, the leading jet, the fully-developed jet and the trailing jet. . The Lulin ULF and Cingcao ELF/VLF systems are important supporting facilities for the space-borne instrument: ISUAL. From June 2009 to June 2012, both systems have operated continuously, and have recorded more than ten thousand sferics associate with ISUAL TLEs among a much larger set of sferics data. With the radio data, the TLE detectability in the ULF/ELF/VLF bands, the polarity distribution, the averaged waveforms, the rise and decay time, and the frequency spectra of the TLE-associated discharges are analyzed.. 25.
(46) Chapter 2 Instruments 2.1 Optical TLE Ground Campaigns 2.1.1 Overview Since 2001, the NCKU (the red square in Figure 2-1) group has carried out yearly summer optical TLE campaigns at various locations in the southern Taiwan [Su et al., 2002; Hsu et al., 2003]. The main observation sites are located in three regions. The first one is in the mountain areas including Ali Mountain of Taiwan near the Central Ridge with an altitude of 2,413 meters and the Lulin observatory with an altitude of 2,862 meters (the yellow cross in Figure 2-1), for they often have clear sky and un-obstructed views to the surrounding areas. When the East Asian rainy season approaches in the spring, these two locations are favorable for the observation of TLEs occurring over Fujian province of China and the nearby coastal areas [Su et al., 2002; Chou et al., 2011]. When the large convective systems and typhoons approach from the south or east of Taiwan during the summers, the Kenting site (the yellow circle in Figure 2-1) at the southern tip of Taiwan has the best view to thunderstorm systems in these two directions [Su et al., 2003]. Finally and thirdly, the roof of the Physics Departmental building at the NCKU campus will be used if there is not enough time to safely get to the. 26.
(47) abovementioned remote sites [Su et al., 2002; Huang et al., 2012]. Over the past decade, more than fifteen hundred TLEs have been captured with various types of instruments include as a medium-speed camera (Photron SUPER 10K FASTCAM, 250 FPS at resolution of 512 × 480 pixels), spectrometer, and video-rate low-light-level Watec CCD cameras equipped with different band filters. The observational instruments and strategies have been improved over the time and have helped to increase our knowledge of TLEs. Two kinds of platforms are currently used by the NCKU group to carry out ground TLE observations.. Figure 2-1. Map for the vicinity of Taiwan. The overlapping markers are: the yellow cross - the ULF station locates at the Lulin observatory, the green triangle - the ELF/VLF station locates at the Cingcao elementary school, the red squares - remote-controllable optical platforms at Kinmen, Ponghu, NCKU, and Taitung (from west to east) and the yellow circle is Kenting at the very southern tip of Taiwan for TLE ground campaign.. 27.
(48) 2.1.2 Portable Platforms From over a decade of experience in carrying out the TLE ground campaigns, several manual operated platforms have been developed to assist TLE ground observations. They usually contain two to six well-aligned cameras on a single tripod and have digital video recorders or laptop computers to record the standard NTSC frame rate (30 frames or 60 image fields per second) video data. Each camera consists of a WATEC NEPTUNE 100 CCD or WATEC 902H ULTIMATE CCD and equips with several lens in different focal lengths ranging from 8 mm (FOV: 46.2° (Horizontal) × 34.7° (Vertical)) to 50 mm (FOV: 7.5° (Horizontal) × 5.6° (Vertical)). The standard configuration for the portable platform contains three cameras all equipped with 12 mm/f1.2 lens (FOV: 30.8° (Horizontal) × 23.1° (Vertical)) and red, blue, and open filters to feature a relatively wide FOV and observe TLEs through three optical bands. The image fields from the cameras are further passed through GPS synchronized time code inserters to imprint the millisecond accuracy time codes on the video frames. These portable observational platforms are relatively easy to be relocated and appropriate for TLE observations at mountainous areas like the Lulin observatory (the yellow cross in Figure 2-1) or at seashore sites like Kenting (the yellow circle in Figure 2-1).. 28.
數據
+7

Outline
Motivations and Contributions
ELF/VLF Magnetic and Electric Field Recording System
Associate ULF Sferics of the ISUAL Sprites
Conclusion
Occurrence of GJs in Typhoon Lionrock (2010)
Radio Signals Associate with the Trailing jet (the Continuing Current)75
Polarity Distribution of the TLE-associated Discharges
Summary
Extension of Our Sferic Recording Frequency Range to Low
相關文件
(In Section 7.5 we will be able to use Newton's Law of Cooling to find an equation for T as a function of time.) By measuring the slope of the tangent, estimate the rate of change
2.1.1 The pre-primary educator must have specialised knowledge about the characteristics of child development before they can be responsive to the needs of children, set
Reading Task 6: Genre Structure and Language Features. • Now let’s look at how language features (e.g. sentence patterns) are connected to the structure
Promote project learning, mathematical modeling, and problem-based learning to strengthen the ability to integrate and apply knowledge and skills, and make. calculated
Now, nearly all of the current flows through wire S since it has a much lower resistance than the light bulb. The light bulb does not glow because the current flowing through it
We point out that extending the concepts of r-convex and quasi-convex functions to the setting associated with second-order cone, which be- longs to symmetric cones, is not easy
This kind of algorithm has also been a powerful tool for solving many other optimization problems, including symmetric cone complementarity problems [15, 16, 20–22], symmetric
Microphone and 600 ohm line conduits shall be mechanically and electrically connected to receptacle boxes and electrically grounded to the audio system ground point.. Lines in
