行政院國家科學委員會專題研究計畫 成果報告
以能量流程圖應用於高壓電斷路器動力分析之研究 研究成果報告(精簡版)
計 畫 類 別 : 個別型
計 畫 編 號 : NSC 99-2221-E-011-015-
執 行 期 間 : 99 年 08 月 01 日至 100 年 10 月 31 日 執 行 單 位 : 國立臺灣科技大學機械工程系
計 畫 主 持 人 : 徐茂濱
計畫參與人員: 碩士班研究生-兼任助理人員:江哲維 碩士班研究生-兼任助理人員:王聖瑋 博士班研究生-兼任助理人員:余銘容
公 開 資 訊 : 本計畫涉及專利或其他智慧財產權,2 年後可公開查詢
中 華 民 國 100 年 11 月 01 日
中文摘要: 本計畫提出一種以能量流程圖為基礎的方法對高壓電斷路器的 驅動機構進行動力分析。於本方法中,斷路器驅動機構於運動 過程中的拓樸構造改變,以及其中複雜的碰撞現象,皆在該機 構之能量流程圖模型中以具有切換功能的零接點及連續接觸力 模組來加以模擬,此舉可以大幅簡化數值分析方法的複雜度。
此外,本計畫基於簡單的實驗數據,提出一有效的法則來校準 能量流程圖模型中的參數。本方法的效用與精度與實際機構的 實驗數據來加以比較獲得證實。
英文摘要: This project presents an energy-based bond graph approach for simulating the trigger hook response time of the driving mechanism used in high-voltage circuit breakers. The complicate topology changing motion characteristics of the mechanism and the
corresponding contact impact phenomena are largely simplified in the bond graph model by introducing a continuous contact force module with switched zero-junction. A practical method for
calibrating the equivalent system parameters of the model based on simple experiment data is also presented. The effectiveness and accuracy of the proposed method is verified by comparing the simulated results with the measured data of a real system under various applied conditions.
行政院國家科學委員會補助專題研究計畫
■成果報告
以能量流程圖應用於高壓電斷路器動力分析之研究
計畫類別:■個別型計畫 □整合型計畫 計畫編號:NSC 99-2221-E-011-015
執行期間: 2011 年 8 月 1 日至 2011 年 10 月 31 日 執行機構及系所: 國立台灣科技大學 機械研究所
計畫主持人: 徐茂濱 共同主持人: 王勵群
計畫參與人員:余銘容、江哲維、王聖瑋
成果報告類型(依經費核定清單規定繳交):■ 精簡報告 □完整報告
本計畫除繳交成果報告外,另須繳交以下出國心得報告:
□赴國外出差或研習心得報告
□赴大陸地區出差或研習心得報告
□出席國際學術會議心得報告
□國際合作研究計畫國外研究報告
處理方式:除列管計畫及下列情形者外,得立即公開查詢 □涉及專利或其他智慧財產權,□一年□二年後可公開查詢
中 華 民 國 100 年 10 月 30 日
A Bond Graph Approach for Predicting the Trigger Hook Response Time of High-Voltage Circuit Breaker Driving Mechanisms
By Ming-Jung Yu Graduate Student
and Li-Chun T. Wang
Professor and Mau-Pin Hsu Associate Professor
National Taiwan University of Science and Technology Department of Mechanical Engineering,
A Bond Graph Approach for Predicting the Trigger Hook Response Time of High-Voltage Circuit Breaker Driving Mechanisms
Abstract: This report presents an energy-based bond graph approach for simulating the trigger hook response time of the driving mechanism used in high-voltage circuit breakers. The complicate topology changing motion characteristics of the mechanism and the corresponding contact impact phenomena are largely simplified in the bond graph model by introducing a continuous contact force module with switched zero-junction. A practical method for calibrating the equivalent system parameters of the model based on simple experiment data is also presented. The effectiveness and accuracy of the proposed method is verified by comparing the simulated results with the measured data of a real system under various applied conditions.
Keywords: circuit breaker, response time, topology changes, contact mechanics, bond graphs, switched zero-junction
1. INTRODUCTION
An electrical circuit breaker is an automatically-operated electrical switch equipped to protect an electrical circuit from damage caused by overload or short circuit. Circuit breakers have different ratings from low-voltage devices that protect household appliances up to high-voltage switchgear to protect high-voltage circuits feeding a city area (NEMA Circuit Breaker Section, 1994). For a high-voltage circuit breaker, the most important design consideration is the breaking time which is customarily designated to be in the order of ten mili-seconds to isolate electrical troubles at instant and to avoid longer arcing which may damage the contactors of switch due to overheating.
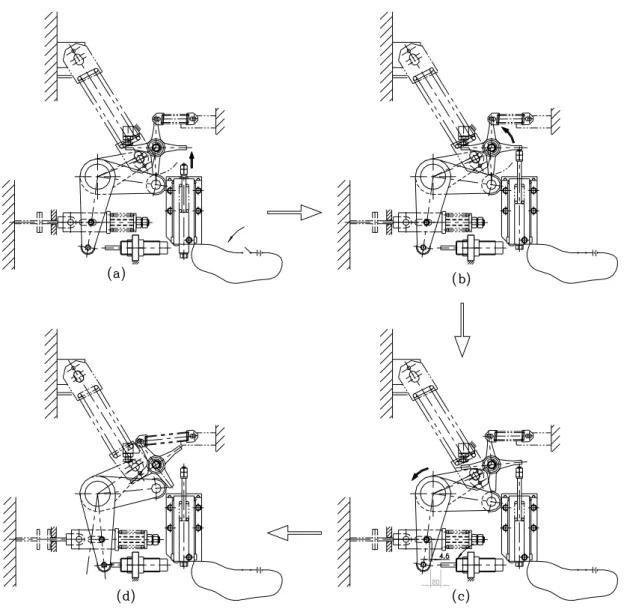
In general, the breaking time of a circuit breaker comprises of the mechanical opening time and the electrical arcing time. According to the operation stages of the driving mechanism of the circuit breaker, the mechanical opening time can be further divided into three periods, namely the solenoid acting time, the trigger hook response time, and the main shaft driven time. Figure 1 is the schematic diagram of the driving
mechanism of a typical 24kV circuit breaker. When the control switch of electrical circuit in the solenoid is activated, the armature will move due to the induced electro-magnetic force. The moving armature will contact the trigger hook after a short accelerating period. The configuration of the mechanism is then changed from Fig. 2(a) to Fig. 2(b), and its elapsed period is defined as the solenoid acting time (SAT). Due to the friction force of the trigger hook shaft and the adverse force of the reset spring, the velocity of the trigger hook will be gradually reduced until the release angle of which is reached as shown in Fig. 2(c), and the period from Fig. 2(b) to Fig. 2(c) is called the trigger hook response time (THRT). After the trigger hook is released, the main shaft
will be allowed to rotate to drive the switch contactors by the spring forces of the open and the wipe spring, such that the configuration of the mechanism would be changed from Fig. 2(c) to Fig. 2(d), and the elapsed time of this final period is referred to as the main shaft driven time (MSDT).
A number of methods have been developed for analyzing and simulating the general motion characteristics of solenoids (Pawlak et al., 1988; Lequesne, 1990;
Marielle et al., 1999). Besides, as indicated by Root and Ragsdell (1983), the MSDT of the circuit breaker can be calculated by using commercial available multi-body dynamic simulation programs such as IMP or ADAMS. Therefore, the subject matter of this article is focused on establishing a systematic approach to predict the THRT.
In order to compute the THRT, it is necessary to first formulate the dynamic model of the driving mechanism of the circuit breaker. However, it should be noted that the kinematic structure of the circuit breaker is different from conventional single degree of freedom planar mechanisms in that it undergoes a sequence of topology changes during a motion cycle. As indicated in figure 2, the armature and the trigger hook will separate from each other after a very short period of contact. Consequently, the kinematic constraints imposed on the mechanism at the two stages (i.e. before and after) of the contacting period would be different. Although the topology changing problem may be handled by individually performing dynamic analysis at each stage, or, as suggested in Gilmore and Cipra (1991), by using an incidence matrix to bookkeeping and reformulate the kinematic constraint equations at different stages to achieve continuous dynamic analysis, the involved derivations and mathematic manipulations of these methods are very elaborate, and, hence, may not be appreciated by industrial engineers at large. In order to resolve this difficulty, a bond graph based approach for modeling
and simulating the dynamic response of the circuit breaker mechanism is proposed in this article. In this approach, a simple strategy is developed to carry out continuous-time simulation in one stage. In addition, it takes the advantage of well developed simulation languages such as 20-sim to establish the bond graph model of the system, therefore, a thorough knowledge of system dynamics is not essential and the involved mathematic derivations is considerably reduced.
2. MODELING WITH BOND GRAPHS
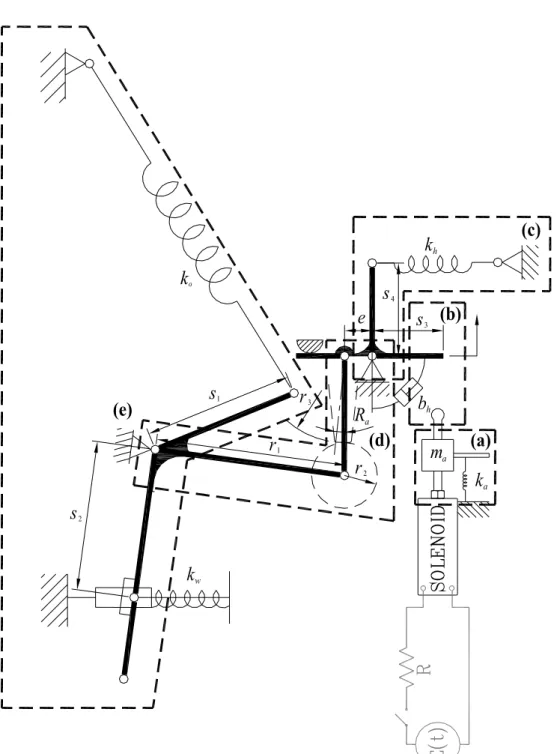
In order to conveniently predict the THRT, the system of Fig.1 is divided into five subsystems as shown in Fig. 3 under the following assumptions:
(1) Only the mass/moment inertia of the main components–armature, trigger hook, and main shaft are considered and regarded as particle nodes with lumped mass or mass moment of inertia. The mass of all springs are neglected.
(2) The stiffness of each component except that of the springs is high enough to be regarded as rigid body.
(3) The frictional forces between the components except the ones with respect to the trigger hook are small enough to be neglected. The friction force of the trigger hook is assumed to be linearly dependent on the rotational speed of the trigger hook shaft.
(4) The springs are ideal and have linear stiffness constants.
(5) The impacting bodies undergo a central impact of local deformation and material damping with a constant restitution coefficient. The vibration factor caused by impact and the clearance impact between the trigger hook shaft and its bearing support are not considered.
The bond graph models of the five subsystems constructed on the basis of the above assumptions are shown in Fig. 4(a) ~ 4(e) and are separately explained as below:
2.1 Armature of Solenoid
The armature of the solenoid is modeled as a moving mass which connected to an adverse reset spring and subjected to an electro-magnetic force before contact. The bond graph of such model is shown in Fig. 4(a), in which the mass of the armature is represented by an inertial element I with parameterma, and the reset spring is represented by a capacitor element C with parameter ka. An effort source element, Se, with parameter Fe, is used to represent the driving electro-magnetic force induced by electric current, the value of which is obtained according to the characteristics of the solenoid. The three elements are constrained by a 1-junction of the armature velocity, va.
2.2 Impact Contact between Armature and Trigger Hook
The moving armature contacts the trigger hook after traveling a specific distance from the position of Fig. 2(a) to that of Fig. 2(b). The topological change of the mechanism due to discontinuous contact with impact is handled by introducing a switched zero-junction, X0 (Breedveld, 2002) and a continuous force model with stiffness and damping in the bond graph of Fig. 4(b).
As shown in the left-hand side of Fig. 4(b), the velocity of the armature, va, and that of the trigger hook, vh, are integrated to obtain the positions of the armature and the trigger hook. The velocity of the 1-junction of impact velocity, vah, is the difference between the velocity of contact point on the armature and that of the trigger hook. The
Contact-Detect Condition block is in fact an if-then-else statement such that the interaction force applied by the 1-junction of impact velocity on the X0-junction is switched off until the position of the armature reaches that of the trigger hook.
As shown in the right-hand side of Fig. 4(b), special visco-elastic elements of C and R for the restitution force, Fs, and the hysteretic damping force, Fd, respectively, are introduced to solve the problem of contact impact phenomena. The contact force of the visco-elastic elements is computed based on the following equation proposed by Hunt and Crossley (1975)
s d
F F F= + =K δγ + β δ δγ • (1)
where δ is the relative indentation of two contacting bodies and γ is designated to 3/2 as suggested by Hertz contact theory of ideal elasticity. δ• is the impact velocity obtained by differentiating the indentation with respect to time. β is the constant hysteretic damping coefficient which can be evaluated by
( 2)
1 2
3 1
4 ( )
r
i i
K e
β V -V
= − , (2)
where er is the restitution coefficient which can usually be estimated directly from experiment data (Goldsmith, 1960). By assuming the tip of the armature and that of the trigger hook are of spherical shape and isotropic material, the stiffness constant K of local deformation due to impact can be formulated as (Lankarani et al., 1994)
( )
4 1 2
3
R Ri j /
K π h hi j R Ri j
⎡ ⎤
⎢ ⎥
= + ⎢ + ⎥
⎣ ⎦
(3)
where Ri and Rj are the radii of contact surfaces of the two impact bodies; hi and hj are the material parameters of the bodies given by
1 m2 m
m
h ν π E
= − (4)
In which vm and Em (m = i, j) are respectively the Poisson’s ratio and the Young’s modulus of body m. It should, however, be noted that the stiffness constant K so calculated only gives an idealized estimation of its true value, as the material property and the structure of the investigated physical system may not be consistent with the assumptions. A method for calibrating this parameter is given in section 3 of this report.
2.3 Trigger Hook
The trigger hook is connected with the reset spring, the stop bar, and the mechanism of trigger cam and roller as shown in block (c) of Fig. 3, the bond graph of which is modeled in Fig. 4(c). The velocity of the trigger hook, vh, obtained from momentum transfer of contact reaction, is first transformed into the angular velocity of the trigger hook shaft, θ&1, by a transformer modulus TF:s3, where s3 denotes the length of the lever arm, and then transformed into the linear velocity of the hook reset spring by TF:s4. The elements I, C, and R with parameters Jh, kh, and bh are used to denote, respectively, the moment of inertia of the trigger hook, the stiffness of the reset spring, and the rotational friction of the trigger hook. It should be noted that the friction coefficient bh is difficult to be evaluated precisely by either theoretic calculations or simple experiments, as which includes the effect due to the friction of the trigger hook shaft and that between the trigger cam and the roller. Nevertheless, this difficulty can be
resolved by using a proper calibration process, as will be shown in section 3.
2.4 Trigger Cam and Roller
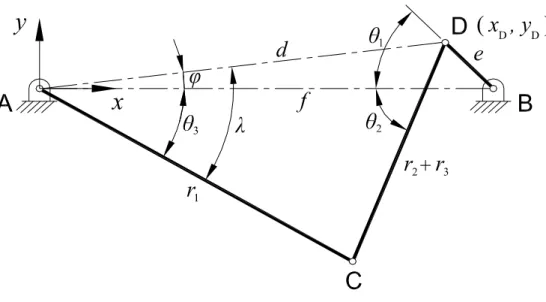
The bond graph model for the trigger cam and roller follower mechanism is shown in Fig. 4(d). By noting that the contact profile of the eccentric cam embedded on the trigger hook as shown in Fig. 1 is designed to be a circle offset to the center of the shaft by a small distance, the kinematic structure of this mechanism can be converted into an equivalent four-bar linkage as shown in block (d) of Fig. 3. Accordingly, the analytical procedure for computing the angular velocity of the main shaft can be derived based on the kinematics analysis of the linkage and incorporated in the bond graph model as a modulated transformer (MTF).
The reference frame and the link parameters of the equivalent linkage are defined in Fig. 5. As shown in the figure, the magnitude and direction angle of vector AD can be written as
d =(xD2 +yD2)12 (5)
ϕ =tan−1(y xD D) (6)
where xD = f −ecosθ1 (7)
and y e D= sin θ1. (8)
By applying the law of cosines to triangle DAC, one obtains
1 2 12 ( 2 3)2
1
cos 2
- d r r r
λ r d
⎡ + − + ⎤
= ⎢ ⎥
⎢ ⎥
⎣ ⎦
, (9)
and then the output angle of the linkage can be computed from
θ3 = − λ ϕ. (10)
In addition, since
(r2+r3)sinθ r 2 = 1 sinθ3 + e sinθ1 (11)
(r2 +r3)cosθ2 = − f r 1 cosθ3 − e cosθ1 (12) therefore
( ) ( )
2 tan-1 sin1 3 sin 1 cos1 3 cos 1
θ = ⎡⎣ r θ + e θ / f − r θ − e θ ⎤⎦ . (13)
Differentiate equations (11) and (12) with respect to time yields
(r2+r3)θ•2cosθ r2 = 1θ•3cosθ3 + eθ•1cosθ1 (14)
(r2+r3)θ•2sinθ2 = −r1θ•3sinθ3 − eθ•1sinθ1. (15)
Simultaneously solving equations (14) and (15) gives the input/output angular velocity relationship of the linkage as
( )
( )
3 1
2 1
1 2 3
sin sin
e θ θ
θ θ
r θ θ
• ⎡ + ⎤ •
= − ⎢ ⎥
⎢ + ⎥
⎣ ⎦ . (16)
2.5 Main Shaft
The main shaft is connected to the trigger cam and roller mechanism together with the open spring and the wipe spring as shown in block (e) of Fig. 3. It is forced to first rotate a small clockwise angle before being driven backwardly while the release angle of the trigger hook is reached. The energy transmitted from the trigger cam mechanism is considered to be dissipated in the forms of rotational kinetic energy of the main shaft
and the elastic potential energy of the open spring and the wipe spring, as respectively denoted in the bond graph of Fig. 4(e) by elements I: Js, C: ko, and C: kw. The angular velocity of the main shaft, θ&3, transmitted from the trigger cam mechanism, is transformed into the linear velocity of the open spring and that of the wipe spring by TF of modulus s1 and s2 respectively.
By combining the five sub-models described above, the complete bond graph model of the system is shown in Fig. 6. Based on this model, a computer program for simulating the dynamic response of the system is developed by using the 20-sim simulation languages. It should be noted that since this report only concerns the THRT, therefore, the simulation is carried out only up to the time when the release angle of the trigger hook is reached.
3. CALIBRATION OF SYSTEM PARAMETERS
As discussed in the pervious section, the value of the stiffness constant K as calculated by Eq. (2) is based on the force model of impact between two spheres of isotropic material, which may not be consistent with the material property and structural complexity of the real system. In addition, the precise value of the friction coefficient bh
corresponding to the R element of the bond graph model shown in Fig. 4(c) is difficult to obtain as it includes the combined effects of the friction of the trigger hook shaft and that between the trigger cam and the roller. In this section, an iterative method for calibrating these two constants according to the simulation results and experiment data is presented.
To calibrate the stiffness constant, an initial value of which is first calculated by using equation (2), and a numerical simulation is carried out under a nominal operation
condition such as rated voltage to evaluate the duration time of the contact period. An experiment under the same nominal condition is then performed on the real system and the actual time of contact period is measured for comparison. If the later is larger than the former, then it implies that the estimated value of the stiffness constant K should be reduced, otherwise it should be increased. Consequently, a one dimensional search algorithm can be applied along with the simulation process to adjust the stiffness constant until the simulated duration time of contact period converges to the measured time.
A similar approach can be used for calibrating the value of the friction coefficient bh. A numerical simulation with no friction (i.e. bh = 0) is first carried out to evaluate the duration time of the after-contact period, which is then compared against the experiment data obtained under the same nominal condition, and the value of bh can be gradually increased until the two data are consistent to each other.
4. COMPARISON OF SIMULATION AND EXPERIMENT DATA
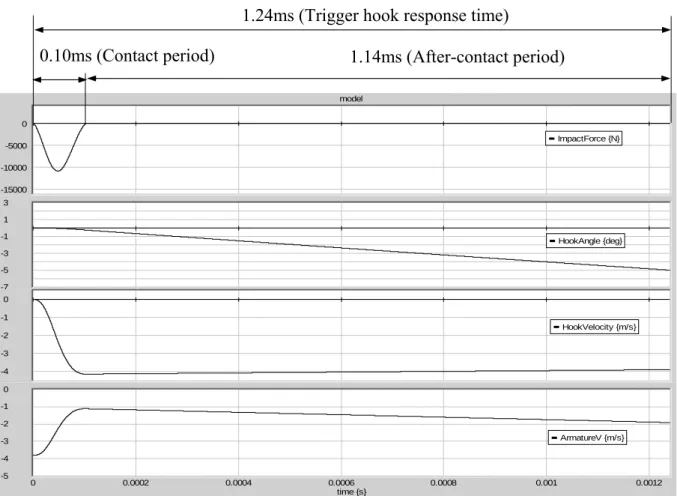
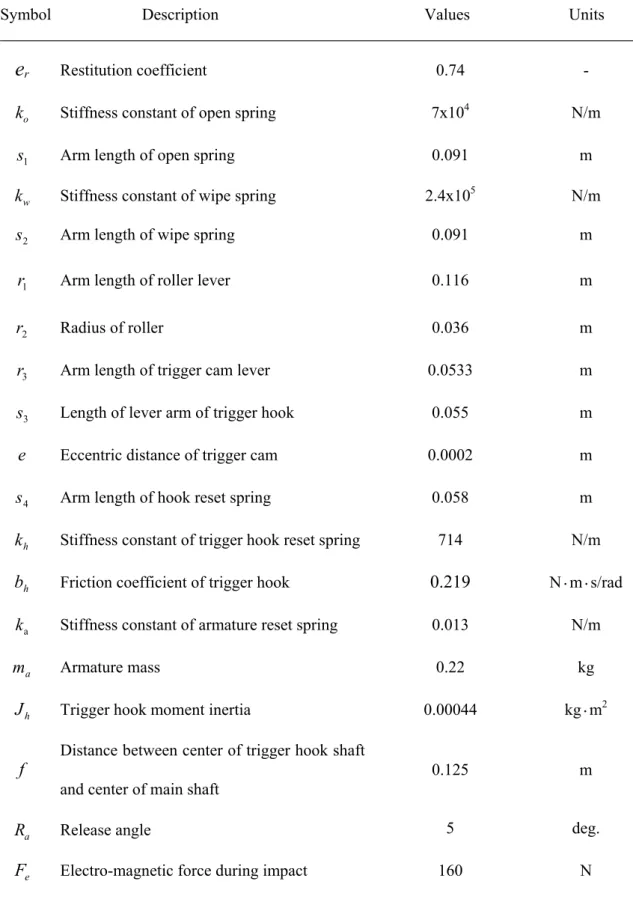
A practical example is presented in this section to demonstrate the effectiveness and accuracy of the proposed method. The measured dimensions and system parameters of the mechanism used for the example is given in Table 1, in which the restitution coefficient er of 0.74 is obtained from data of hard steel (Goldsmith, 1960). By using Eq.(2), the value of the stiffness constant K is first estimated to be 8.3×10⁹ N/m, and the simulation is carry out at rated voltage of 110 V which rendered an impact velocity of 3.8 m/s. The simulated results of the impact force, trigger hook angle, trigger hook velocity, and armature velocity are shown in Fig. 7. As indicated in the figure, the simulated THRT is 1.24 ms, which consists of a contact period of 0.10 ms and an
after-contact period of 1.14 ms.
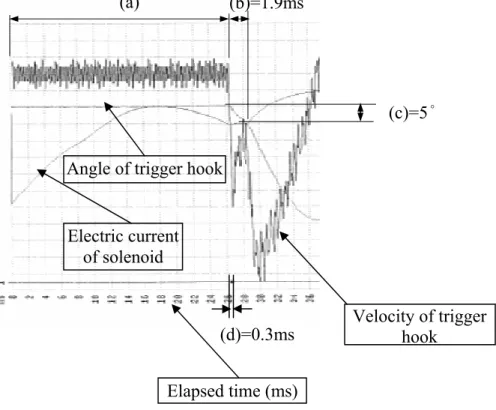
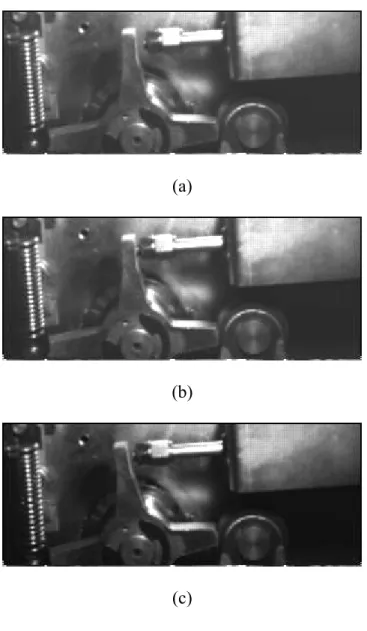
An experiment is performed on the real system under the same condition and rated voltage. In which the rotation angle of the trigger hook is measured at the center of trigger hook shaft by a high precision potentiometer and processed by an industrial oscillogram instrument (Breaker motion analyzer, Programma, Germany). The recorded oscillogram from the test is shown in Fig. 8, where the curves represent, respectively, the electrical current of the solenoid and the velocity and rotation angle of the trigger hook. A line of contact detection with respect to time is also recorded. Accordingly, the real contact period and the THRT can be read respectively as 0.3 ms and 1.9 ms from the figure. Since the duration of the contact period is very short yet the measurement accuracy of which is critical for calibrating the stiffness constant of the bond graph model, the data recorded on the oscillogram are double checked and confirmed by a high speed camera with the capacity of maximum 16000 frames per second (Motion scope, Redlake [Kodak], USA). The contacting movements of the mechanism as captured by the camera are demonstrated in Fig. 9.
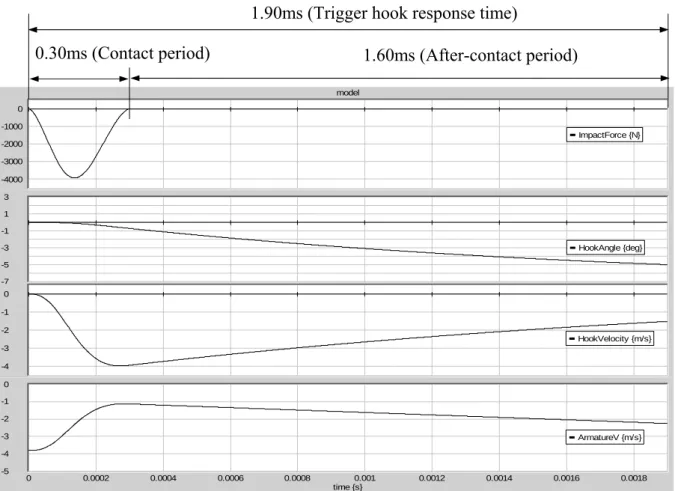
Based on the results of the measurements, calibrations for the stiffness constant and the friction coefficient of the trigger hook were carried out by using the algorithm described in the last section, and the equivalent constants were respectively found to be K = 6.25×10⁸ N/m and bh = 0.219 N·m·s/rad. Fig. 10 shows the simulation result based on the calibrated values, it is clear to see that in this case the simulated contact period and the THRT are virtually identical to the measured ones.
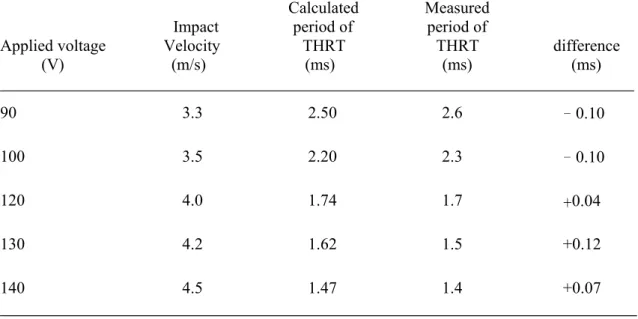
In order to further validate the calibrated parameters, the simulations are then carried out with respect to five different applied voltages of 90V, 100V, 120V, 130V and 140V. The simulated results of the THRTs are collected and compared with the
experimental data, as listed in Table 2. It can be seen that the differences between the two sets of data are no greater than the precision scale (0.1 ms) of the measuring instrument, and hence the accuracy and effectiveness of the calibration process is justified.
5. CONCLUSIONS
A systematic approach to predict the trigger hook response time of high-voltage circuit breaker has been developed in this report. By using bond graph formulation, the topology-changing problem of the mechanism is simplified by introducing a continuous contact force module with switched zero-junctions. An effective method based on experimental data for calibrating the equivalent stiffness constant and friction coefficient of the system is also presented. Numerical examples indicate that the proposed approach provides a convenient and accurate method of predicting the THRT.
In addition, a realistic estimation of the amount of the impact force, which is useful for determining the necessary strength of the trigger hook and the armature but difficult to be measured experimentally, can be obtained alongside of the simulation process.
Therefore, it is believed that the presented approach can be adopted in future researches on the optimal design of high-voltage circuit breaker mechanisms.
REFERENCES
Breedveld, P. C. (2002). Modelling & Simulation of Bouncing Objects: Newton’s Cradle Revisited. Proc. of Mechatronics 2002, University of Twente :810-819.
Gilmore, B. J. , Cipra, R.J. (1991). Simulation of Planar Dynamic Mechanical Systems with Changing Topologies. ASME Journal of Mechanical Design 113:70 – 83.
Goldsmith, W. (1960). Impact, the Theory and Physical Behavior of Colliding Solids.
London: Edward Arnold Publishers.
Hunt, K. H. , Crossley, F. R. E. (1975). Coefficient of Restitution Interpreted as Damping in Vibroimpact. Trans. ASME, Journal of Applied Mechanics 42:440-445.
Lankarani, Hamid M. , Nikravesh Parviz E. (1994). Continuous Contact Force Models for Impact in Multibody Systems. Nonlinear Dynamics 5: 193-207.
Lequesne, B. (1990). Dynamic model of solenoids under impact excitation, including motion and eddy currents – Part II . IEEE Trans. Magn. 26:1107-1116.
Marielle, P. , Sangha, P. et al. (1999). Rapid Computer-Aided Design Method for Fast-Acting Solenoid Actuators. IEEE Trans. Industry Application 35:991-999.
NEMA Circuit Breaker Section (1994). What is the purpose of a Circuit Breaker?
Electrical Construction & Maintenance. 93(7): 22-26.
Paul, B. (1979). Kinematics and Dynamics of Planar Machinery. Englewood Cliffs:
Prentice-Hall Inc.
Pawlak, A. M., Nehl, T. W. (1988). Transient finite element modeling of solenoid actuators: The coupled power electronics, mechanical, and magnetic field problems.
IEEE Trans. Magn. 24:270-273.
Root, R. R. , Ragsdell, K. M. (1983). Circuit Breaker- A Practical Example in
List of Figures
Figure 1. Physical sketch drawing of the investigated driving mechanism.
Figure 2. Motion sequence of “opening operation” in the investigated driving mechanism.
Figure 3. Simplified schematic diagram of the driving mechanism. (a) Armature of Solenoid; (b) Impact Contact Between Armature and Trigger Hook; (c) Trigger Hook;
(d) Trigger Cam and Roller; (e) Main Shaft.
Figure 4. Bond graphs of five subsystems. (a) Armature of Solenoid; (b) Impact Contact Between Armature and Trigger Hook; (c) Trigger Hook; (d) Trigger Cam and Roller; (e) Main Shaft.
Figure 5. Equivalent four-bar linkage for trigger cam and roller mechanism.
Figure 6. The complete bond graph of the driving mechanism.
Figure 7. Calculated results of interested variables at 110 V before calibration.
Figure 8. Recorded oscillogram of trigger hook at 110V.
Figure 9. Captured pictures of impact motion at (a) before contacting (b) during contacting (c) after contacting.
Figure 10. Calculated results of interested variables at 110 V after calibration.
Figure 1. Physical sketch drawing of the investigated driving mechanism.
Figure 2. Motion sequence of “opening operation” in the investigated driving mechanism.
Figure 3. Simplified schematic diagram of the driving mechanism. (a) Armature of Solenoid; (b) Impact Contact Between Armature and Trigger Hook; (c) Trigger Hook;
(d) Trigger Cam and Roller; (e) Main Shaft.
Figure 4. Bond graphs of five subsystems. (a) Armature of Solenoid; (b) Impact Contact Between Armature and Trigger Hook; (c) Trigger Hook; (d) Trigger Cam and Roller; (e) Main Shaft.
Figure 5. Equivalent four-bar linkage for trigger cam and roller mechanism.
model
-15000 -10000 -5000 0
ImpactForce {N}
-7 -5 -3 -1 1 3
HookAngle {deg}
-4 -3 -2 -1 0
HookVelocity {m/s}
0 0.0002 0.0004 0.0006 0.0008 0.001 0.0012
time {s}
-5 -4 -3 -2 -1 0
ArmatureV {m/s}
Figure 7. Calculated results of interested variables at 110 V before calibration.
0.10ms (Contact period)
1.24ms (Trigger hook response time)
1.14ms (After-contact period)
Figure 8. Recorded oscillogram of trigger hook at 110V.
Electric current of solenoid
Angle of trigger hook
Velocity of trigger hook
(a) (b)=1.9ms
(a):Solenoid acting time
(b):Trigger hook response time(THRT) (c):Release angle
(d):Contact period
Elapsed time (ms)
(c)=5°
(d)=0.3ms
(a)
(b)
(c)
Figure 9. Captured pictures of impact motion at (a) before contacting (b) during contacting (c) after contacting.
model
-4000 -3000 -2000 -1000 0
ImpactForce {N}
-7 -5 -3 -1 1 3
HookAngle {deg}
-4 -3 -2 -1 0
HookVelocity {m/s}
0 0.0002 0.0004 0.0006 0.0008 0.001 0.0012 0.0014 0.0016 0.0018
time {s}
-5 -4 -3 -2 -1 0
ArmatureV {m/s}
Figure 10. Calculated results of interested variables at 110 V after calibration.
0.30ms (Contact period)
1.90ms (Trigger hook response time)
1.60ms (After-contact period)
List of Tables
Table 1. System parameters for the bond graphs of the investigated system Table 2. Comparison between simulated results and measured results
Table 1. System parameters for the bond graphs of the investigated system
Symbol Description Values Units
er Restitution coefficient 0.74 -
ko Stiffness constant of open spring 7x10⁴ N/m
s1 Arm length of open spring 0.091 m
kw Stiffness constant of wipe spring 2.4x10⁵ N/m
s2 Arm length of wipe spring 0.091 m
r1 Arm length of roller lever 0.116 m
r2 Radius of roller 0.036 m
r3 Arm length of trigger cam lever 0.0533 m s3 Length of lever arm of trigger hook 0.055 m e Eccentric distance of trigger cam 0.0002 m
s4 Arm length of hook reset spring 0.058 m kh Stiffness constant of trigger hook reset spring 714 N/m bh Friction coefficient of trigger hook 0.219 N·m·s/rad ka Stiffness constant of armature reset spring 0.013 N/m
ma Armature mass 0.22 kg
Jh Trigger hook moment inertia 0.00044 kg·m2
f Distance between center of trigger hook shaft and center of main shaft
0.125 m
Ra Release angle 5 deg.
Fe Electro-magnetic force during impact 160 N
Table 2. Comparison between simulated results and measured results
Calculated Measured
Impact period of period of
Applied voltage Velocity THRT THRT difference (V) (m/s) (ms) (ms) (ms)
90 3.3 2.50 2.6 –0.10
100 3.5 2.20 2.3 –0.10
120 4.0 1.74 1.7 +0.04
130 4.2 1.62 1.5 +0.12
140 4.5 1.47 1.4 +0.07
國科會補助計畫衍生研發成果推廣資料表
日期:2011/10/31
國科會補助計畫
計畫名稱: 以能量流程圖應用於高壓電斷路器動力分析之研究 計畫主持人: 徐茂濱
計畫編號: 99-2221-E-011-015- 學門領域: 機構與傳動
無研發成果推廣資料
99 年度專題研究計畫研究成果彙整表
計畫主持人:徐茂濱 計畫編號:99-2221-E-011-015- 計畫名稱:以能量流程圖應用於高壓電斷路器動力分析之研究
量化
成果項目 實際已達成
數(被接受 或已發表)
預期總達成 數(含實際已
達成數)
本計畫實 際貢獻百
分比
單位
備 註 ( 質 化 說 明:如 數 個 計 畫 共 同 成 果、成 果 列 為 該 期 刊 之 封 面 故 事 ...
等)
期刊論文 0 0 100%
研究報告/技術報告 0 0 100%
研討會論文 0 0 100%
論文著作 篇
專書 0 0 100%
申請中件數 0 0 100%
專利 已獲得件數 0 0 100% 件
件數 0 0 100% 件
技術移轉
權利金 0 0 100% 千元
碩士生 2 0 100%
博士生 1 0 100%
博士後研究員 0 0 100%
國內
參與計畫人力
(本國籍)
專任助理 0 0 100%
人次
期刊論文 0 1 100%
研究報告/技術報告 0 0 100%
研討會論文 0 0 100%
論文著作 篇
專書 0 0 100% 章/本
申請中件數 0 0 100%
專利 已獲得件數 0 0 100% 件
件數 0 0 100% 件
技術移轉
權利金 0 0 100% 千元
碩士生 2 0 100%
博士生 1 0 100%
博士後研究員 0 0 100%
國外
參與計畫人力
(外國籍)
專任助理 0 0 100%
人次
其他成果
(無法以量化表達之成
果如辦理學術活動、獲 得獎項、重要國際合 作、研究成果國際影響 力及其他協助產業技 術發展之具體效益事 項等,請以文字敘述填 列。)
本計畫提出一種以能量流程圖為基礎的方法對高壓電斷路器的驅動機構進行動 力分析。於本方法中,斷路器驅動機構於運動過程中的拓樸構造改變,以及其 中複雜的碰撞現象,皆在該機構之能量流程圖模型中以具有切換功能的零接點 及連續接觸力模組來加以模擬,此舉不僅具有技術創新性,並可以大幅簡化數 值分析方法的複雜度,故亦極具實用價值。
此外,本計畫提出一基於簡單的實驗數據來校準能量流程圖模型中的參數的法 則,其效用與精度皆與實際機構的實驗數據比較得到證實,故可進一步應用於 此類機構之最佳化設計之上。
成果項目 量化 名稱或內容性質簡述
測驗工具(含質性與量性) 0
課程/模組 0
電腦及網路系統或工具 0
教材 0
舉辦之活動/競賽 0
研討會/工作坊 0
電子報、網站 0
科 教 處 計 畫 加 填 項
目 計畫成果推廣之參與(閱聽)人數 0
國科會補助專題研究計畫成果報告自評表
請就研究內容與原計畫相符程度、達成預期目標情況、研究成果之學術或應用價 值(簡要敘述成果所代表之意義、價值、影響或進一步發展之可能性)、是否適 合在學術期刊發表或申請專利、主要發現或其他有關價值等,作一綜合評估。
1. 請就研究內容與原計畫相符程度、達成預期目標情況作一綜合評估
■達成目標
□未達成目標(請說明,以 100 字為限)
□實驗失敗
□因故實驗中斷
□其他原因 說明:
2. 研究成果在學術期刊發表或申請專利等情形:
論文:□已發表 □未發表之文稿 ■撰寫中 □無 專利:□已獲得 □申請中 ■無
技轉:□已技轉 □洽談中 ■無 其他:(以 100 字為限)
3. 請依學術成就、技術創新、社會影響等方面,評估研究成果之學術或應用價 值(簡要敘述成果所代表之意義、價值、影響或進一步發展之可能性)(以 500 字為限)
本計畫提出一種以能量流程圖為基礎的方法對高壓電斷路器的驅動機構進行動力分析。於 本方法中,斷路器驅動機構於運動過程中的拓樸構造改變,以及其中複雜的碰撞現象,皆 在該機構之能量流程圖模型中以具有切換功能的零接點及連續接觸力模組來加以模擬,此 舉不僅具有技術創新性,並可以大幅簡化數值分析方法的複雜度,故亦極具實用價值。
此外,本計畫提出一基於簡單的實驗數據來校準能量流程圖模型中的參數的法則,其效用 與精度皆與實際機構的實驗數據比較得到證實,故可進一步應用於此類機構之最佳化設計 之上。